| Param | Original file | Final file |
|---|---|---|
| Filename | modeM0/AS1A06_003T01_9000002786_18651cztM0_level2.evt | modeM0/AS1A06_003T01_9000002786_18651cztM0_level2_quad_clean.evt |
| Size (bytes) | 1,602,440,640 | 255,533,760 |
| Size | 1.5 GB | 243.7 MB |
| Events in quadrant A | 9,434,891 | 1,635,037 |
| Events in quadrant B | 9,564,607 | 1,665,946 |
| Events in quadrant C | 9,920,334 | 1,616,144 |
| Events in quadrant D | 18,265,880 | 1,450,268 |
| Mode SS | |||
|---|---|---|---|
| Quadrant | BADHDUFLAG | Total packets | Discarded packets |
| A | 0 | 406 | 0 |
| B | 0 | 406 | 0 |
| C | 0 | 406 | 0 |
| D | 0 | 406 | 0 |
| Mode M0 | |||
|---|---|---|---|
| Quadrant | BADHDUFLAG | Total packets | Discarded packets |
| A | 0 | 40969 | 4 |
| B | 0 | 41366 | 4 |
| C | 0 | 42225 | 4 |
| D | 0 | 67928 | 4 |
| Mode M9 | |||
|---|---|---|---|
| Quadrant | BADHDUFLAG | Total packets | Discarded packets |
| A | 0 | 19 | 0 |
| B | 0 | 19 | 0 |
| C | 0 | 19 | 0 |
| D | 0 | 19 | 0 |
| Quadrant | Total seconds | Saturated seconds | Saturation percentage |
|---|---|---|---|
| A | 19915 | 218 | 1.094652% |
| B | 19916 | 321 | 1.611769% |
| C | 19916 | 406 | 2.038562% |
| D | 19916 | 3028 | 15.203856% |
Noise dominated data is calculated using 1-second bins in cleaned event files. If a bin has >2000 counts, and if more than 50% of those come from <1% of pixels, then it is considered to be noise-dominated and hence unusable.
| Quadrant | # 1 sec bins | Bins with >0 counts | Bins with >2000 counts | High rate bins dominated by noise | Noise dominated (total time) | Noise dominated (detector-on time) | Marked lightcurve |
|---|---|---|---|---|---|---|---|
| A | 21705 | 19919 | 0 | 0 | 0.00% | 0.00% | 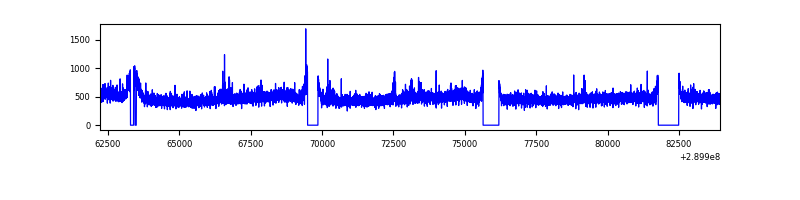 |
| B | 21706 | 19919 | 22 | 22 | 0.10% | 0.11% | 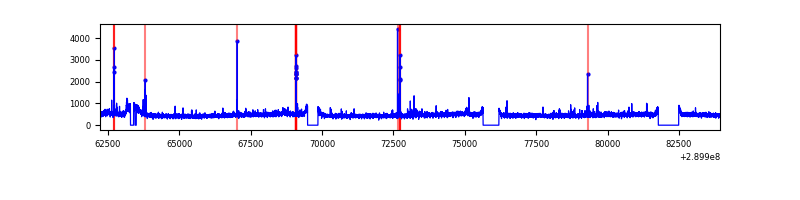 |
| C | 21706 | 19921 | 65 | 65 | 0.30% | 0.33% | 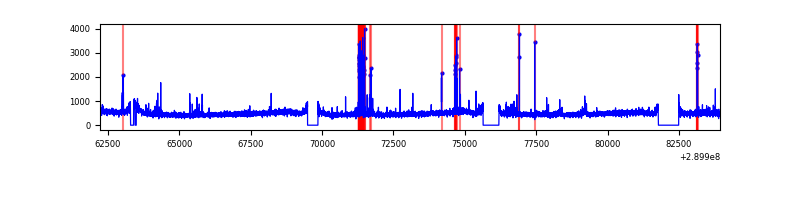 |
| D | 21706 | 19920 | 2652 | 2652 | 12.22% | 13.31% | 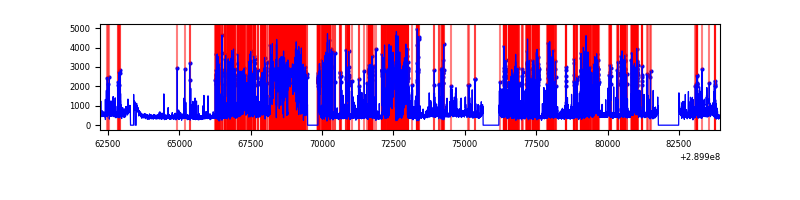 |
Top three noisy pixels from each quadrant. If the there are fewer than three noisy pixels in the level2.evt file, extra rows are filled as -1
| Pixel properties | Quadrant properties | ||||||
|---|---|---|---|---|---|---|---|
| Quadrant | DetID | PixID | Counts | Sigma | Mean | Median | Sigma |
| A | 0 | 13 | 188955 | 387.09 | 2386 | 2331 | 482.1 |
| A | 6 | 16 | 39227 | 76.53 | 2386 | 2331 | 482.1 |
| A | 13 | 254 | 25777 | 48.63 | 2386 | 2331 | 482.1 |
| B | 0 | 244 | 69943 | 148.8 | 2380 | 2313 | 454.5 |
| B | 0 | 230 | 59843 | 126.58 | 2380 | 2313 | 454.5 |
| B | 12 | 111 | 57549 | 121.53 | 2380 | 2313 | 454.5 |
| C | 9 | 221 | 422143 | 776.31 | 2303 | 2311 | 540.8 |
| C | 14 | 238 | 356989 | 655.83 | 2303 | 2311 | 540.8 |
| C | 3 | 233 | 126433 | 229.51 | 2303 | 2311 | 540.8 |
| D | 1 | 52 | 8737076 | 16788.97 | 2156 | 2095 | 520.3 |
| D | 7 | 238 | 1090566 | 2092.08 | 2156 | 2095 | 520.3 |
| D | 1 | 20 | 112940 | 213.05 | 2156 | 2095 | 520.3 |
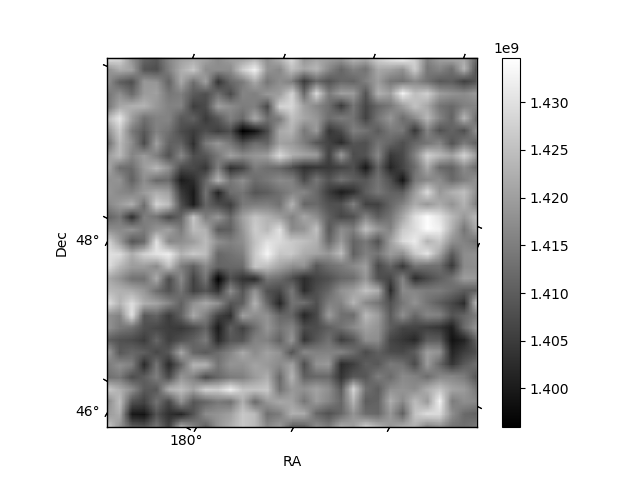
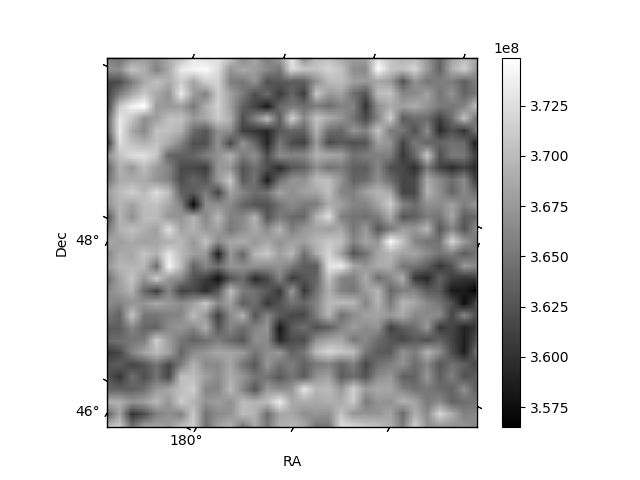
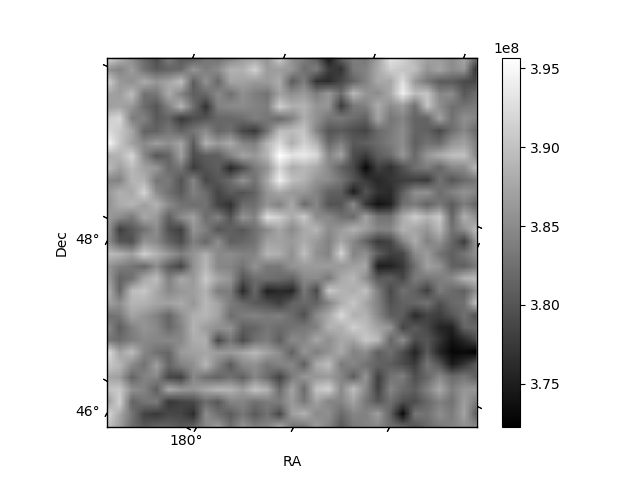
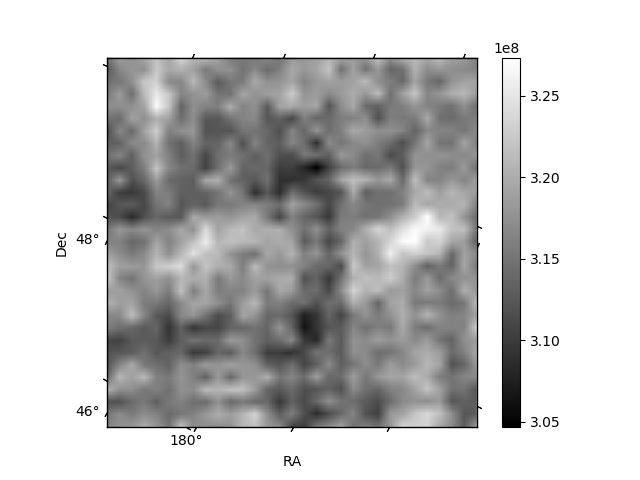
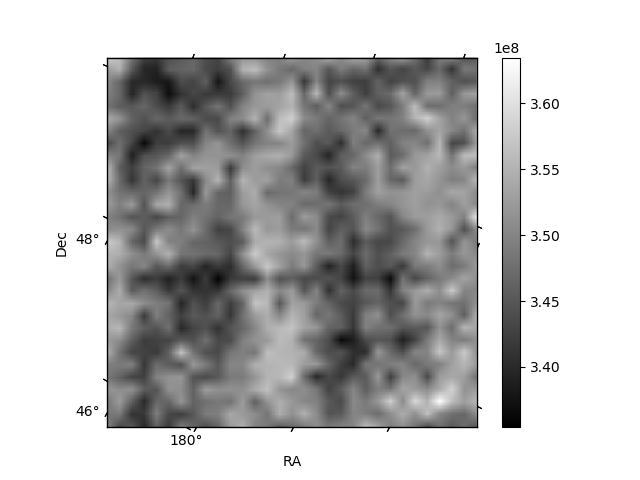
Histogram calculated using DETX and DETY for each event in the final _common_clean file
| Quadrant A | 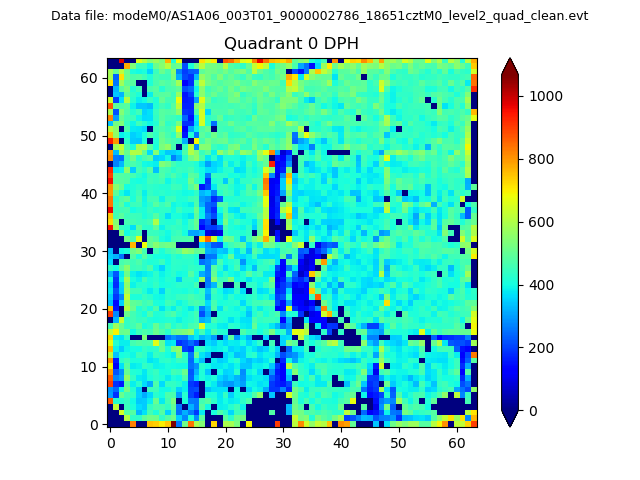 |
 |
Quadrant B |
|---|---|---|---|
| Quadrant D | 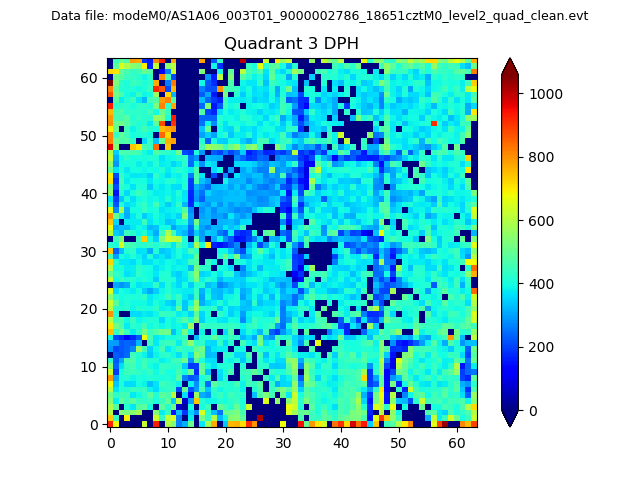 |
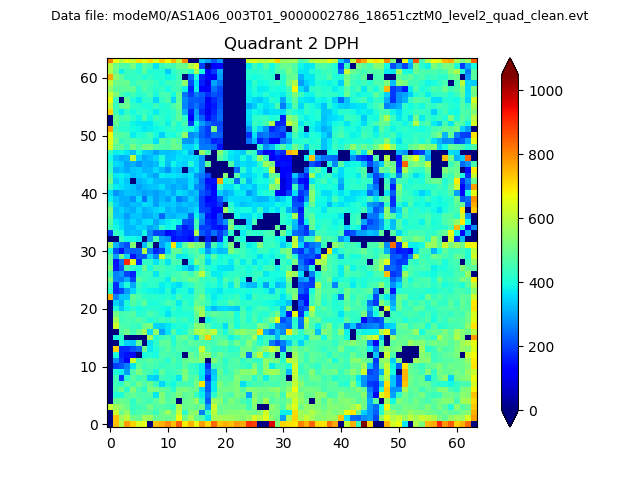 |
Quadrant C |
| Plot type | Count rate plots | Images |
|---|---|---|
| Comparison with Poisson distribution Blue bars denote a histogram of data divided into 1 sec bins. Red curve is a Poisson curve with rate = median count rate of data. |
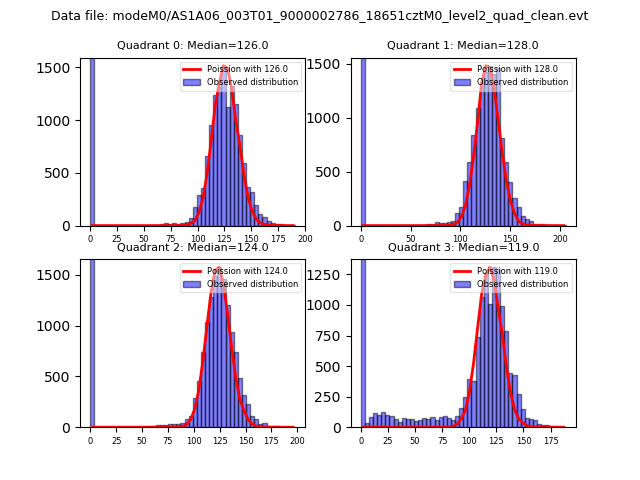 |
 |
| Quadrant-wise count rates Data is divided into 100 sec bins |
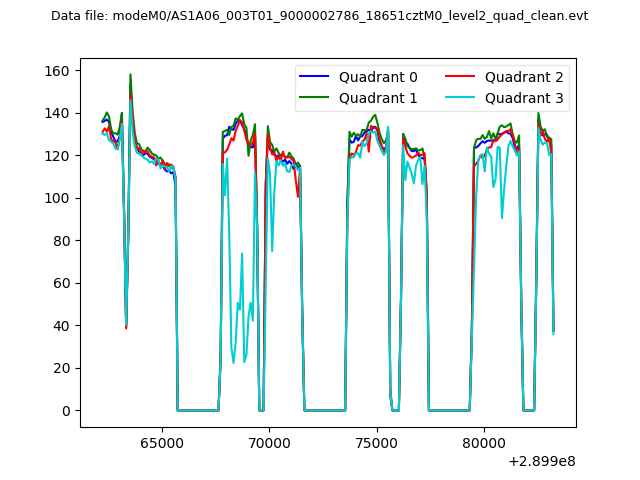 |
|
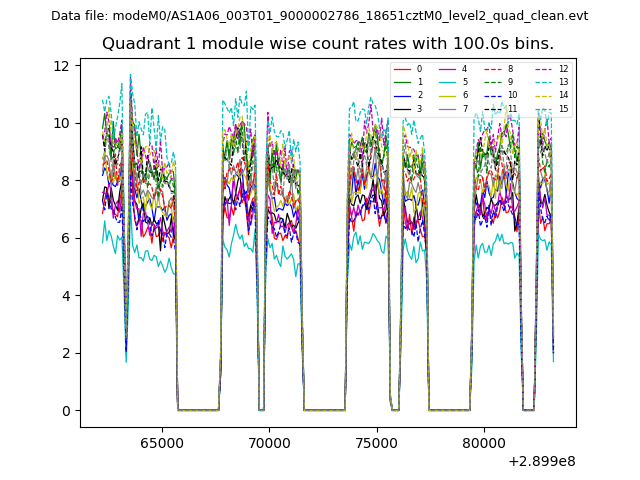
| Module-wise count rates for Quadrant A Data is divided into 100 sec bins |
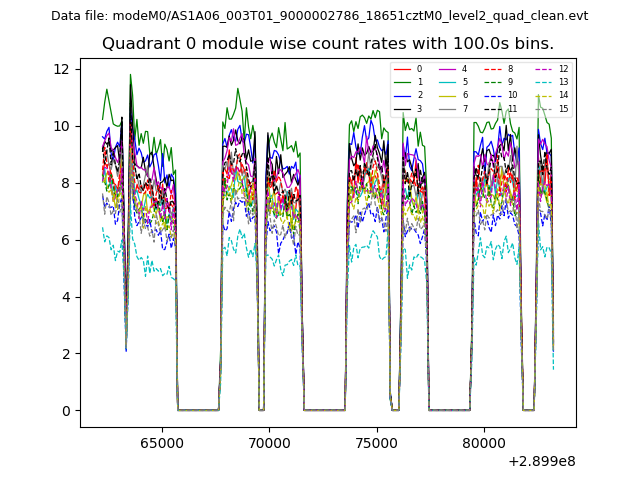 |
 |
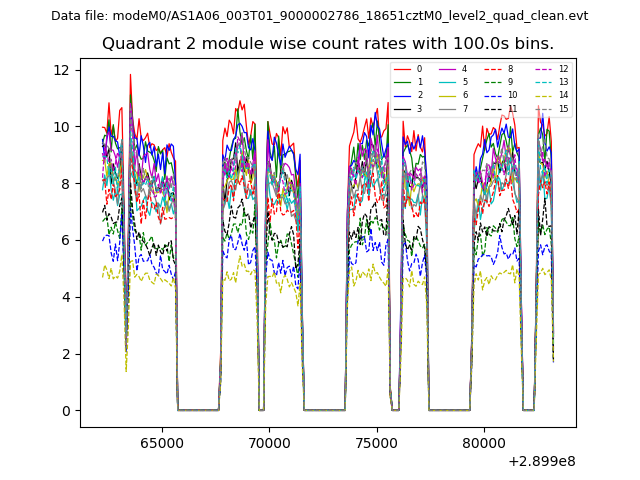
| Module-wise count rates for Quadrant B Data is divided into 100 sec bins |
 |
 |
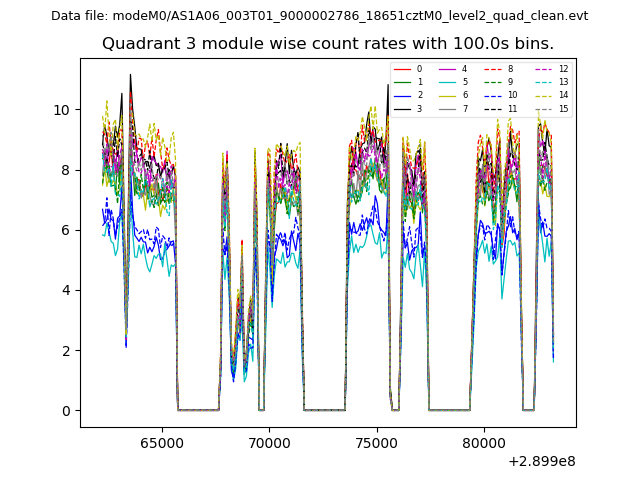
| Module-wise count rates for Quadrant C Data is divided into 100 sec bins |
 |
 |
| Module-wise count rates for Quadrant D Data is divided into 100 sec bins |
 |
 |
| Parameter | Plot |
|---|---|
| CZT HV Monitor | 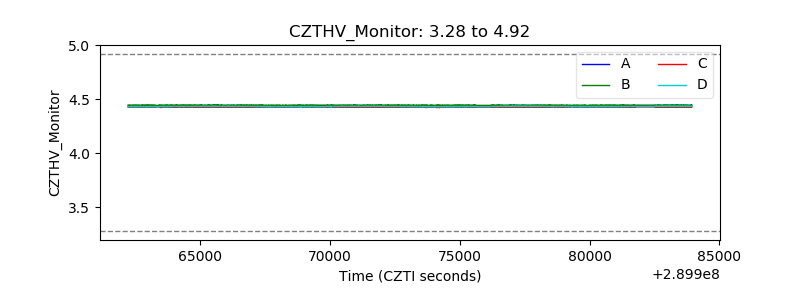 |
| D_VDD | 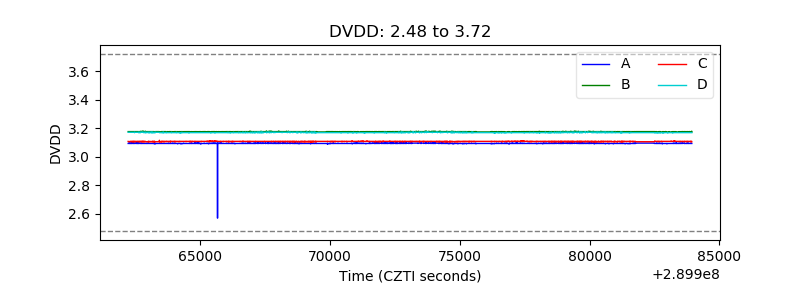 |
| Temperature 1 | 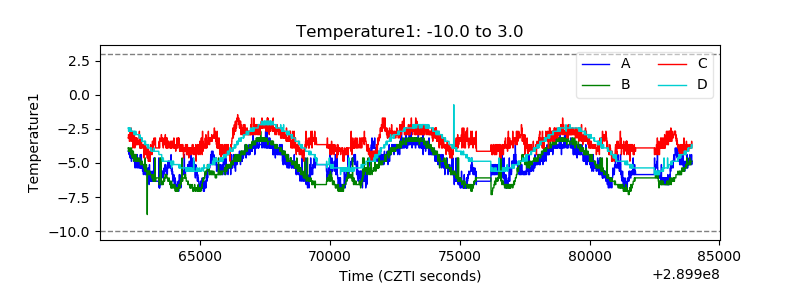 |
| Veto HV Monitor | 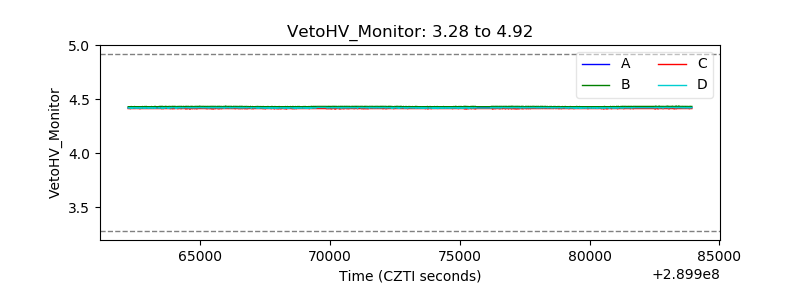 |
| Veto LLD | 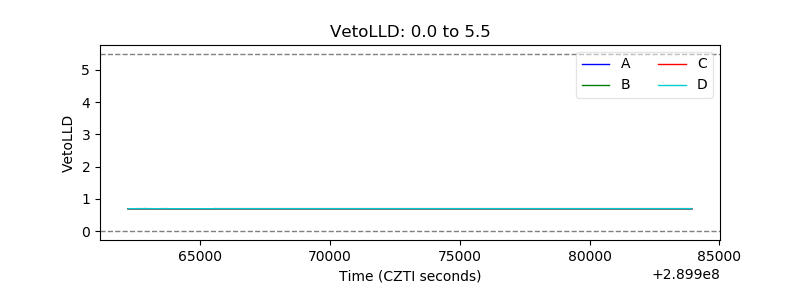 |
| Alpha Counter | 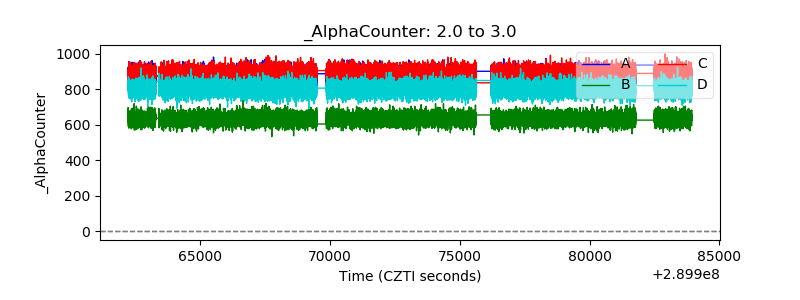 |
| _CPM_Rate | 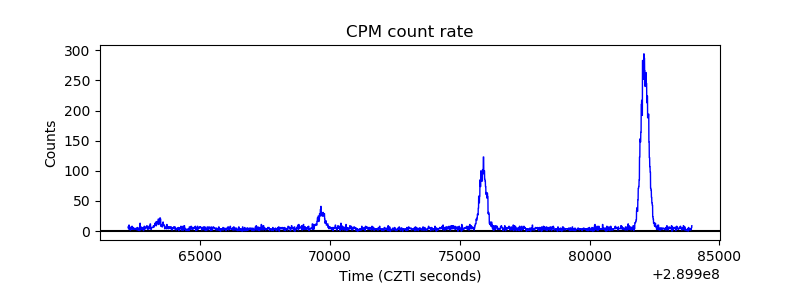 |
| CZT Counter | 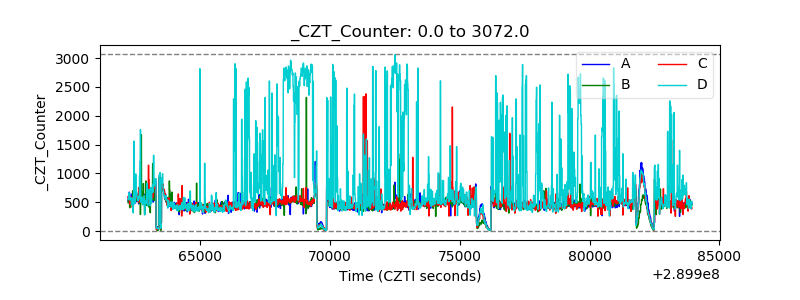 |
| +2.5 Volts monitor |  |
| +5 Volts monitor |  |
| _ROLL_ROT | 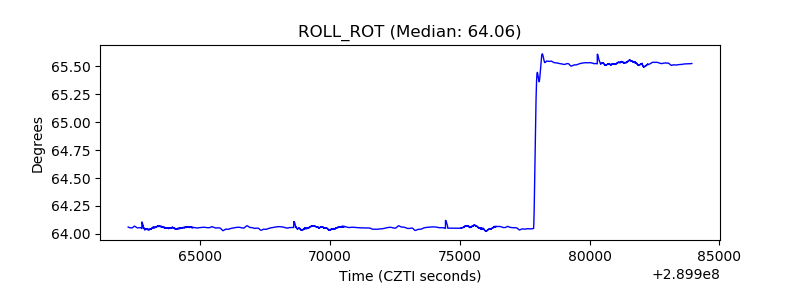 |
| _Roll_DEC | 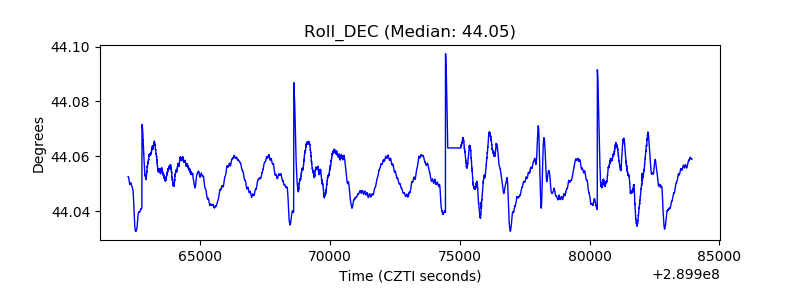 |
| _Roll_RA | 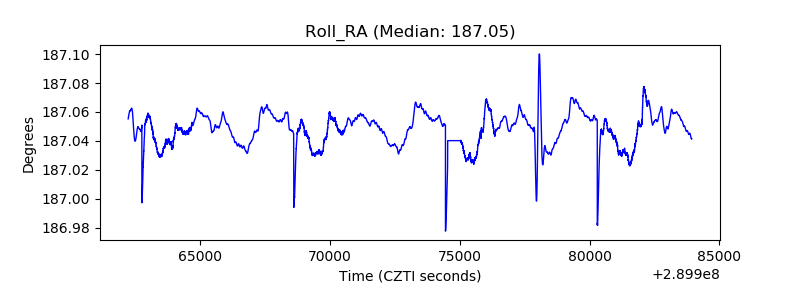 |
| Veto Counter | 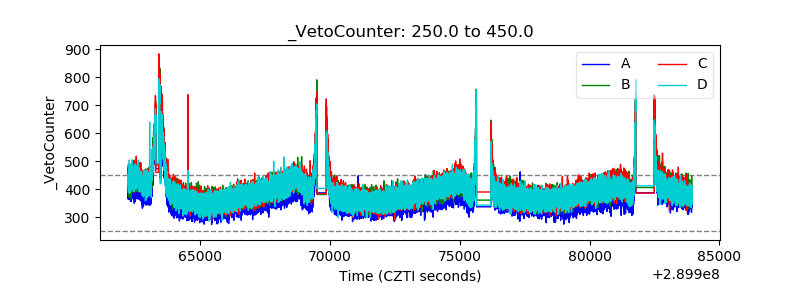 |