| Param | Original file | Final file |
|---|---|---|
| Filename | modeM0/AS1A06_003T01_9000002786_18655cztM0_level2.evt | modeM0/AS1A06_003T01_9000002786_18655cztM0_level2_quad_clean.evt |
| Size (bytes) | 542,260,800 | 68,780,160 |
| Size | 517.1 MB | 65.6 MB |
| Events in quadrant A | 3,897,132 | 413,474 |
| Events in quadrant B | 3,380,206 | 420,679 |
| Events in quadrant C | 4,187,590 | 395,808 |
| Events in quadrant D | 4,516,188 | 398,463 |
| Mode SS | |||
|---|---|---|---|
| Quadrant | BADHDUFLAG | Total packets | Discarded packets |
| A | 0 | 134 | 0 |
| B | 0 | 134 | 0 |
| C | 0 | 134 | 0 |
| D | 0 | 134 | 0 |
| Mode M0 | |||
|---|---|---|---|
| Quadrant | BADHDUFLAG | Total packets | Discarded packets |
| A | 0 | 15843 | 2 |
| B | 0 | 14137 | 2 |
| C | 0 | 16552 | 2 |
| D | 0 | 17740 | 2 |
| Mode M9 | |||
|---|---|---|---|
| Quadrant | BADHDUFLAG | Total packets | Discarded packets |
| A | 0 | 12 | 0 |
| B | 0 | 13 | 0 |
| C | 0 | 13 | 0 |
| D | 0 | 13 | 0 |
| Quadrant | Total seconds | Saturated seconds | Saturation percentage |
|---|---|---|---|
| A | 6503 | 119 | 1.829925% |
| B | 6503 | 96 | 1.476242% |
| C | 6503 | 328 | 5.043826% |
| D | 6502 | 414 | 6.367272% |
Noise dominated data is calculated using 1-second bins in cleaned event files. If a bin has >2000 counts, and if more than 50% of those come from <1% of pixels, then it is considered to be noise-dominated and hence unusable.
| Quadrant | # 1 sec bins | Bins with >0 counts | Bins with >2000 counts | High rate bins dominated by noise | Noise dominated (total time) | Noise dominated (detector-on time) | Marked lightcurve |
|---|---|---|---|---|---|---|---|
| A | 7653 | 6503 | 20 | 20 | 0.26% | 0.31% | 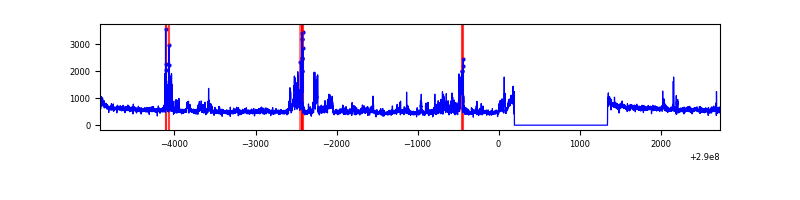 |
| B | 7653 | 6503 | 2 | 2 | 0.03% | 0.03% | 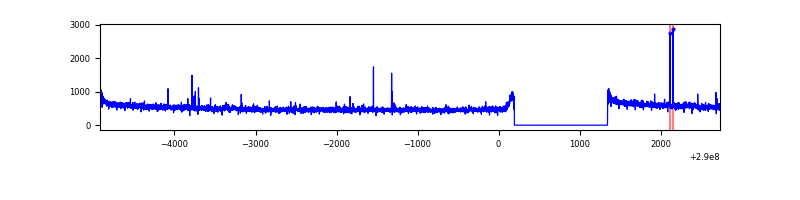 |
| C | 7653 | 6503 | 124 | 124 | 1.62% | 1.91% | 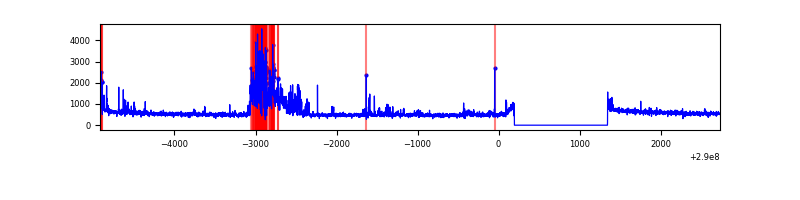 |
| D | 7652 | 6502 | 328 | 328 | 4.29% | 5.04% | 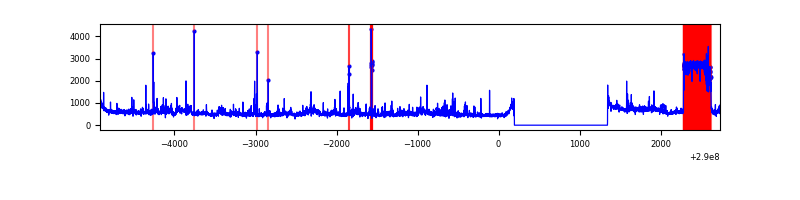 |
Top three noisy pixels from each quadrant. If the there are fewer than three noisy pixels in the level2.evt file, extra rows are filled as -1
| Pixel properties | Quadrant properties | ||||||
|---|---|---|---|---|---|---|---|
| Quadrant | DetID | PixID | Counts | Sigma | Mean | Median | Sigma |
| A | 0 | 13 | 532929 | 3081.19 | 864 | 849 | 172.7 |
| A | 6 | 16 | 25269 | 141.41 | 864 | 849 | 172.7 |
| A | 11 | 29 | 10381 | 55.2 | 864 | 849 | 172.7 |
| B | 12 | 111 | 19580 | 116.28 | 856 | 836 | 161.2 |
| B | 11 | 111 | 17145 | 101.17 | 856 | 836 | 161.2 |
| B | 14 | 111 | 15466 | 90.76 | 856 | 836 | 161.2 |
| C | 9 | 54 | 718966 | 3805.35 | 815 | 823 | 188.7 |
| C | 9 | 221 | 133100 | 700.92 | 815 | 823 | 188.7 |
| C | 14 | 238 | 128825 | 678.27 | 815 | 823 | 188.7 |
| D | 7 | 238 | 1038040 | 5303.69 | 811 | 789 | 195.6 |
| D | 1 | 52 | 290707 | 1482.41 | 811 | 789 | 195.6 |
| D | 1 | 20 | 56152 | 283.08 | 811 | 789 | 195.6 |
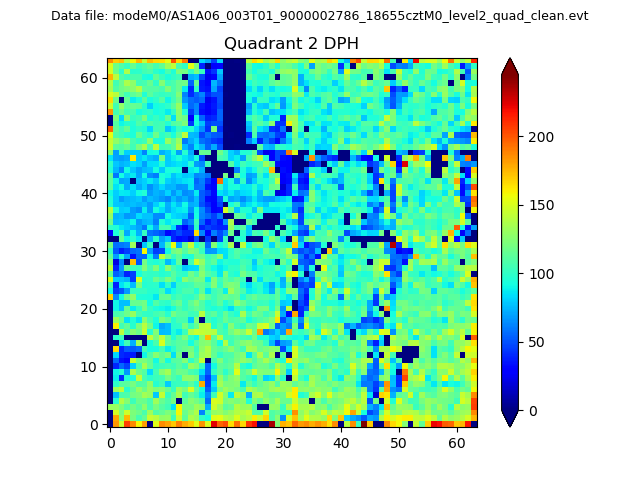
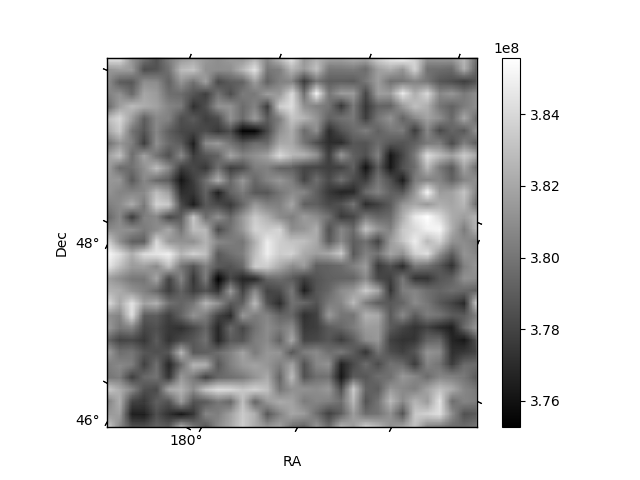
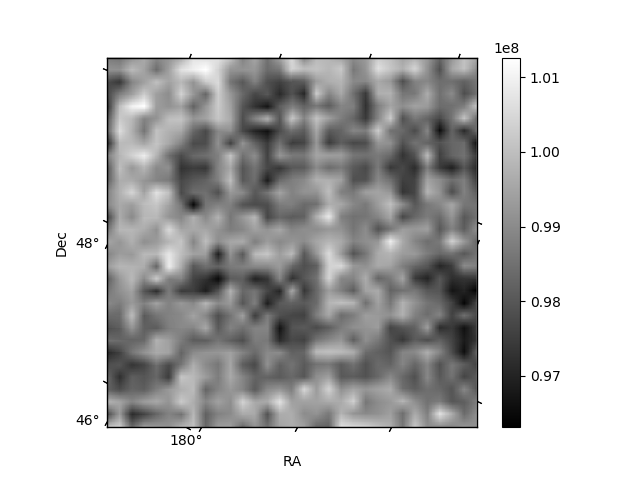
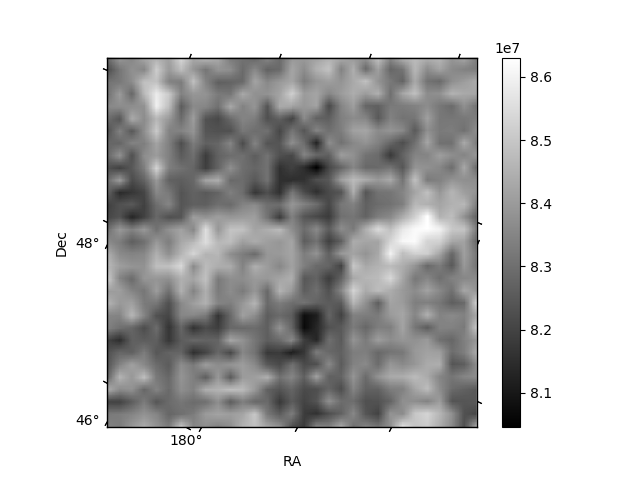
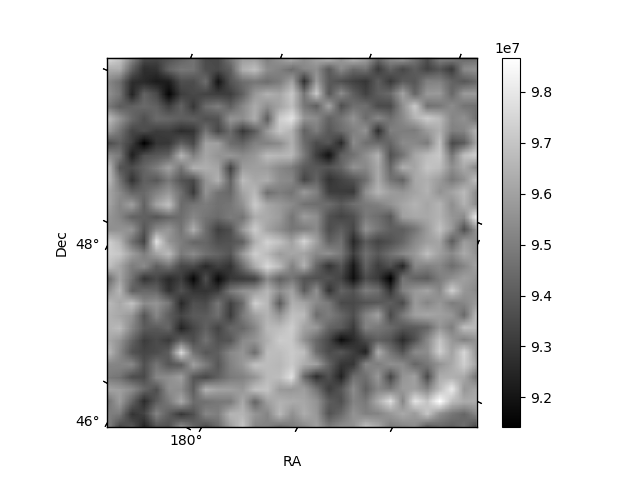
Histogram calculated using DETX and DETY for each event in the final _common_clean file
| Quadrant A | 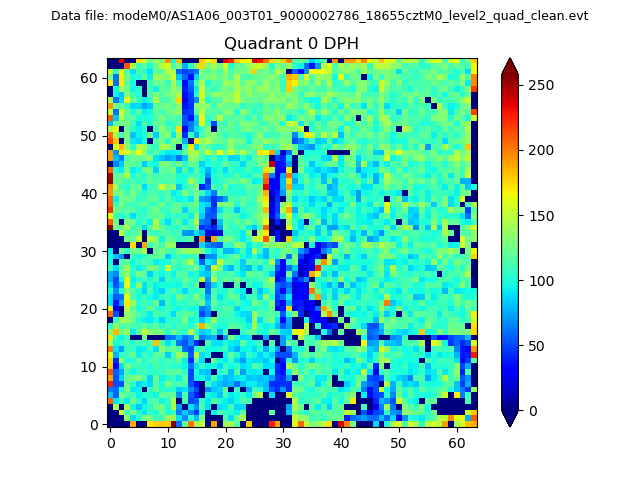 |
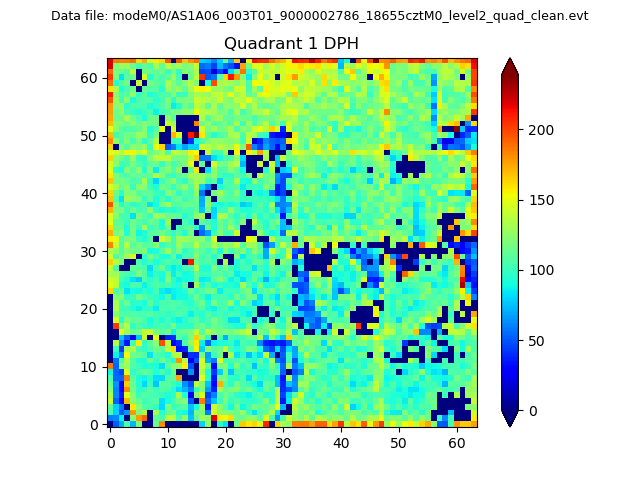 |
Quadrant B |
|---|---|---|---|
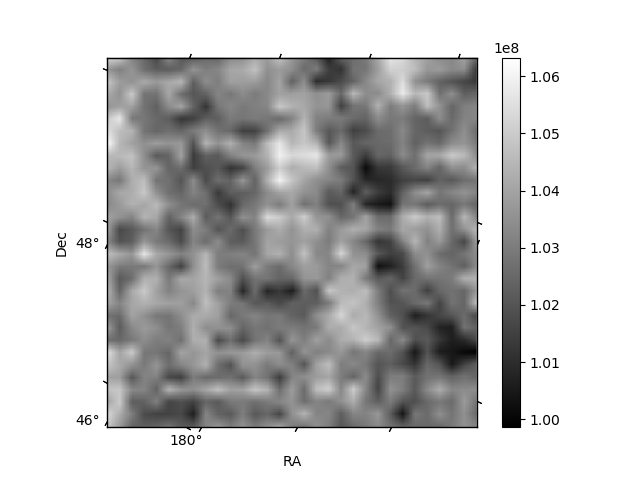
| Quadrant D | 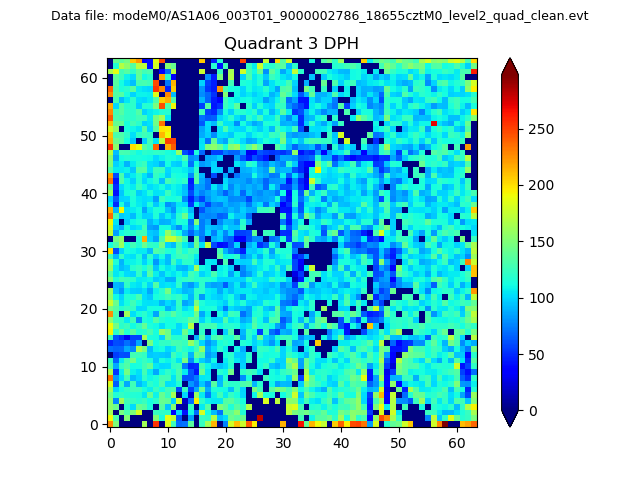 |
 |
Quadrant C |
| Plot type | Count rate plots | Images |
|---|---|---|
| Comparison with Poisson distribution Blue bars denote a histogram of data divided into 1 sec bins. Red curve is a Poisson curve with rate = median count rate of data. |
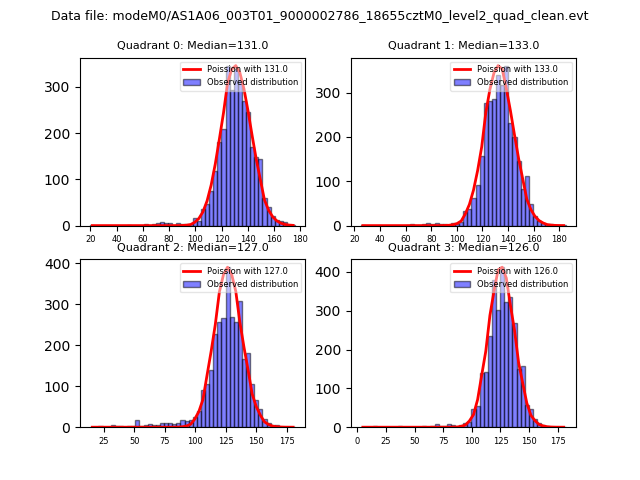 |
 |
| Quadrant-wise count rates Data is divided into 100 sec bins |
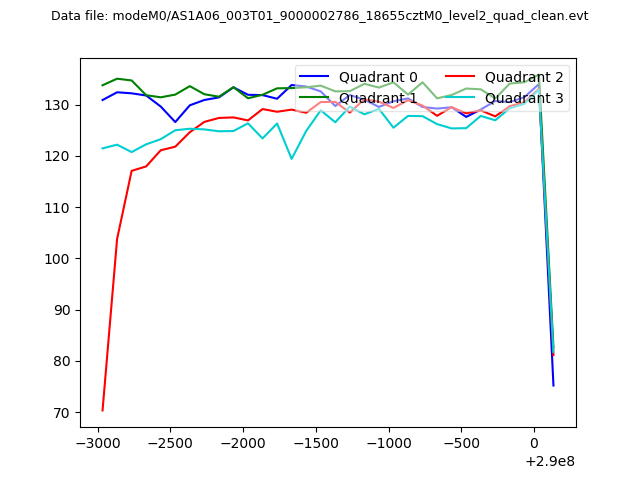 |
|
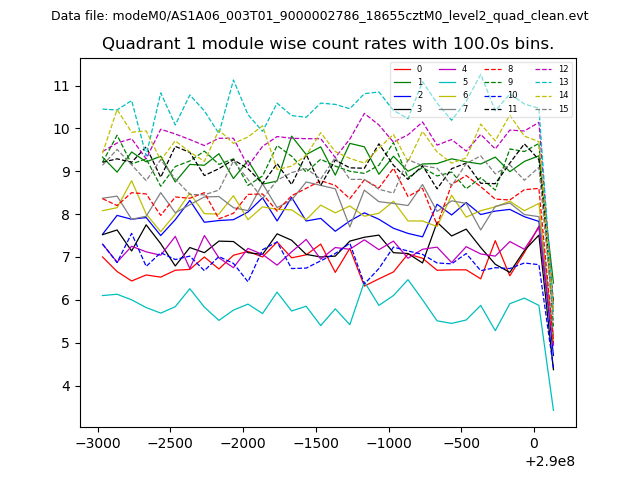
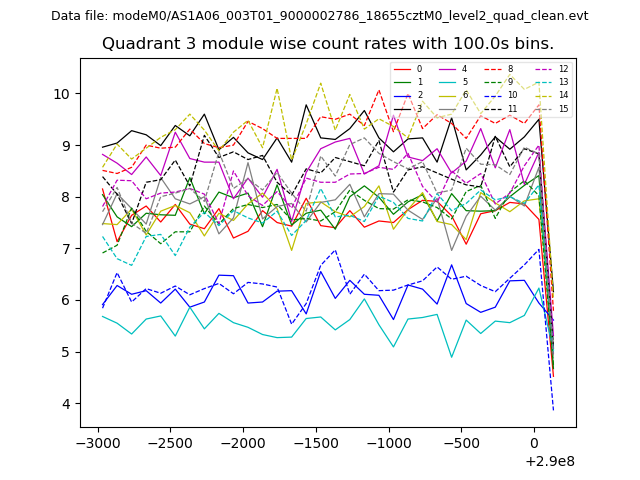
| Module-wise count rates for Quadrant A Data is divided into 100 sec bins |
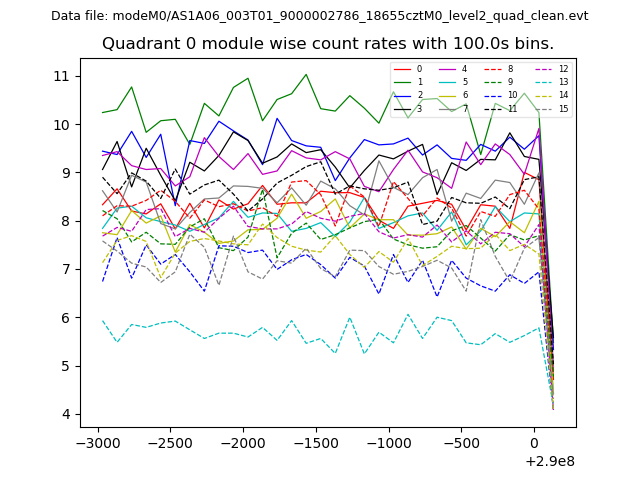 |
 |
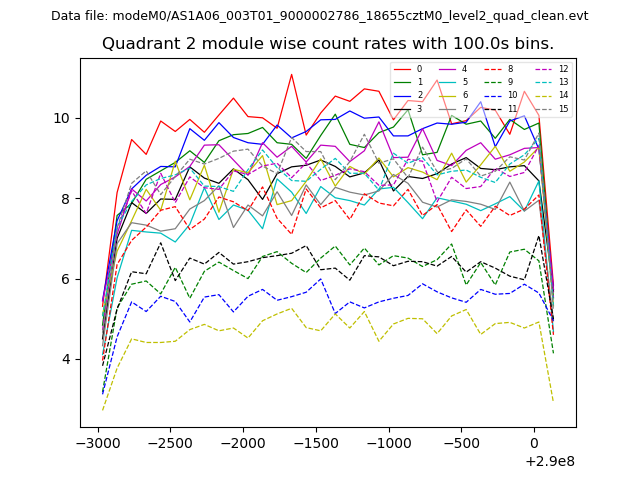
| Module-wise count rates for Quadrant B Data is divided into 100 sec bins |
 |
 |
| Module-wise count rates for Quadrant C Data is divided into 100 sec bins |
 |
 |
| Module-wise count rates for Quadrant D Data is divided into 100 sec bins |
 |
 |
| Parameter | Plot |
|---|---|
| CZT HV Monitor | 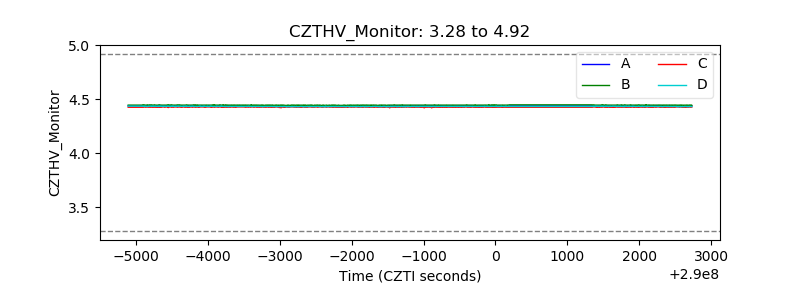 |
| D_VDD | 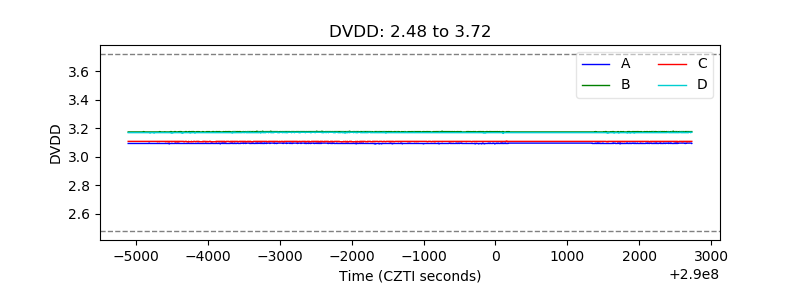 |
| Temperature 1 | 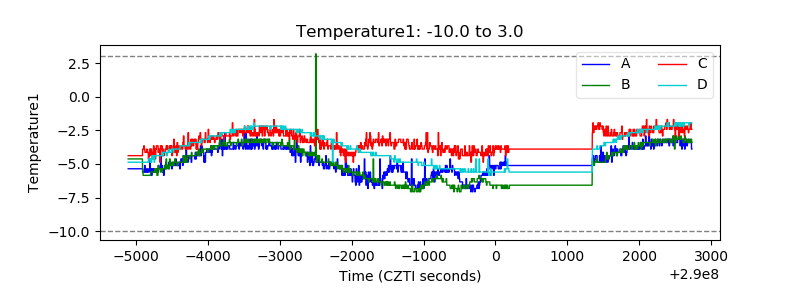 |
| Veto HV Monitor | 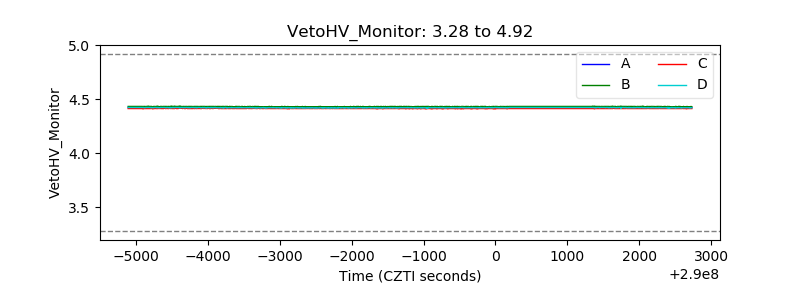 |
| Veto LLD | 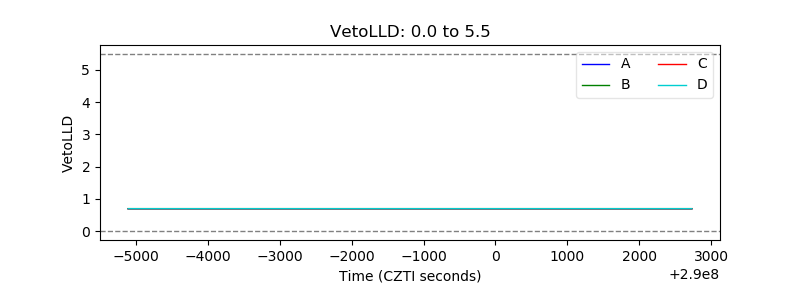 |
| Alpha Counter | 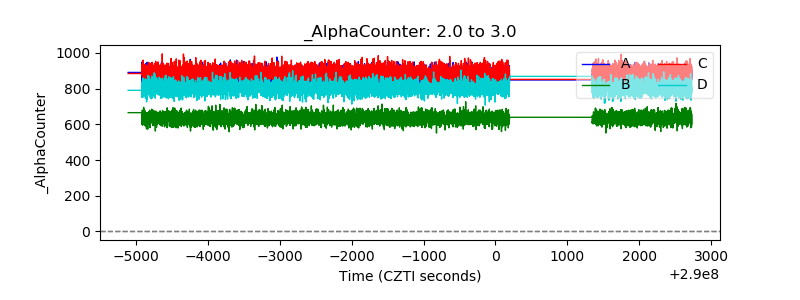 |
| _CPM_Rate | 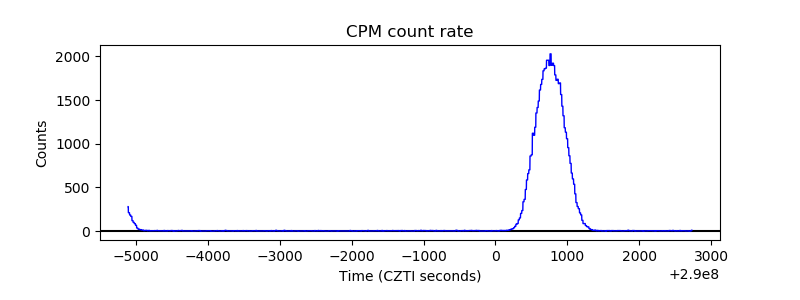 |
| CZT Counter | 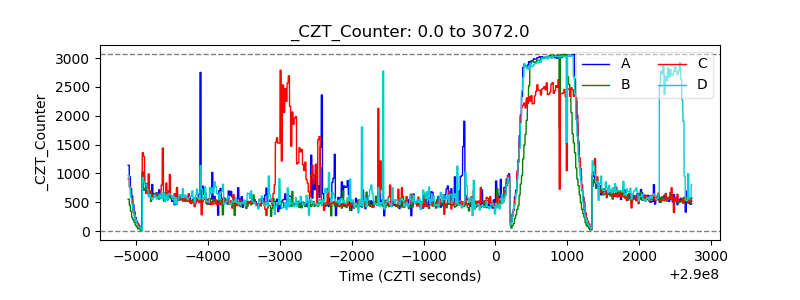 |
| +2.5 Volts monitor | 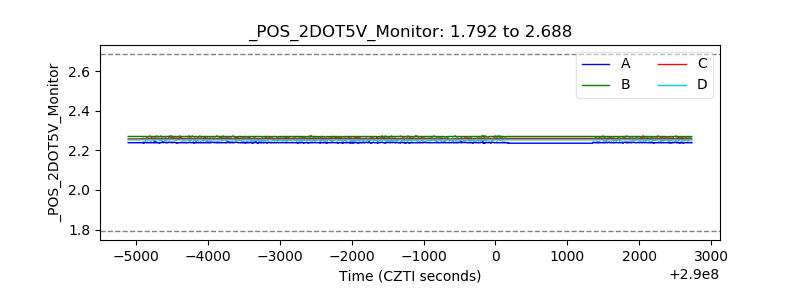 |
| +5 Volts monitor |  |
| _ROLL_ROT | 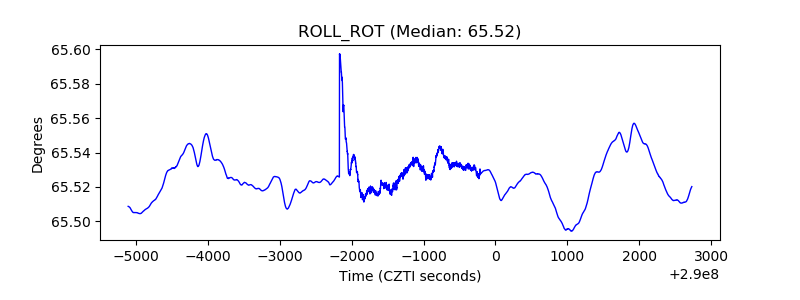 |
| _Roll_DEC | 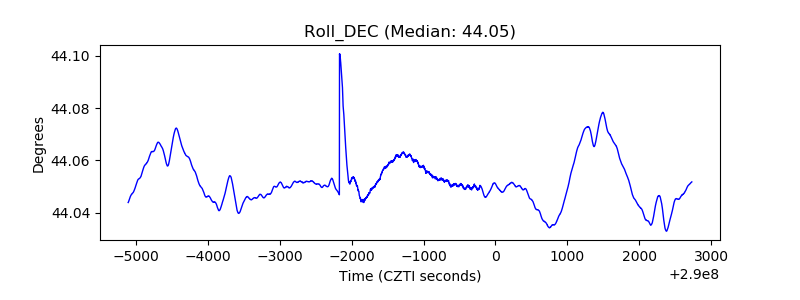 |
| _Roll_RA | 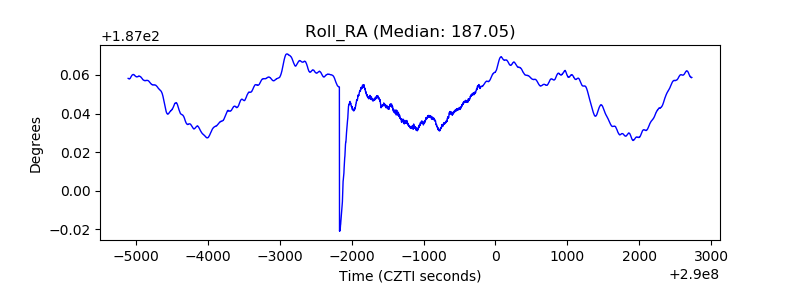 |
| Veto Counter | 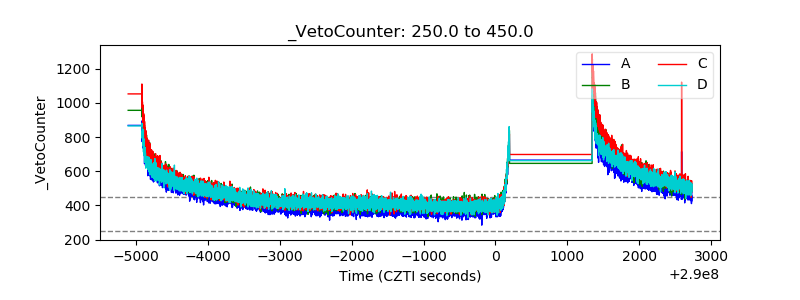 |