| Param | Original file | Final file |
|---|---|---|
| Filename | modeM0/AS1A06_003T01_9000002786_18656cztM0_level2.evt | modeM0/AS1A06_003T01_9000002786_18656cztM0_level2_quad_clean.evt |
| Size (bytes) | 713,465,280 | 80,634,240 |
| Size | 680.4 MB | 76.9 MB |
| Events in quadrant A | 3,651,089 | 534,645 |
| Events in quadrant B | 3,537,312 | 542,648 |
| Events in quadrant C | 3,920,217 | 519,514 |
| Events in quadrant D | 10,062,046 | 393,620 |
| Mode SS | |||
|---|---|---|---|
| Quadrant | BADHDUFLAG | Total packets | Discarded packets |
| A | 0 | 132 | 0 |
| B | 0 | 132 | 0 |
| C | 0 | 132 | 0 |
| D | 0 | 132 | 0 |
| Mode M0 | |||
|---|---|---|---|
| Quadrant | BADHDUFLAG | Total packets | Discarded packets |
| A | 0 | 15128 | 2 |
| B | 0 | 14709 | 3 |
| C | 0 | 15955 | 2 |
| D | 0 | 34489 | 2 |
| Mode M9 | |||
|---|---|---|---|
| Quadrant | BADHDUFLAG | Total packets | Discarded packets |
| A | 0 | 19 | 0 |
| B | 0 | 20 | 0 |
| C | 0 | 20 | 0 |
| D | 0 | 20 | 0 |
| Quadrant | Total seconds | Saturated seconds | Saturation percentage |
|---|---|---|---|
| A | 6454 | 130 | 2.014255% |
| B | 6453 | 133 | 2.061057% |
| C | 6453 | 187 | 2.897877% |
| D | 6453 | 2551 | 39.532001% |
Noise dominated data is calculated using 1-second bins in cleaned event files. If a bin has >2000 counts, and if more than 50% of those come from <1% of pixels, then it is considered to be noise-dominated and hence unusable.
| Quadrant | # 1 sec bins | Bins with >0 counts | Bins with >2000 counts | High rate bins dominated by noise | Noise dominated (total time) | Noise dominated (detector-on time) | Marked lightcurve |
|---|---|---|---|---|---|---|---|
| A | 7694 | 6454 | 12 | 12 | 0.16% | 0.19% | 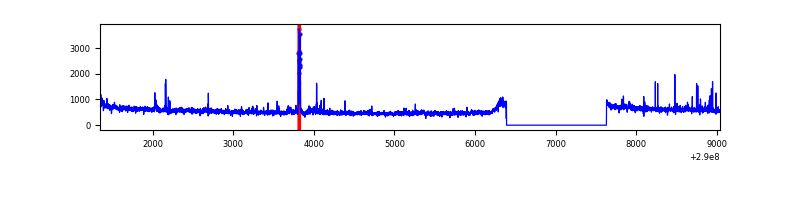 |
| B | 7693 | 6453 | 7 | 7 | 0.09% | 0.11% | 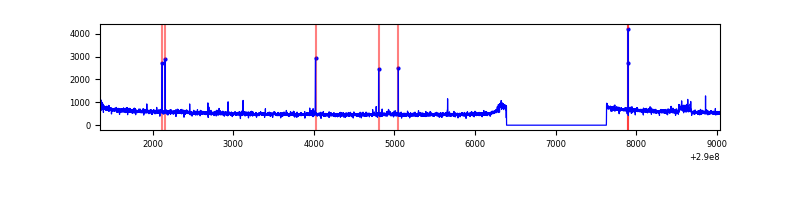 |
| C | 7693 | 6453 | 7 | 7 | 0.09% | 0.11% | 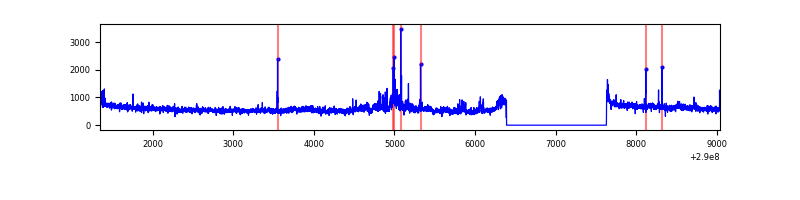 |
| D | 7692 | 6452 | 2435 | 2435 | 31.66% | 37.74% | 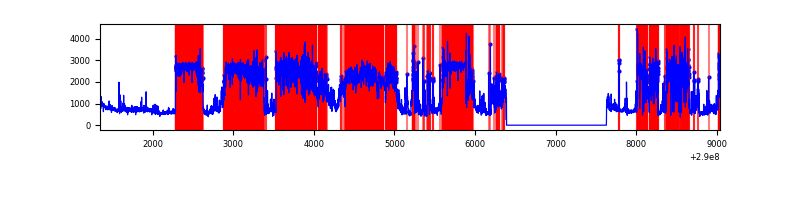 |
Top three noisy pixels from each quadrant. If the there are fewer than three noisy pixels in the level2.evt file, extra rows are filled as -1
| Pixel properties | Quadrant properties | ||||||
|---|---|---|---|---|---|---|---|
| Quadrant | DetID | PixID | Counts | Sigma | Mean | Median | Sigma |
| A | 0 | 13 | 161550 | 902.96 | 895 | 880 | 177.9 |
| A | 6 | 16 | 30563 | 166.82 | 895 | 880 | 177.9 |
| A | 13 | 254 | 9035 | 45.83 | 895 | 880 | 177.9 |
| B | 4 | 216 | 31899 | 188.61 | 885 | 865 | 164.5 |
| B | 4 | 80 | 22068 | 128.86 | 885 | 865 | 164.5 |
| B | 12 | 111 | 19310 | 112.1 | 885 | 865 | 164.5 |
| C | 3 | 233 | 287778 | 1446.55 | 859 | 869 | 198.3 |
| C | 9 | 221 | 138756 | 695.2 | 859 | 869 | 198.3 |
| C | 14 | 238 | 134603 | 674.27 | 859 | 869 | 198.3 |
| D | 7 | 238 | 6972673 | 39410.57 | 735 | 716 | 176.9 |
| D | 1 | 52 | 226399 | 1275.72 | 735 | 716 | 176.9 |
| D | 13 | 168 | 40007 | 222.1 | 735 | 716 | 176.9 |
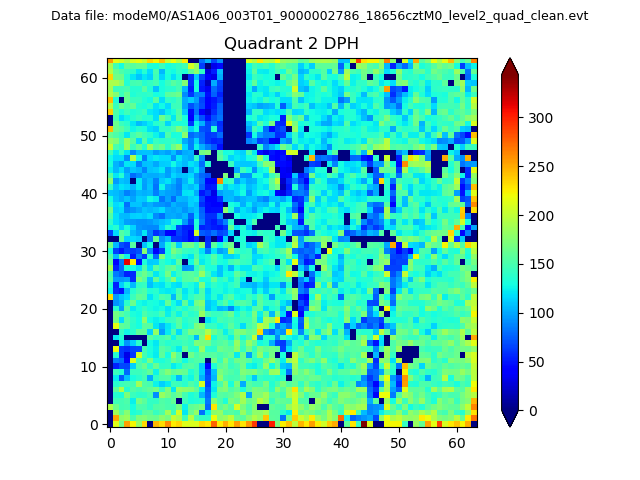
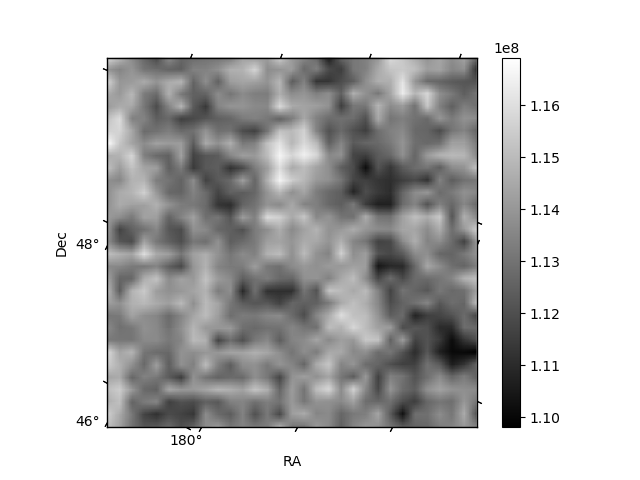
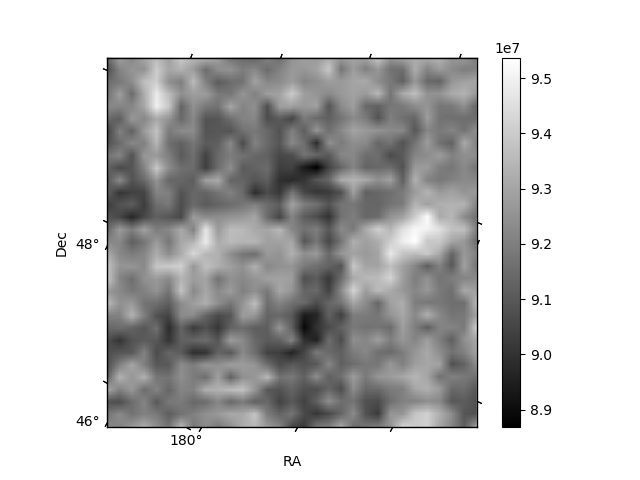
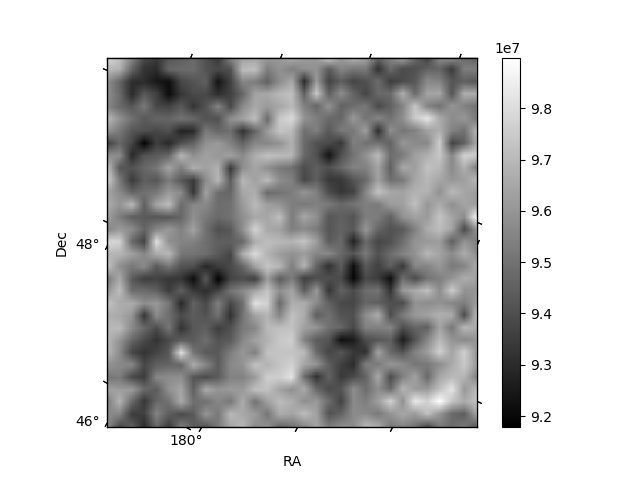
Histogram calculated using DETX and DETY for each event in the final _common_clean file
| Quadrant A | 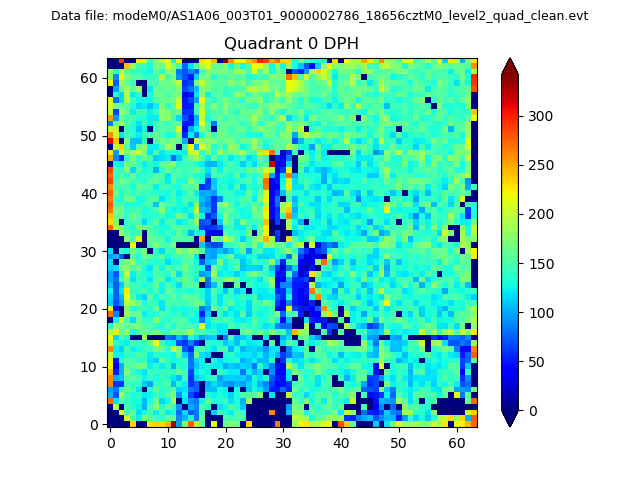 |
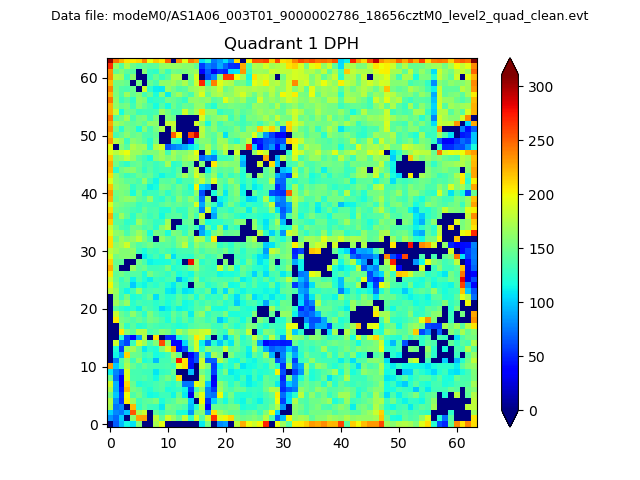 |
Quadrant B |
|---|---|---|---|
| Quadrant D | 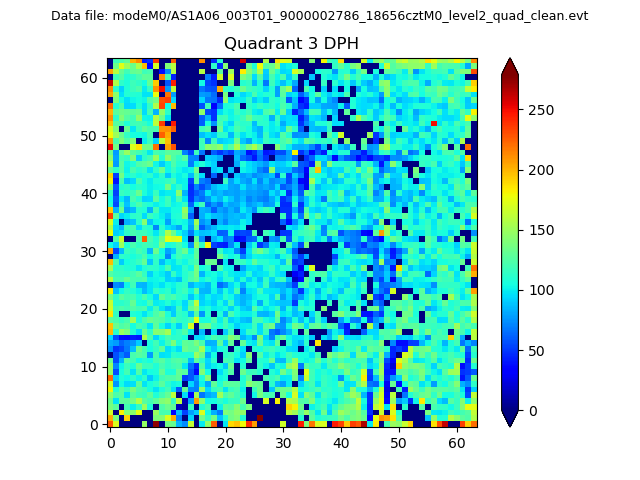 |
 |
Quadrant C |
| Plot type | Count rate plots | Images |
|---|---|---|
| Comparison with Poisson distribution Blue bars denote a histogram of data divided into 1 sec bins. Red curve is a Poisson curve with rate = median count rate of data. |
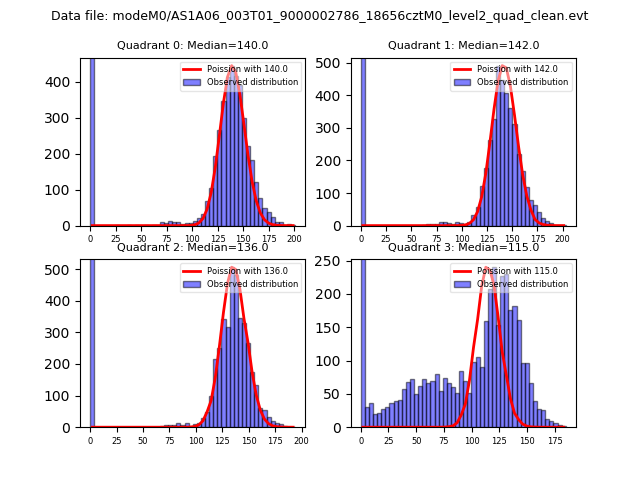 |
 |
| Quadrant-wise count rates Data is divided into 100 sec bins |
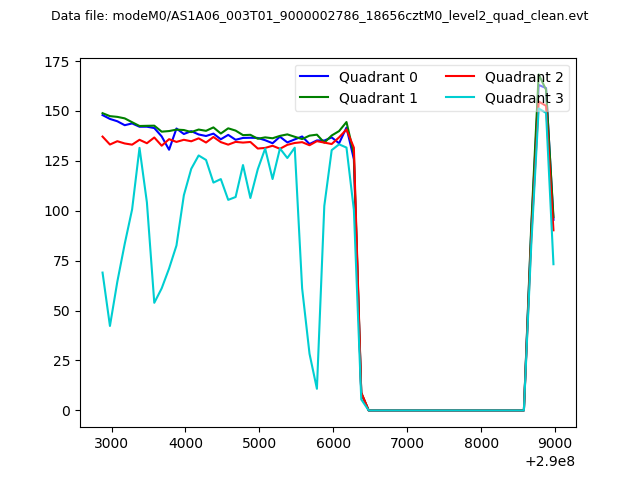 |
|
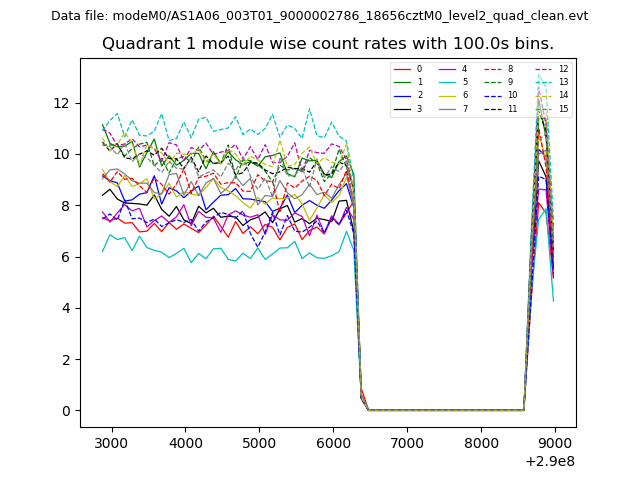
| Module-wise count rates for Quadrant A Data is divided into 100 sec bins |
 |
 |
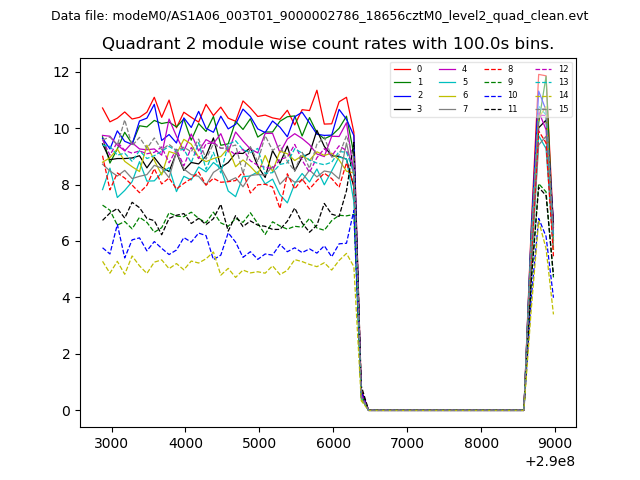
| Module-wise count rates for Quadrant B Data is divided into 100 sec bins |
 |
 |
| Module-wise count rates for Quadrant C Data is divided into 100 sec bins |
 |
 |
| Module-wise count rates for Quadrant D Data is divided into 100 sec bins |
 |
 |
| Parameter | Plot |
|---|---|
| CZT HV Monitor |  |
| D_VDD | 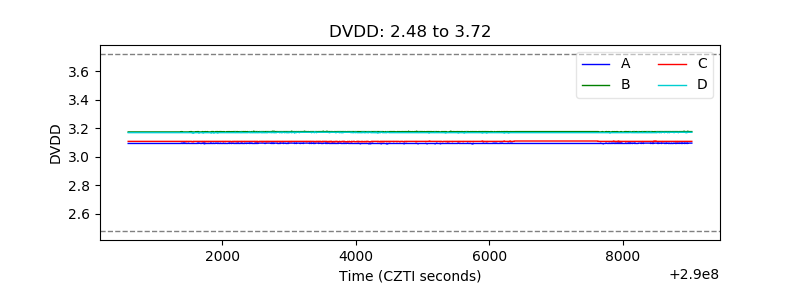 |
| Temperature 1 | 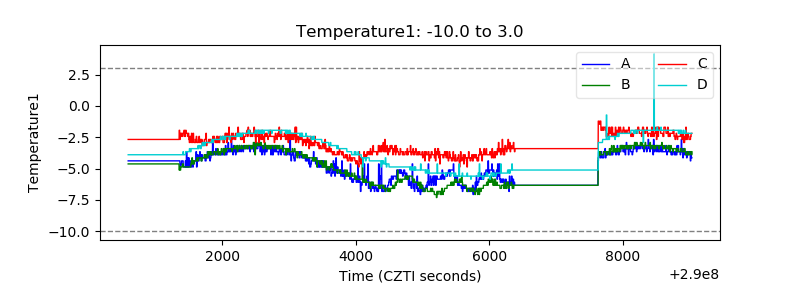 |
| Veto HV Monitor | 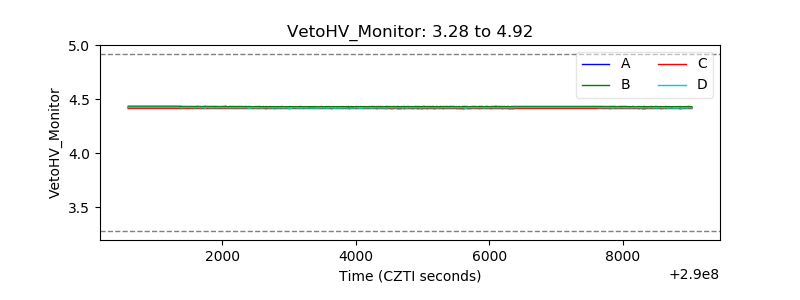 |
| Veto LLD |  |
| Alpha Counter | 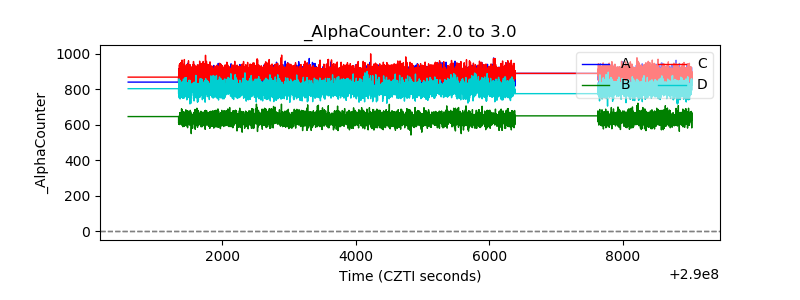 |
| _CPM_Rate | 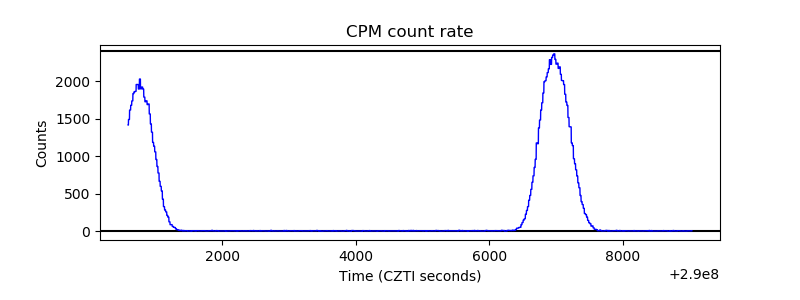 |
| CZT Counter | 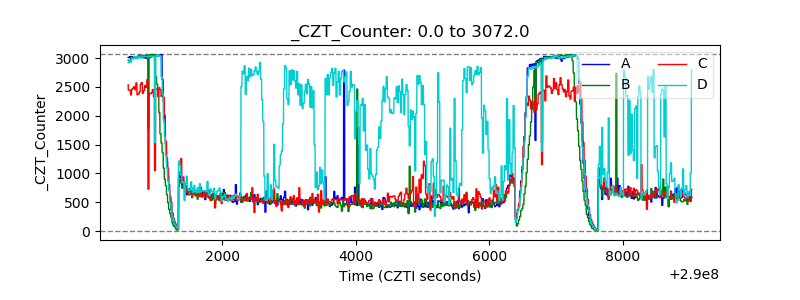 |
| +2.5 Volts monitor |  |
| +5 Volts monitor |  |
| _ROLL_ROT | 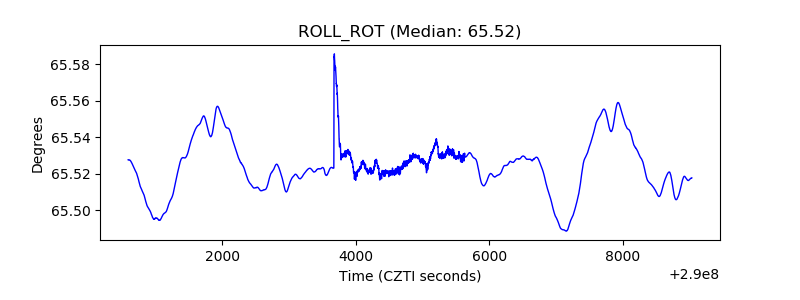 |
| _Roll_DEC | 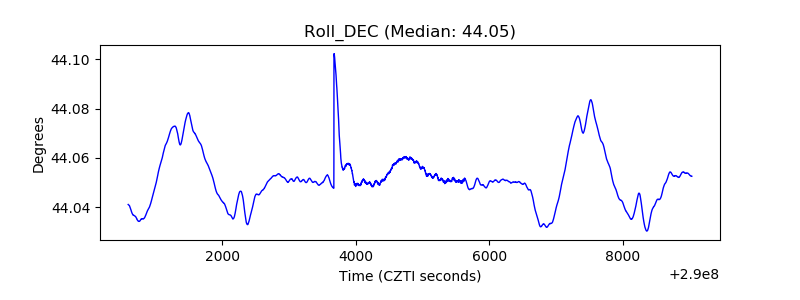 |
| _Roll_RA | 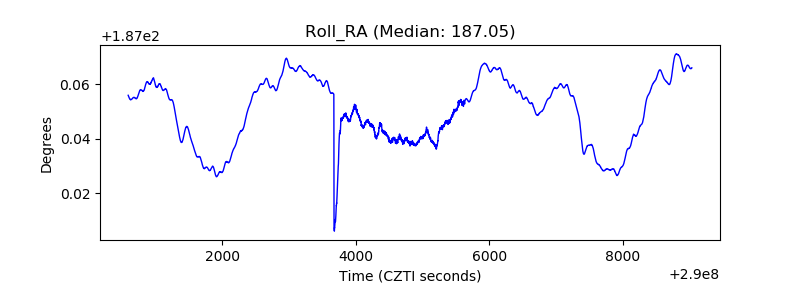 |
| Veto Counter |  |