| Param | Original file | Final file |
|---|---|---|
| Filename | modeM0/AS1A06_003T01_9000002786_18657cztM0_level2.evt | modeM0/AS1A06_003T01_9000002786_18657cztM0_level2_quad_clean.evt |
| Size (bytes) | 684,950,400 | 90,846,720 |
| Size | 653.2 MB | 86.6 MB |
| Events in quadrant A | 3,452,389 | 628,847 |
| Events in quadrant B | 3,402,985 | 638,559 |
| Events in quadrant C | 3,747,497 | 618,836 |
| Events in quadrant D | 9,728,462 | 438,126 |
| Mode SS | |||
|---|---|---|---|
| Quadrant | BADHDUFLAG | Total packets | Discarded packets |
| A | 0 | 122 | 0 |
| B | 0 | 122 | 0 |
| C | 0 | 122 | 0 |
| D | 0 | 122 | 0 |
| Mode M0 | |||
|---|---|---|---|
| Quadrant | BADHDUFLAG | Total packets | Discarded packets |
| A | 0 | 14345 | 2 |
| B | 0 | 14174 | 2 |
| C | 0 | 15168 | 2 |
| D | 0 | 33239 | 2 |
| Mode M9 | |||
|---|---|---|---|
| Quadrant | BADHDUFLAG | Total packets | Discarded packets |
| A | 0 | 22 | 0 |
| B | 0 | 23 | 0 |
| C | 0 | 23 | 0 |
| D | 0 | 23 | 0 |
| Quadrant | Total seconds | Saturated seconds | Saturation percentage |
|---|---|---|---|
| A | 6106 | 94 | 1.539469% |
| B | 6106 | 108 | 1.768752% |
| C | 6106 | 173 | 2.833279% |
| D | 6106 | 2555 | 41.844088% |
Noise dominated data is calculated using 1-second bins in cleaned event files. If a bin has >2000 counts, and if more than 50% of those come from <1% of pixels, then it is considered to be noise-dominated and hence unusable.
| Quadrant | # 1 sec bins | Bins with >0 counts | Bins with >2000 counts | High rate bins dominated by noise | Noise dominated (total time) | Noise dominated (detector-on time) | Marked lightcurve |
|---|---|---|---|---|---|---|---|
| A | 7441 | 6106 | 1 | 1 | 0.01% | 0.02% | 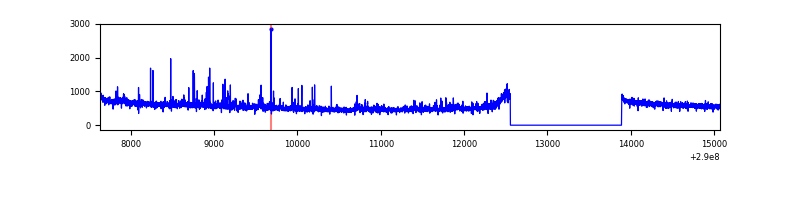 |
| B | 7441 | 6106 | 2 | 2 | 0.03% | 0.03% | 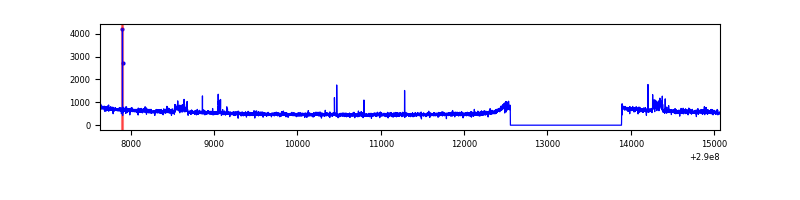 |
| C | 7441 | 6106 | 2 | 2 | 0.03% | 0.03% | 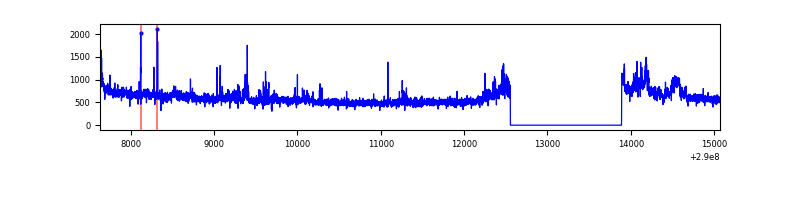 |
| D | 7441 | 6106 | 2338 | 2338 | 31.42% | 38.29% | 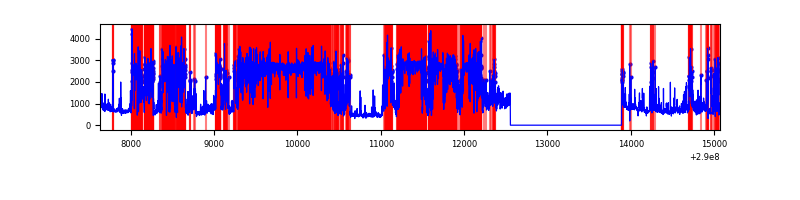 |
Top three noisy pixels from each quadrant. If the there are fewer than three noisy pixels in the level2.evt file, extra rows are filled as -1
| Pixel properties | Quadrant properties | ||||||
|---|---|---|---|---|---|---|---|
| Quadrant | DetID | PixID | Counts | Sigma | Mean | Median | Sigma |
| A | 0 | 13 | 84249 | 489.68 | 854 | 838 | 170.3 |
| A | 6 | 16 | 63016 | 365.03 | 854 | 838 | 170.3 |
| A | 15 | 192 | 16158 | 89.94 | 854 | 838 | 170.3 |
| B | 4 | 216 | 61854 | 387.8 | 846 | 828 | 157.4 |
| B | 3 | 64 | 22116 | 135.28 | 846 | 828 | 157.4 |
| B | 12 | 111 | 18136 | 109.99 | 846 | 828 | 157.4 |
| C | 3 | 233 | 285863 | 1489.87 | 829 | 837 | 191.3 |
| C | 14 | 238 | 128342 | 666.49 | 829 | 837 | 191.3 |
| C | 9 | 221 | 101164 | 524.42 | 829 | 837 | 191.3 |
| D | 7 | 238 | 6455722 | 38655.17 | 693 | 674 | 167.0 |
| D | 13 | 168 | 481036 | 2876.58 | 693 | 674 | 167.0 |
| D | 1 | 52 | 145230 | 865.65 | 693 | 674 | 167.0 |
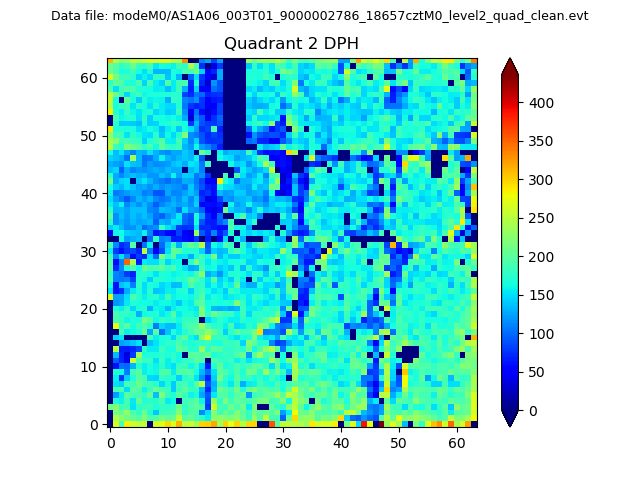
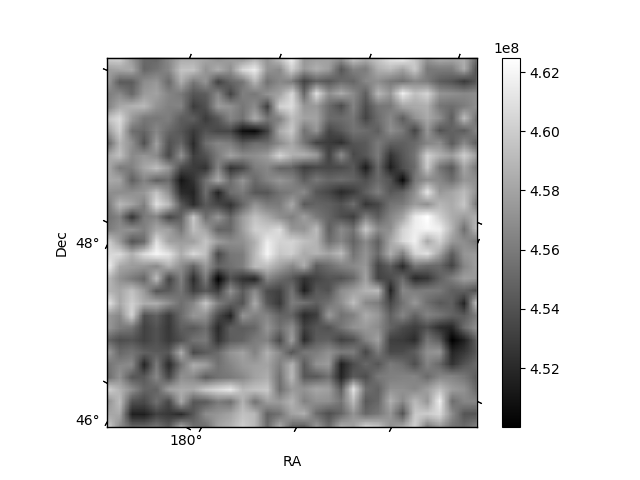
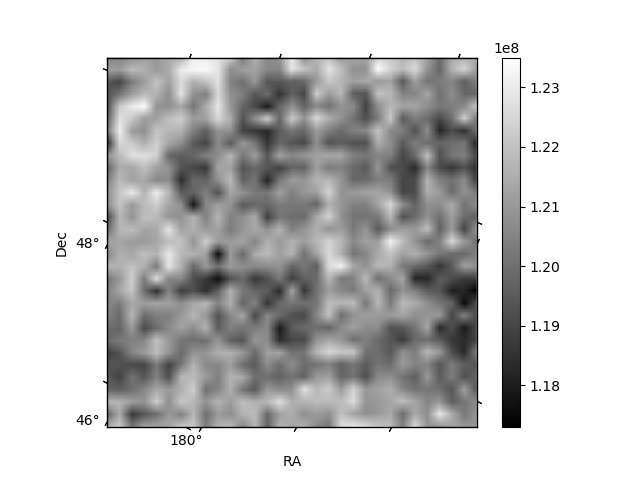
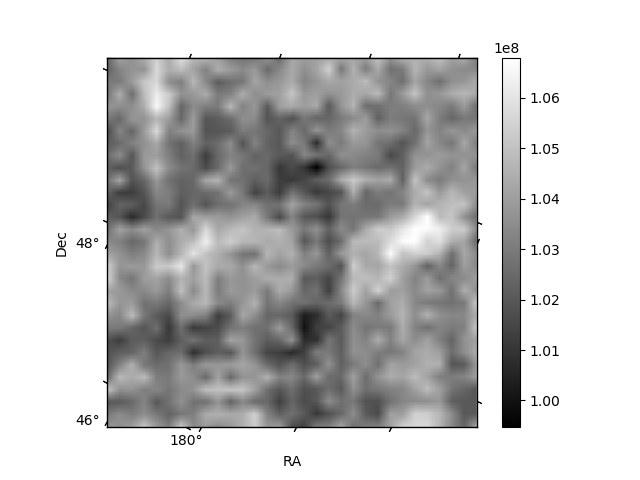
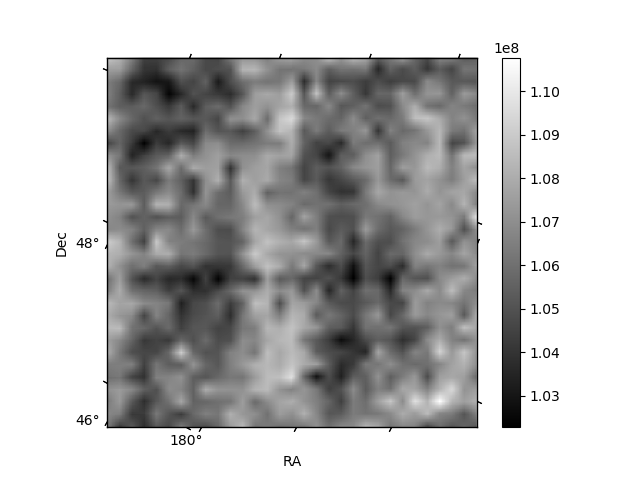
Histogram calculated using DETX and DETY for each event in the final _common_clean file
| Quadrant A | 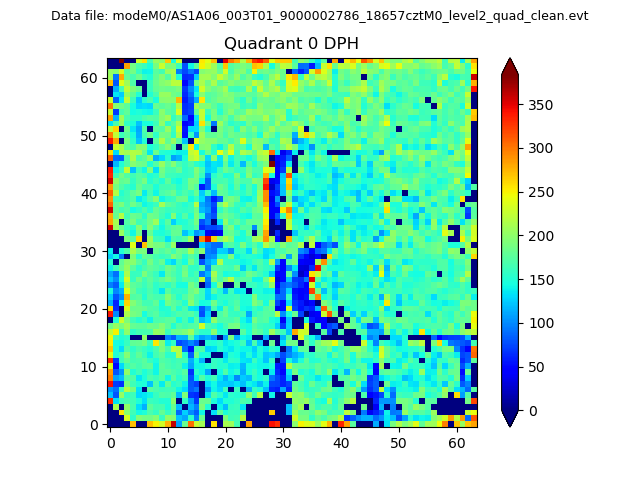 |
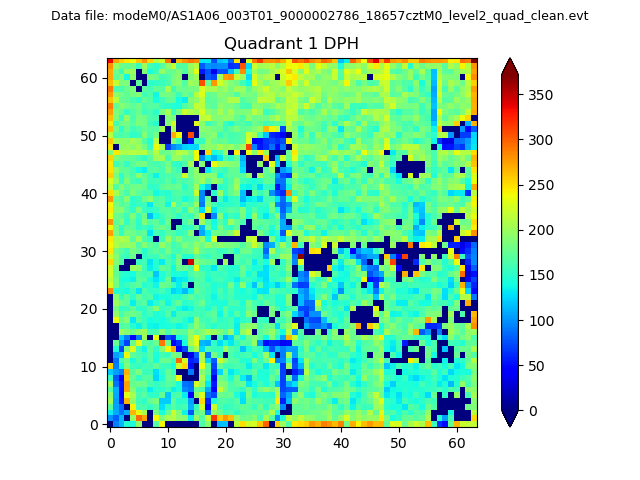 |
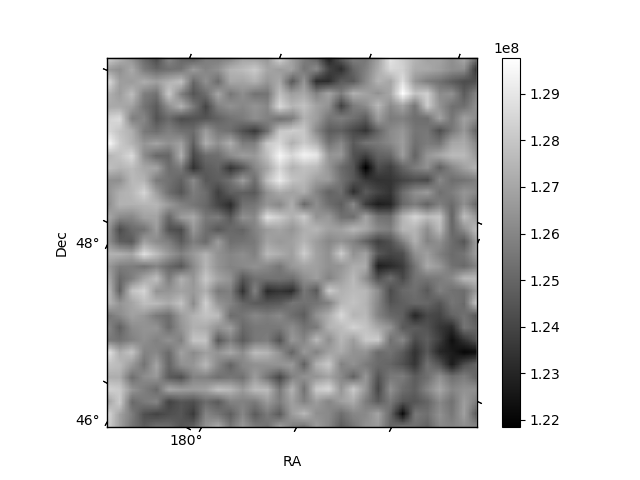
Quadrant B |
|---|---|---|---|
| Quadrant D | 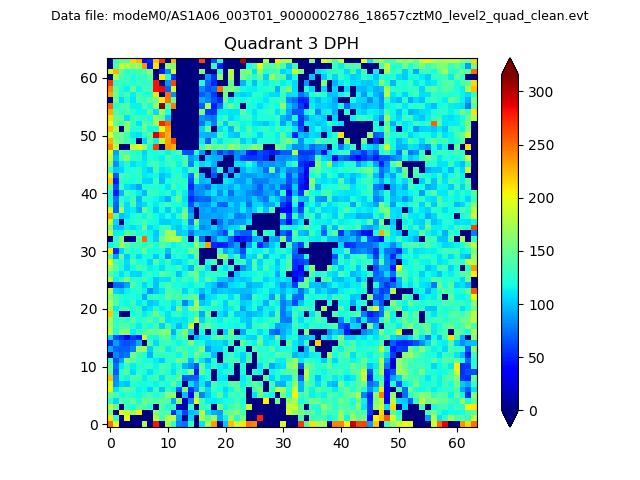 |
 |
Quadrant C |
| Plot type | Count rate plots | Images |
|---|---|---|
| Comparison with Poisson distribution Blue bars denote a histogram of data divided into 1 sec bins. Red curve is a Poisson curve with rate = median count rate of data. |
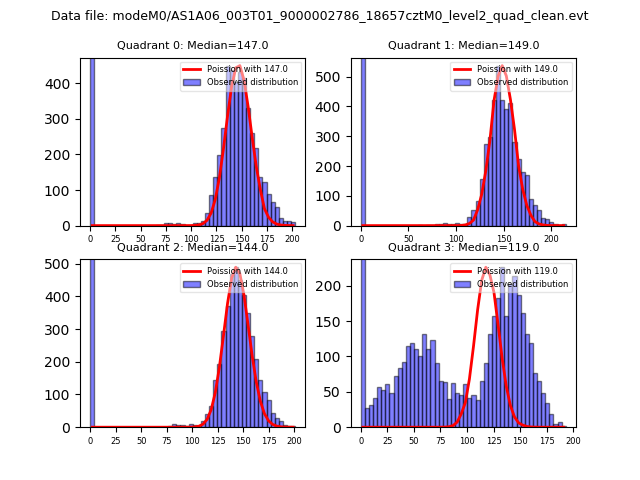 |
 |
| Quadrant-wise count rates Data is divided into 100 sec bins |
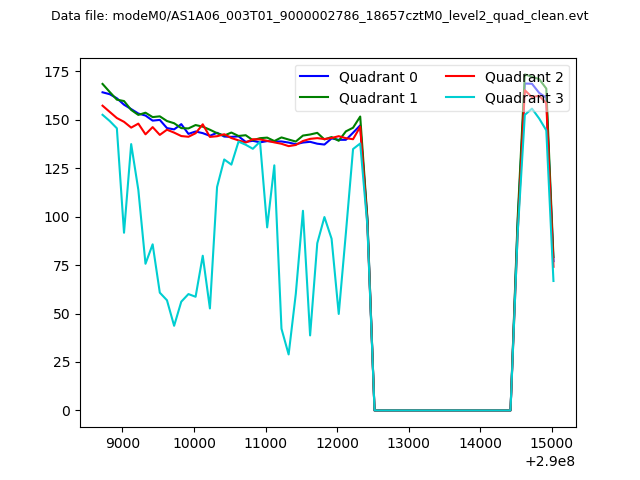 |
|
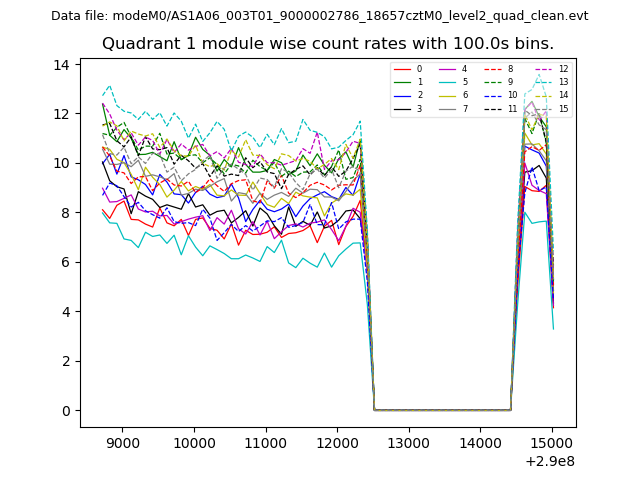
| Module-wise count rates for Quadrant A Data is divided into 100 sec bins |
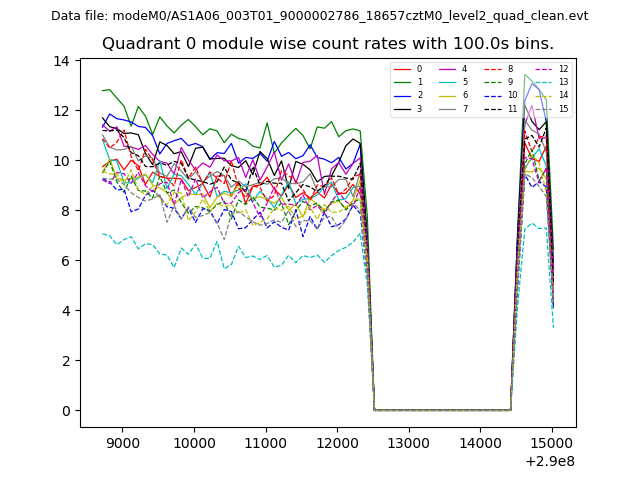 |
 |
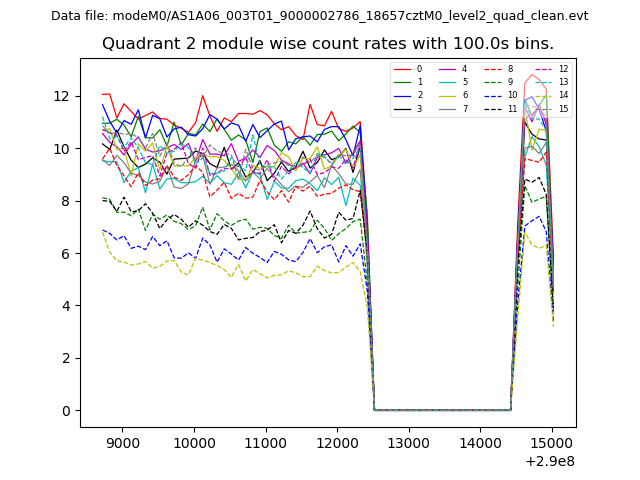
| Module-wise count rates for Quadrant B Data is divided into 100 sec bins |
 |
 |
| Module-wise count rates for Quadrant C Data is divided into 100 sec bins |
 |
 |
| Module-wise count rates for Quadrant D Data is divided into 100 sec bins |
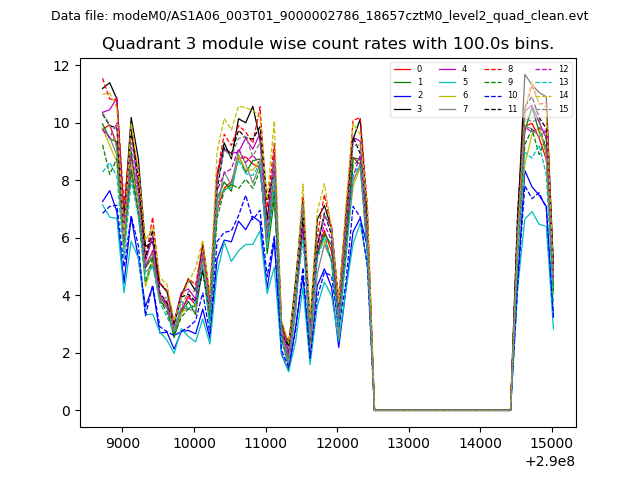 |
 |
| Parameter | Plot |
|---|---|
| CZT HV Monitor | 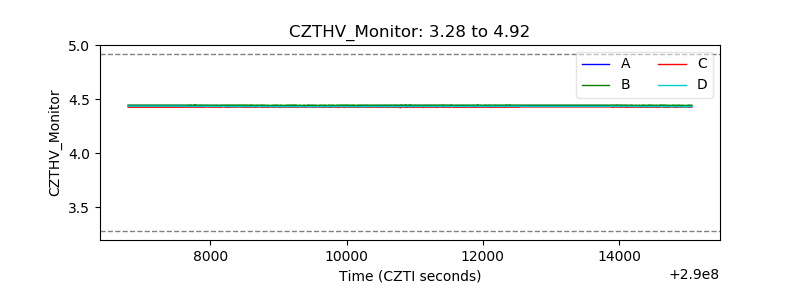 |
| D_VDD | 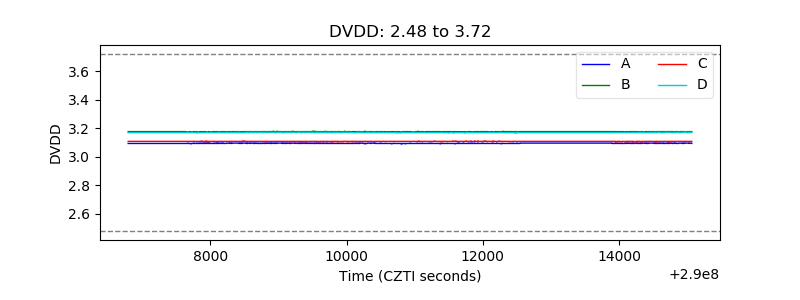 |
| Temperature 1 | 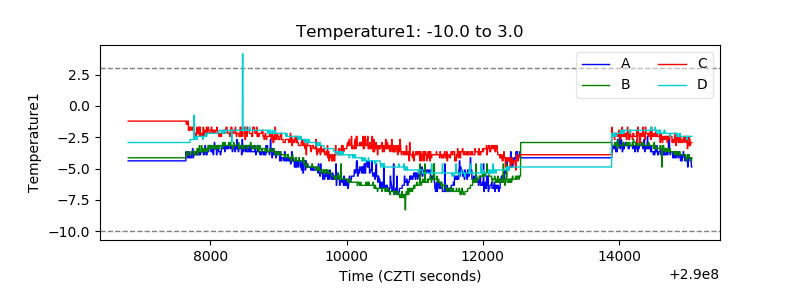 |
| Veto HV Monitor | 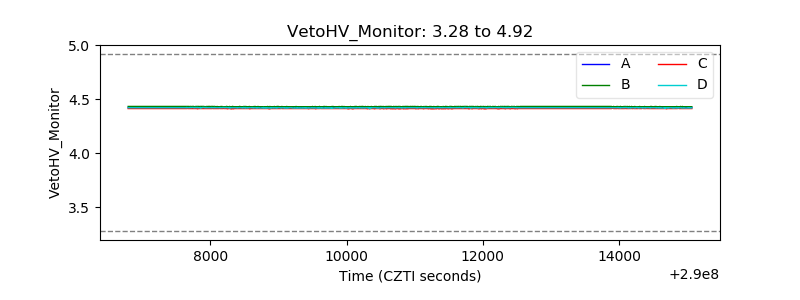 |
| Veto LLD | 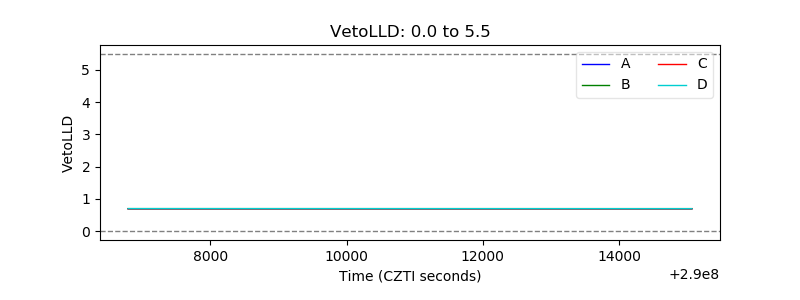 |
| Alpha Counter | 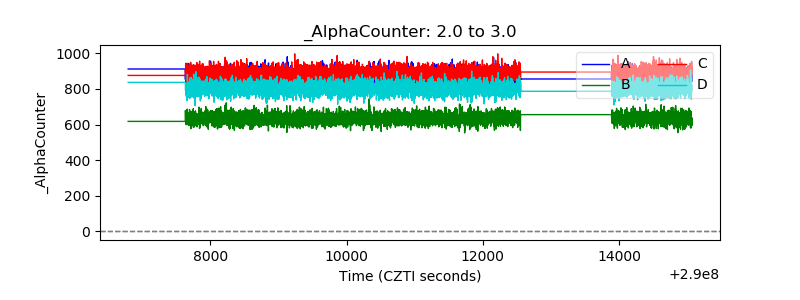 |
| _CPM_Rate | 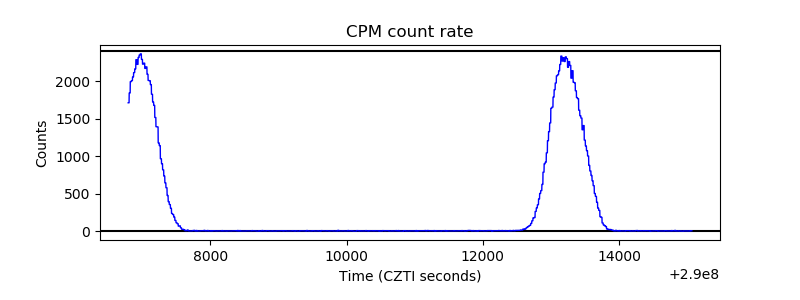 |
| CZT Counter |  |
| +2.5 Volts monitor |  |
| +5 Volts monitor |  |
| _ROLL_ROT | 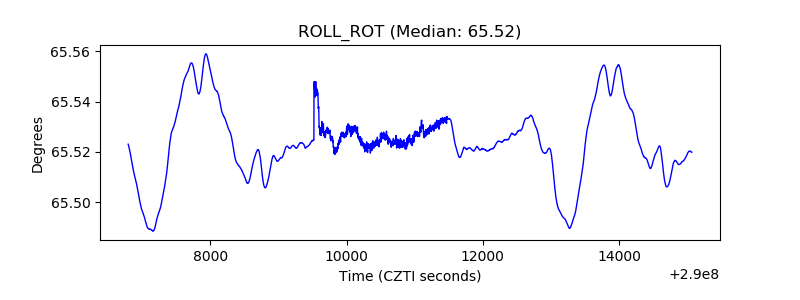 |
| _Roll_DEC |  |
| _Roll_RA | 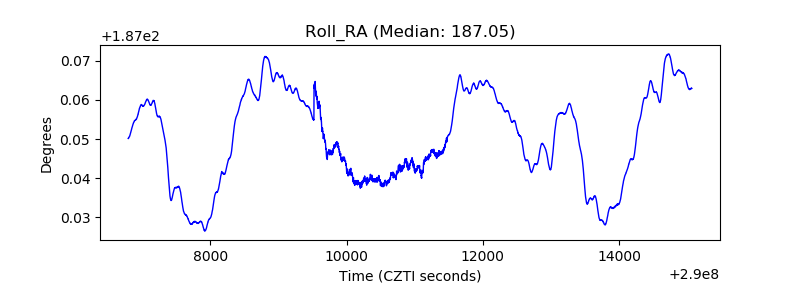 |
| Veto Counter |  |