| Param | Original file | Final file |
|---|---|---|
| Filename | modeM0/AS1A06_003T01_9000002786_18658cztM0_level2.evt | modeM0/AS1A06_003T01_9000002786_18658cztM0_level2_quad_clean.evt |
| Size (bytes) | 594,564,480 | 106,925,760 |
| Size | 567.0 MB | 102.0 MB |
| Events in quadrant A | 3,341,012 | 719,504 |
| Events in quadrant B | 3,393,735 | 735,717 |
| Events in quadrant C | 3,624,147 | 715,444 |
| Events in quadrant D | 7,224,300 | 630,956 |
| Mode SS | |||
|---|---|---|---|
| Quadrant | BADHDUFLAG | Total packets | Discarded packets |
| A | 0 | 126 | 0 |
| B | 0 | 126 | 0 |
| C | 0 | 126 | 0 |
| D | 0 | 126 | 0 |
| Mode M0 | |||
|---|---|---|---|
| Quadrant | BADHDUFLAG | Total packets | Discarded packets |
| A | 0 | 14001 | 2 |
| B | 0 | 14091 | 2 |
| C | 0 | 14635 | 2 |
| D | 0 | 25913 | 2 |
| Mode M9 | |||
|---|---|---|---|
| Quadrant | BADHDUFLAG | Total packets | Discarded packets |
| A | 0 | 15 | 0 |
| B | 0 | 16 | 0 |
| C | 0 | 16 | 0 |
| D | 0 | 16 | 0 |
| Quadrant | Total seconds | Saturated seconds | Saturation percentage |
|---|---|---|---|
| A | 6257 | 82 | 1.310532% |
| B | 6256 | 103 | 1.646419% |
| C | 6256 | 161 | 2.573529% |
| D | 6256 | 1099 | 17.567136% |
Noise dominated data is calculated using 1-second bins in cleaned event files. If a bin has >2000 counts, and if more than 50% of those come from <1% of pixels, then it is considered to be noise-dominated and hence unusable.
| Quadrant | # 1 sec bins | Bins with >0 counts | Bins with >2000 counts | High rate bins dominated by noise | Noise dominated (total time) | Noise dominated (detector-on time) | Marked lightcurve |
|---|---|---|---|---|---|---|---|
| A | 7607 | 6258 | 2 | 2 | 0.03% | 0.03% | 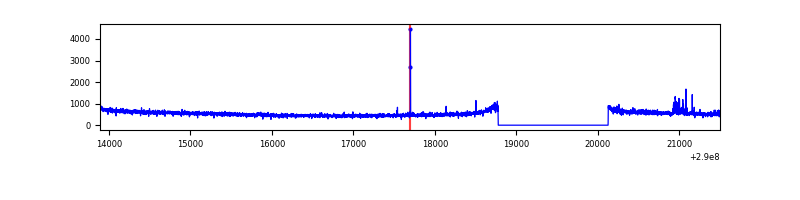 |
| B | 7606 | 6257 | 2 | 2 | 0.03% | 0.03% | 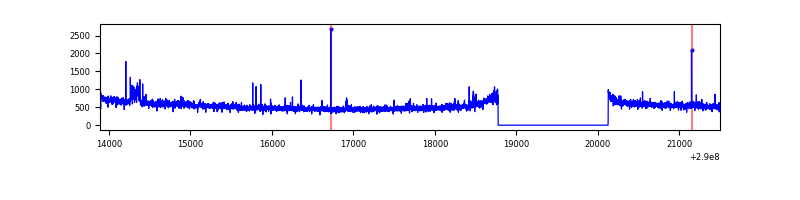 |
| C | 7606 | 6257 | 6 | 6 | 0.08% | 0.10% | 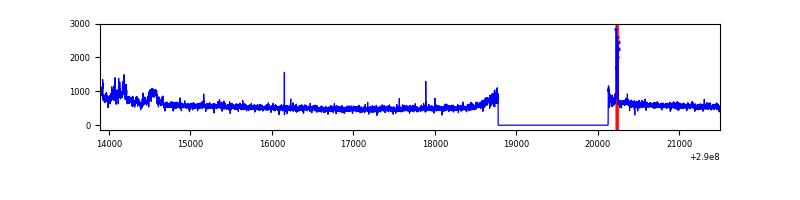 |
| D | 7606 | 6257 | 969 | 969 | 12.74% | 15.49% | 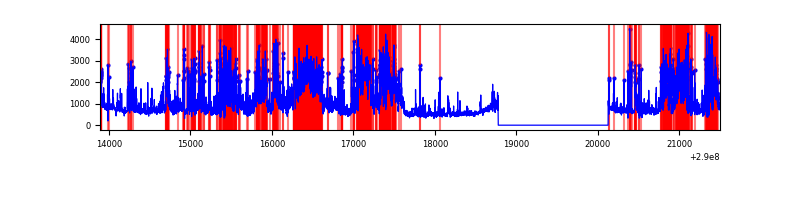 |
Top three noisy pixels from each quadrant. If the there are fewer than three noisy pixels in the level2.evt file, extra rows are filled as -1
| Pixel properties | Quadrant properties | ||||||
|---|---|---|---|---|---|---|---|
| Quadrant | DetID | PixID | Counts | Sigma | Mean | Median | Sigma |
| A | 15 | 192 | 36741 | 211.58 | 851 | 837 | 169.7 |
| A | 6 | 16 | 20660 | 116.81 | 851 | 837 | 169.7 |
| A | 13 | 254 | 9150 | 48.99 | 851 | 837 | 169.7 |
| B | 4 | 216 | 39574 | 245.85 | 850 | 830 | 157.6 |
| B | 12 | 111 | 18532 | 112.33 | 850 | 830 | 157.6 |
| B | 11 | 111 | 16063 | 96.66 | 850 | 830 | 157.6 |
| C | 3 | 233 | 192240 | 992.69 | 835 | 841 | 192.8 |
| C | 14 | 238 | 129703 | 668.34 | 835 | 841 | 192.8 |
| C | 9 | 221 | 46443 | 236.52 | 835 | 841 | 192.8 |
| D | 7 | 238 | 2712432 | 14212.96 | 799 | 777 | 190.8 |
| D | 1 | 52 | 927195 | 4855.76 | 799 | 777 | 190.8 |
| D | 13 | 168 | 545549 | 2855.39 | 799 | 777 | 190.8 |
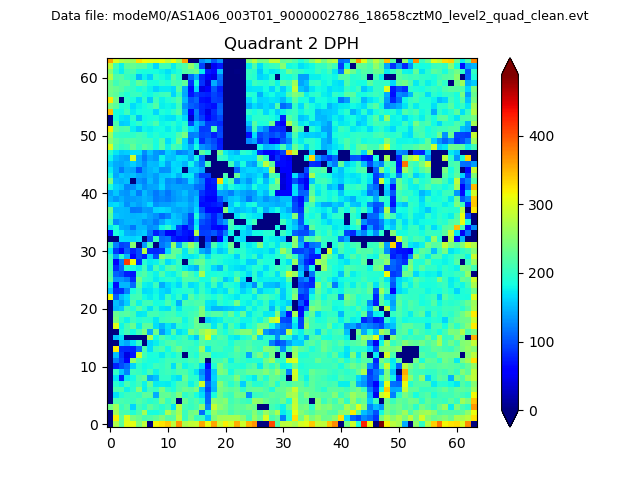
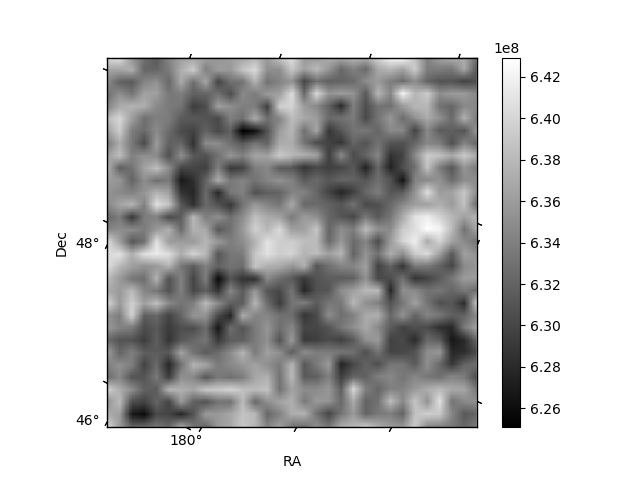
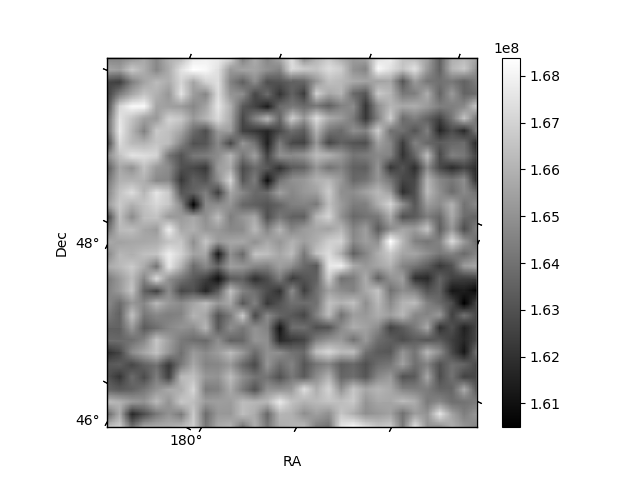
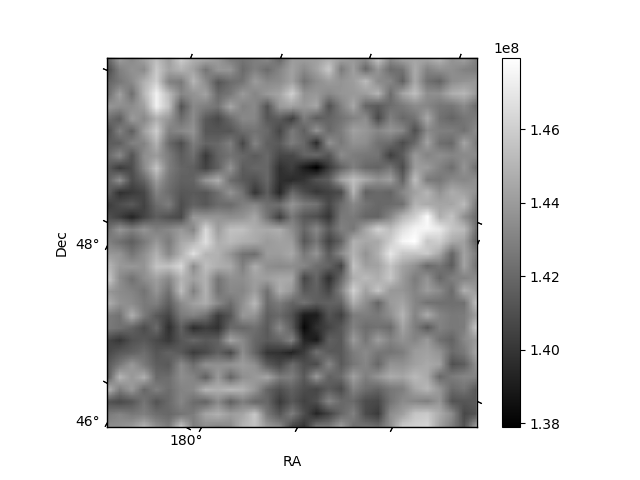
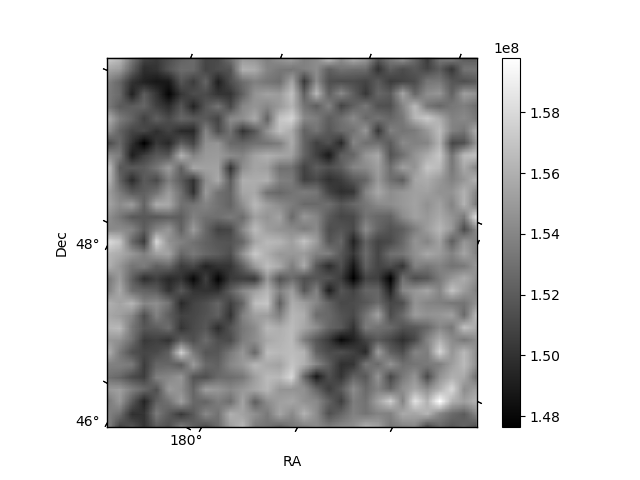
Histogram calculated using DETX and DETY for each event in the final _common_clean file
| Quadrant A | 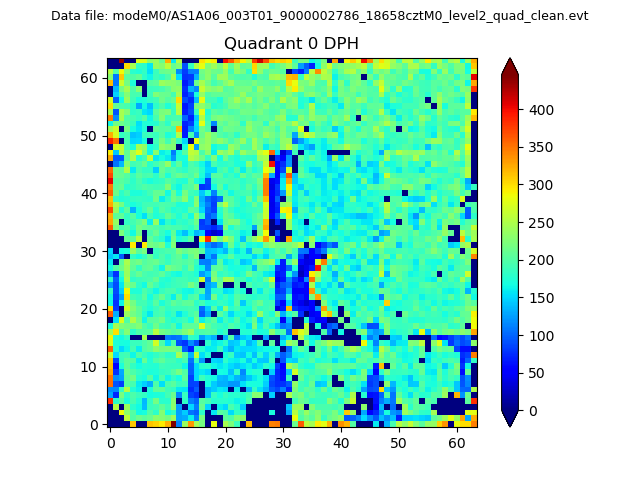 |
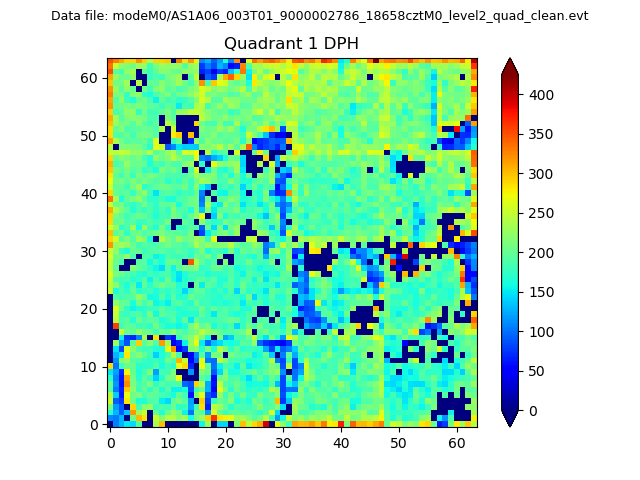 |
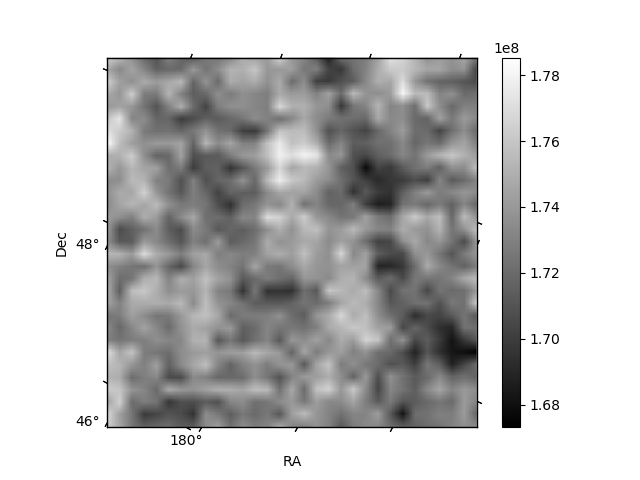
Quadrant B |
|---|---|---|---|
| Quadrant D | 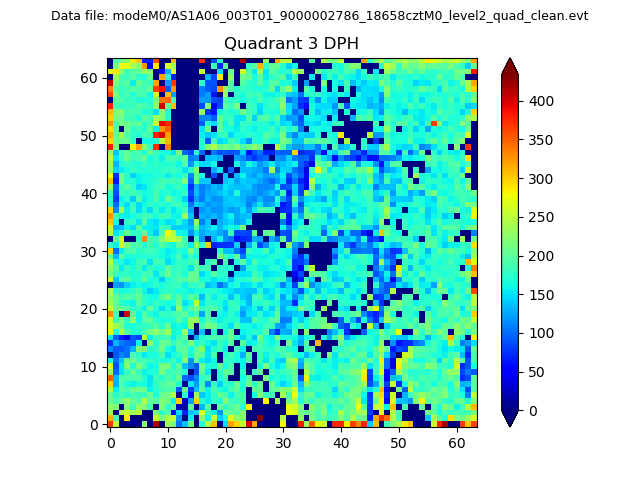 |
 |
Quadrant C |
| Plot type | Count rate plots | Images |
|---|---|---|
| Comparison with Poisson distribution Blue bars denote a histogram of data divided into 1 sec bins. Red curve is a Poisson curve with rate = median count rate of data. |
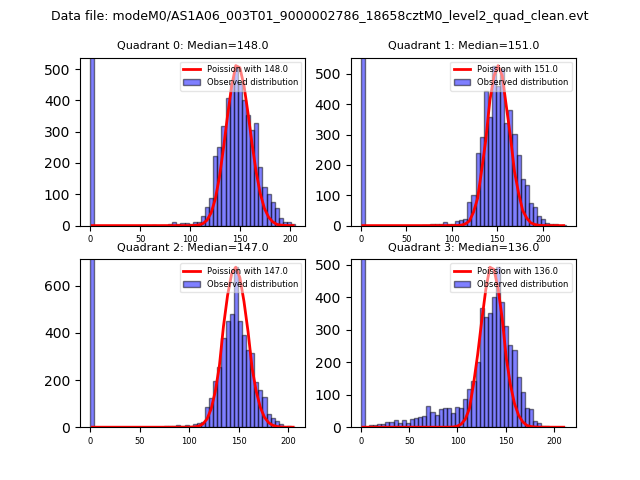 |
 |
| Quadrant-wise count rates Data is divided into 100 sec bins |
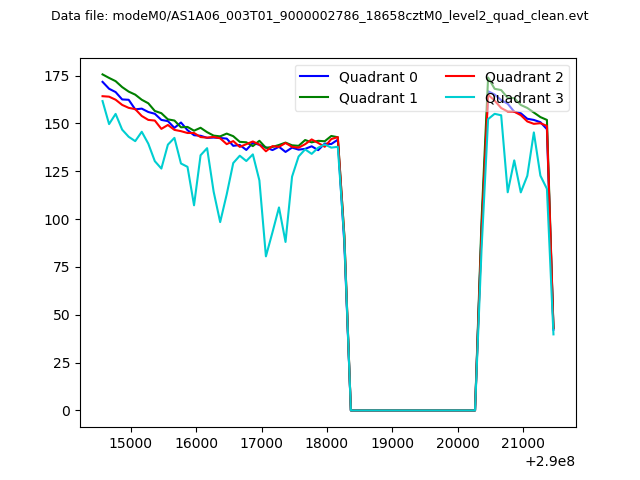 |
|
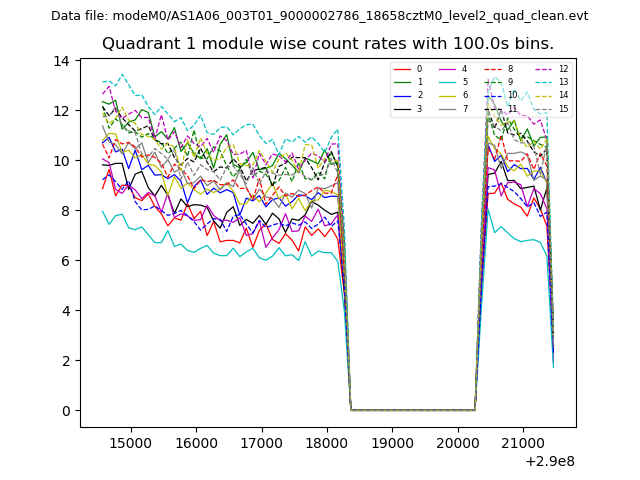
| Module-wise count rates for Quadrant A Data is divided into 100 sec bins |
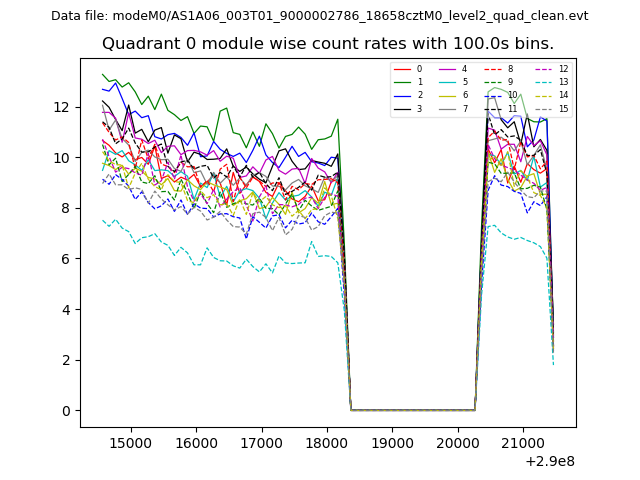 |
 |
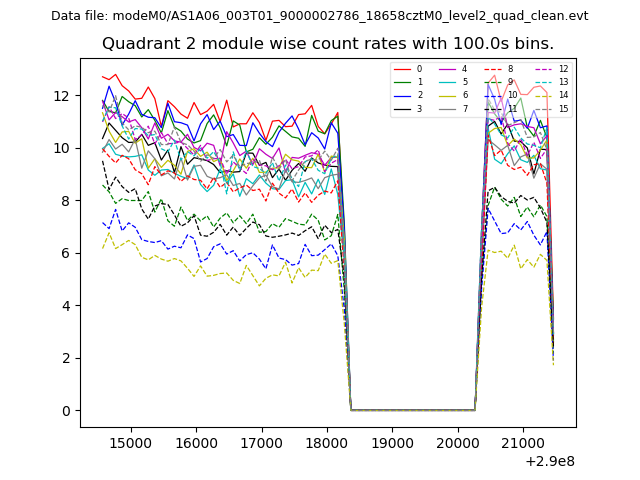
| Module-wise count rates for Quadrant B Data is divided into 100 sec bins |
 |
 |
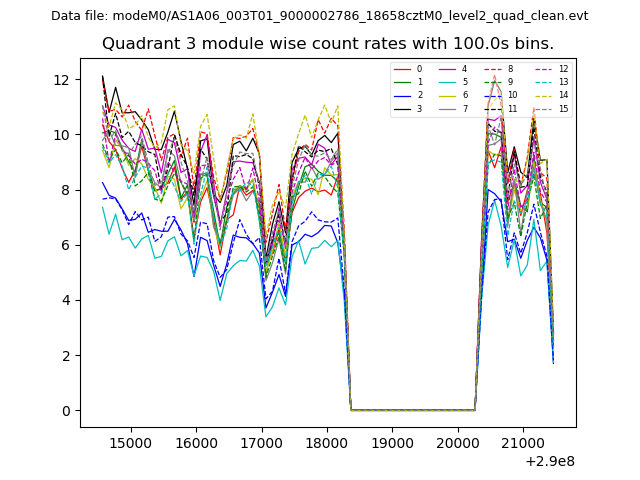
| Module-wise count rates for Quadrant C Data is divided into 100 sec bins |
 |
 |
| Module-wise count rates for Quadrant D Data is divided into 100 sec bins |
 |
 |
| Parameter | Plot |
|---|---|
| CZT HV Monitor | 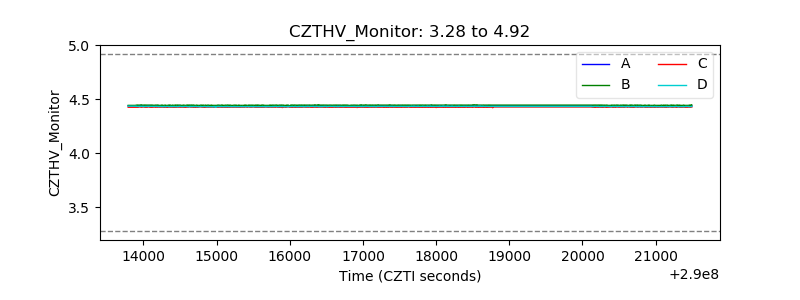 |
| D_VDD | 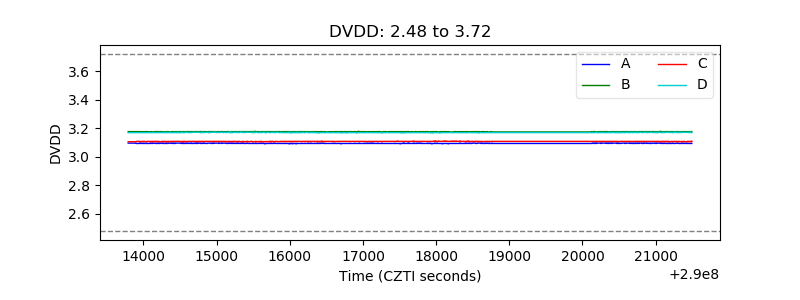 |
| Temperature 1 | 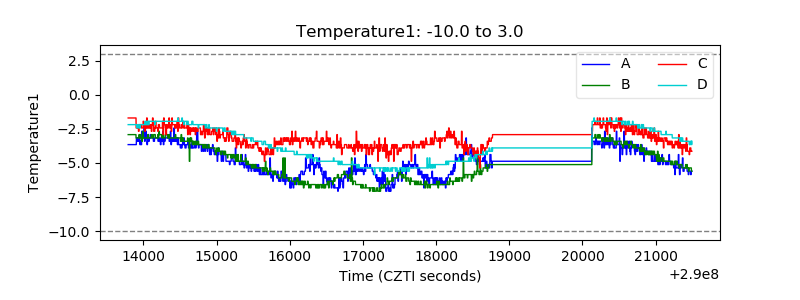 |
| Veto HV Monitor | 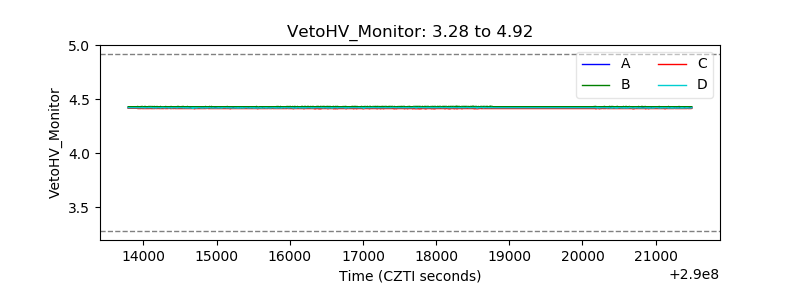 |
| Veto LLD | 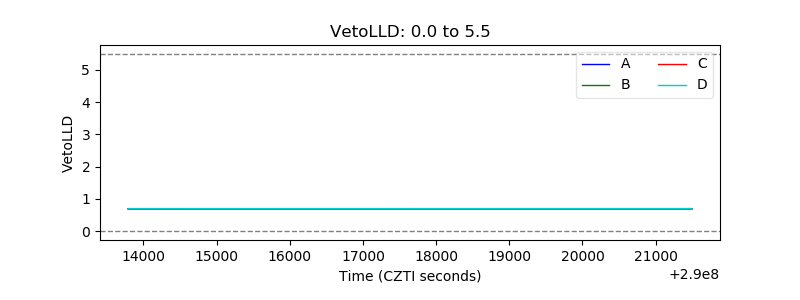 |
| Alpha Counter | 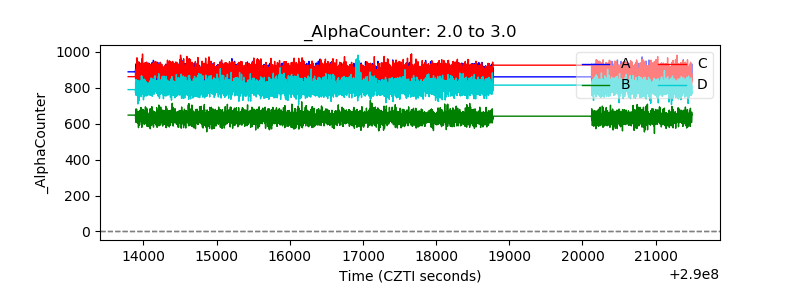 |
| _CPM_Rate | 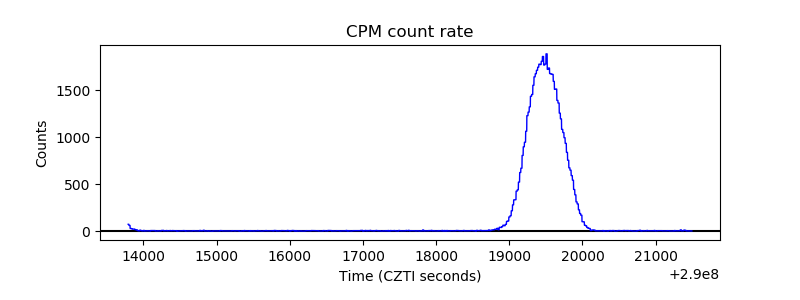 |
| CZT Counter | 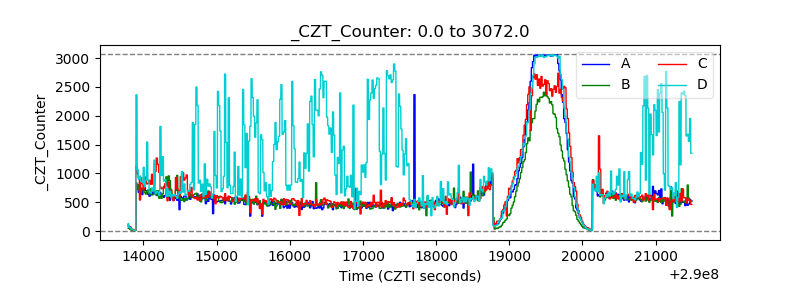 |
| +2.5 Volts monitor | 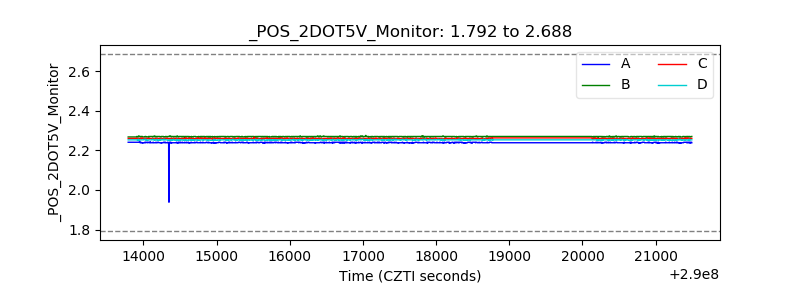 |
| +5 Volts monitor | 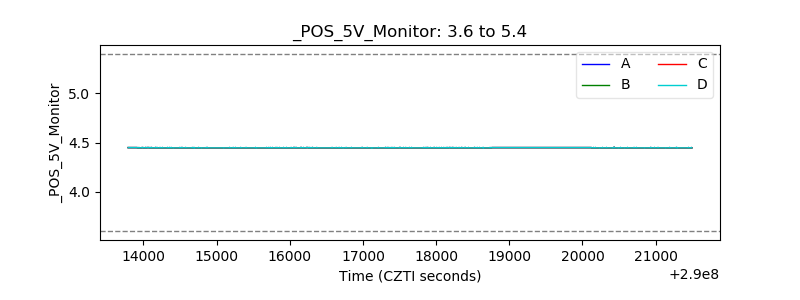 |
| _ROLL_ROT |  |
| _Roll_DEC | 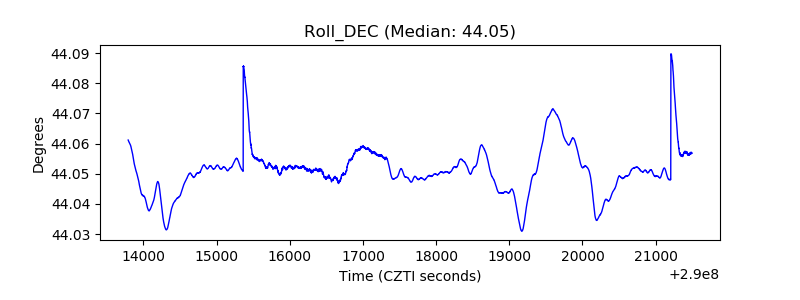 |
| _Roll_RA | 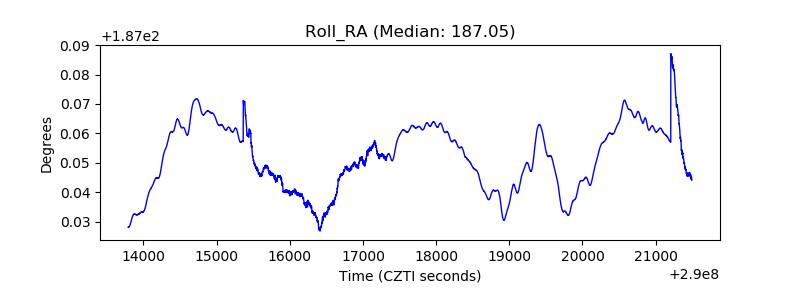 |
| Veto Counter | 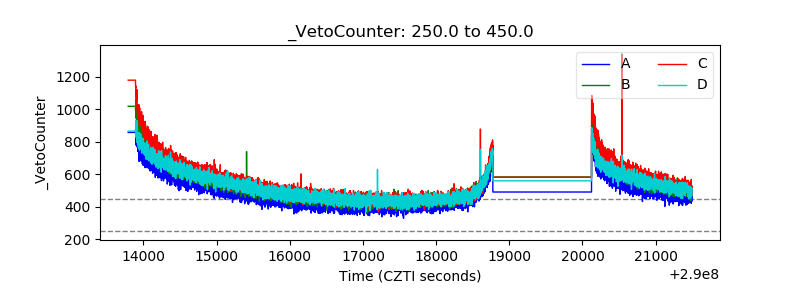 |