| Param | Original file | Final file |
|---|---|---|
| Filename | modeM0/AS1A06_003T01_9000002786_18659cztM0_level2.evt | modeM0/AS1A06_003T01_9000002786_18659cztM0_level2_quad_clean.evt |
| Size (bytes) | 590,898,240 | 108,754,560 |
| Size | 563.5 MB | 103.7 MB |
| Events in quadrant A | 3,390,735 | 720,456 |
| Events in quadrant B | 3,444,712 | 738,212 |
| Events in quadrant C | 3,547,719 | 718,390 |
| Events in quadrant D | 7,065,760 | 657,009 |
| Mode SS | |||
|---|---|---|---|
| Quadrant | BADHDUFLAG | Total packets | Discarded packets |
| A | 0 | 136 | 0 |
| B | 0 | 136 | 0 |
| C | 0 | 136 | 0 |
| D | 0 | 136 | 0 |
| Mode M0 | |||
|---|---|---|---|
| Quadrant | BADHDUFLAG | Total packets | Discarded packets |
| A | 0 | 14375 | 2 |
| B | 0 | 14417 | 2 |
| C | 0 | 14743 | 2 |
| D | 0 | 25665 | 2 |
| Mode M9 | |||
|---|---|---|---|
| Quadrant | BADHDUFLAG | Total packets | Discarded packets |
| A | 0 | 26 | 0 |
| B | 0 | 26 | 0 |
| C | 0 | 26 | 0 |
| D | 0 | 26 | 0 |
| Quadrant | Total seconds | Saturated seconds | Saturation percentage |
|---|---|---|---|
| A | 6587 | 136 | 2.064673% |
| B | 6588 | 164 | 2.489375% |
| C | 6588 | 217 | 3.293868% |
| D | 6588 | 1068 | 16.211293% |
Noise dominated data is calculated using 1-second bins in cleaned event files. If a bin has >2000 counts, and if more than 50% of those come from <1% of pixels, then it is considered to be noise-dominated and hence unusable.
| Quadrant | # 1 sec bins | Bins with >0 counts | Bins with >2000 counts | High rate bins dominated by noise | Noise dominated (total time) | Noise dominated (detector-on time) | Marked lightcurve |
|---|---|---|---|---|---|---|---|
| A | 9182 | 6589 | 0 | 0 | 0.00% | 0.00% | 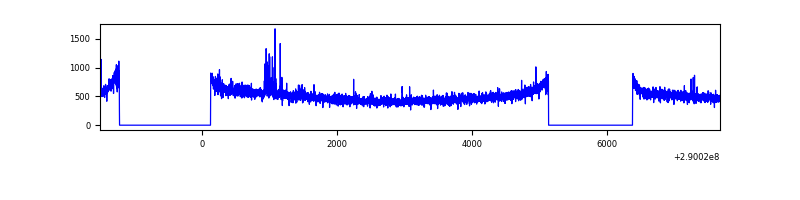 |
| B | 9183 | 6590 | 7 | 7 | 0.08% | 0.11% | 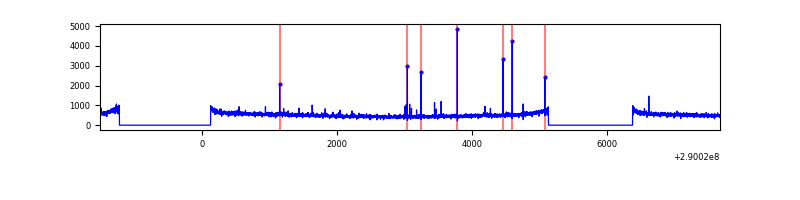 |
| C | 9183 | 6590 | 6 | 6 | 0.07% | 0.09% | 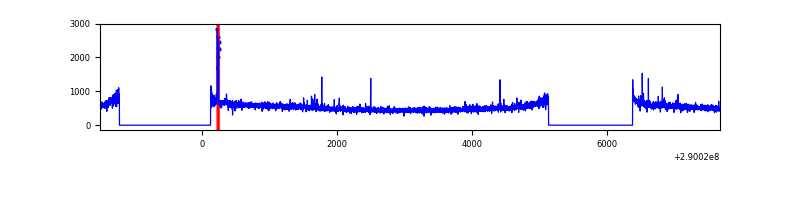 |
| D | 9183 | 6589 | 859 | 859 | 9.35% | 13.04% | 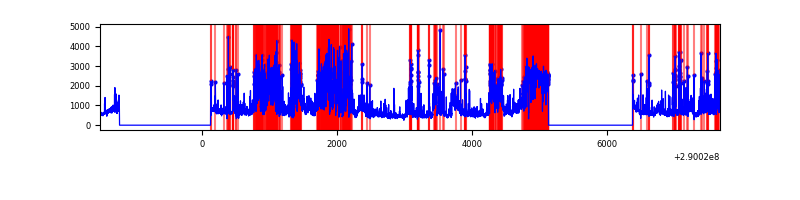 |
Top three noisy pixels from each quadrant. If the there are fewer than three noisy pixels in the level2.evt file, extra rows are filled as -1
| Pixel properties | Quadrant properties | ||||||
|---|---|---|---|---|---|---|---|
| Quadrant | DetID | PixID | Counts | Sigma | Mean | Median | Sigma |
| A | 15 | 192 | 39843 | 224.47 | 865 | 848 | 173.7 |
| A | 6 | 16 | 11742 | 62.71 | 865 | 848 | 173.7 |
| A | 13 | 254 | 7953 | 40.9 | 865 | 848 | 173.7 |
| B | 4 | 80 | 30666 | 184.41 | 866 | 845 | 161.7 |
| B | 12 | 111 | 19817 | 117.32 | 866 | 845 | 161.7 |
| B | 11 | 111 | 16943 | 99.55 | 866 | 845 | 161.7 |
| C | 14 | 238 | 130215 | 658.44 | 849 | 854 | 196.5 |
| C | 9 | 221 | 73824 | 371.41 | 849 | 854 | 196.5 |
| C | 3 | 233 | 28192 | 139.15 | 849 | 854 | 196.5 |
| D | 7 | 238 | 3065798 | 16188.67 | 795 | 774 | 189.3 |
| D | 1 | 52 | 496461 | 2618.09 | 795 | 774 | 189.3 |
| D | 13 | 168 | 464094 | 2447.14 | 795 | 774 | 189.3 |
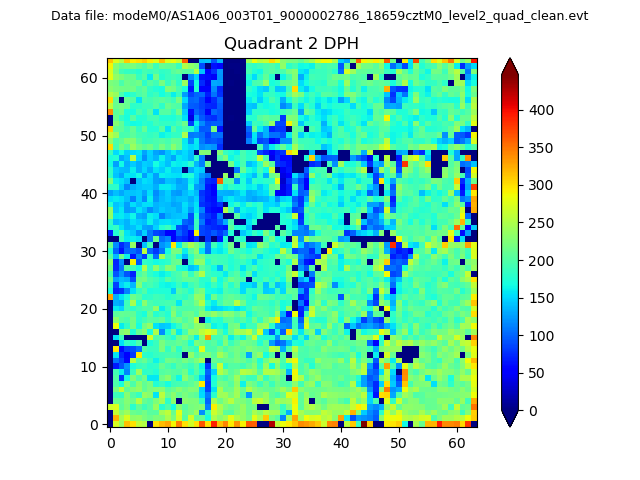
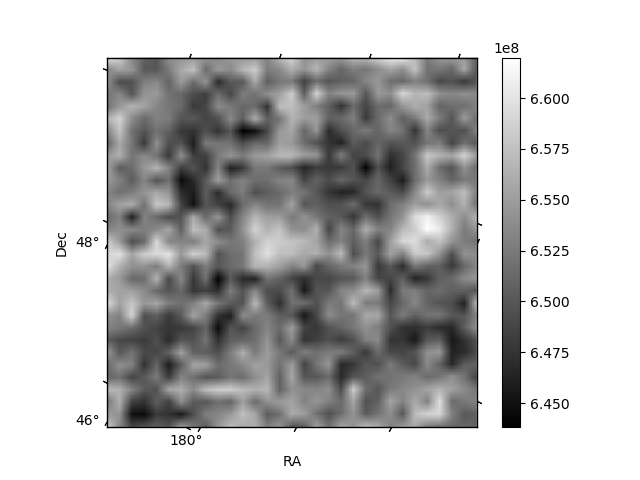
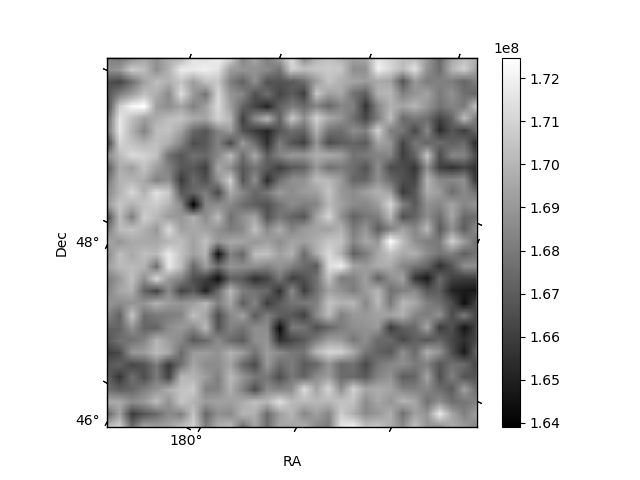
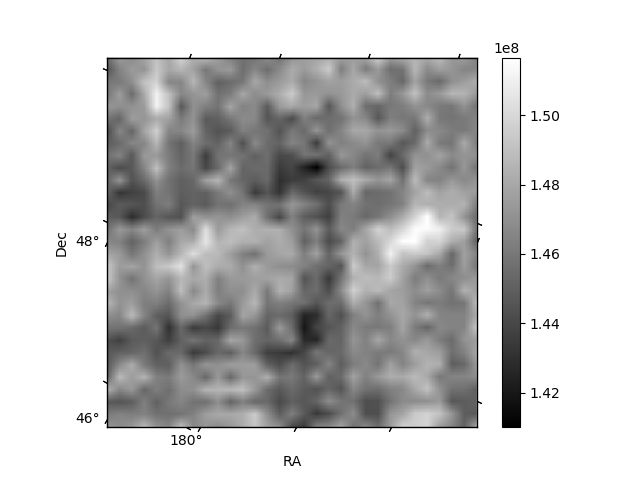
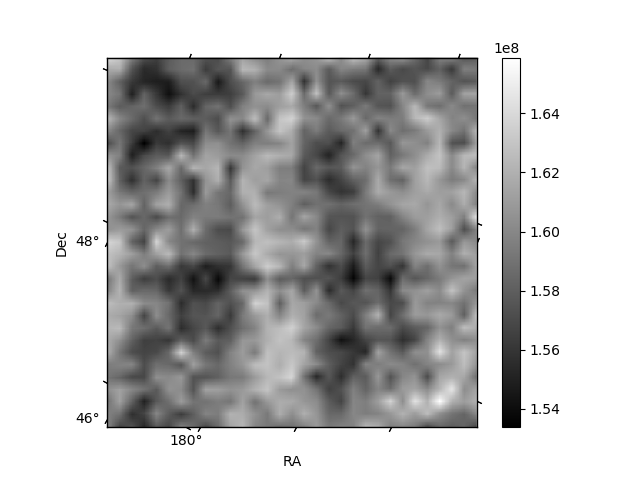
Histogram calculated using DETX and DETY for each event in the final _common_clean file
| Quadrant A | 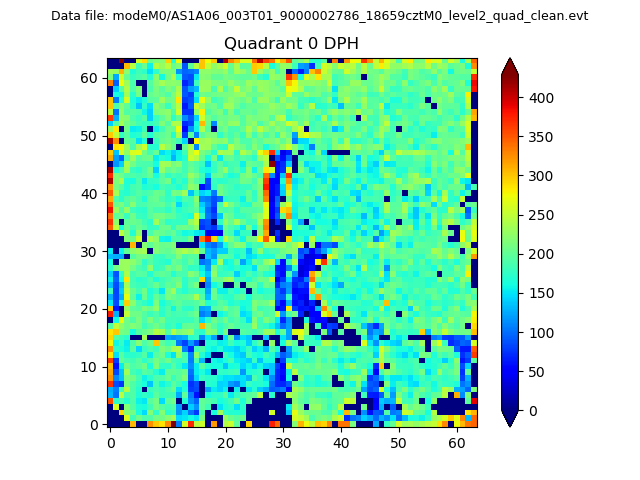 |
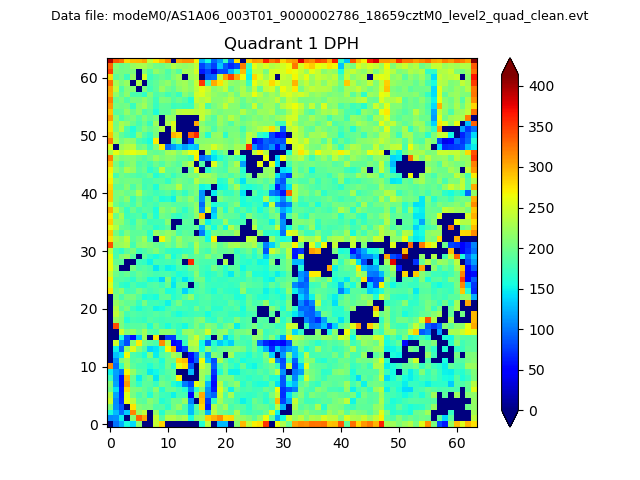 |
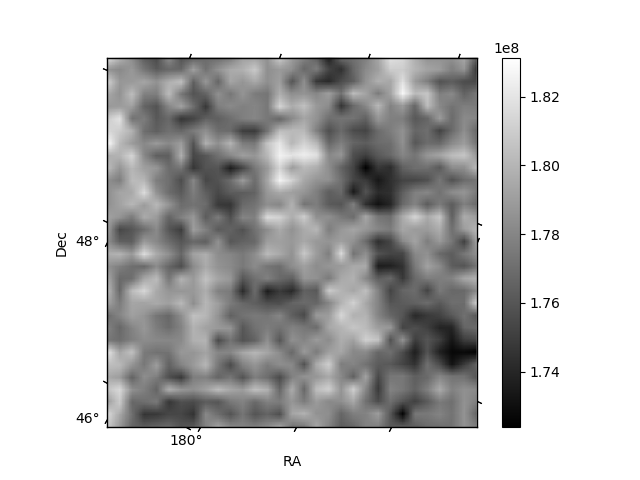
Quadrant B |
|---|---|---|---|
| Quadrant D | 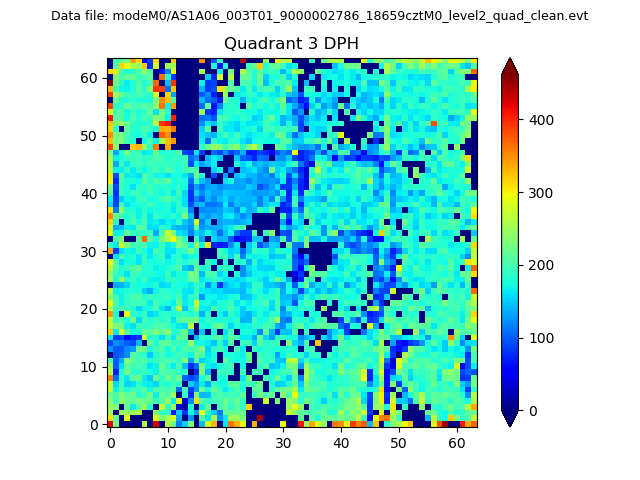 |
 |
Quadrant C |
| Plot type | Count rate plots | Images |
|---|---|---|
| Comparison with Poisson distribution Blue bars denote a histogram of data divided into 1 sec bins. Red curve is a Poisson curve with rate = median count rate of data. |
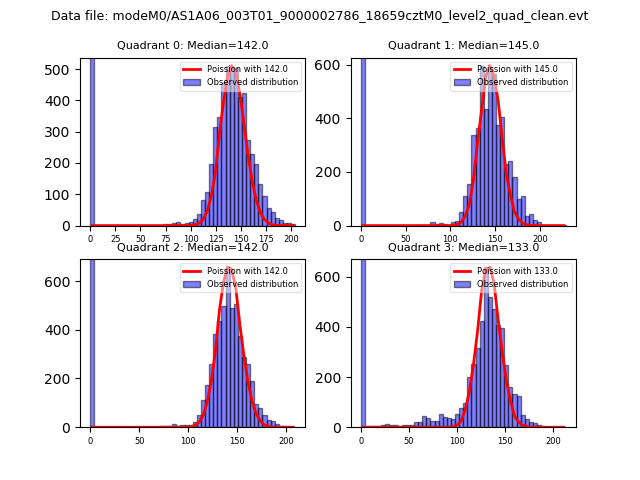 |
 |
| Quadrant-wise count rates Data is divided into 100 sec bins |
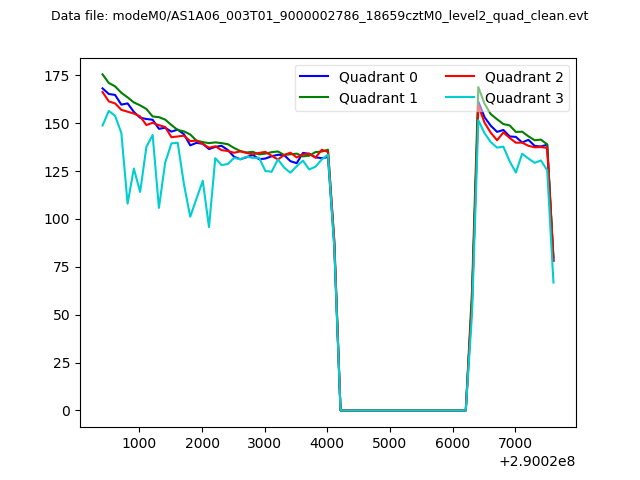 |
|
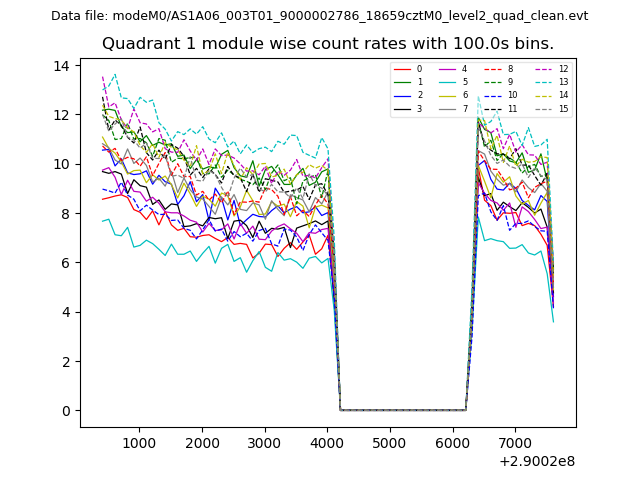
| Module-wise count rates for Quadrant A Data is divided into 100 sec bins |
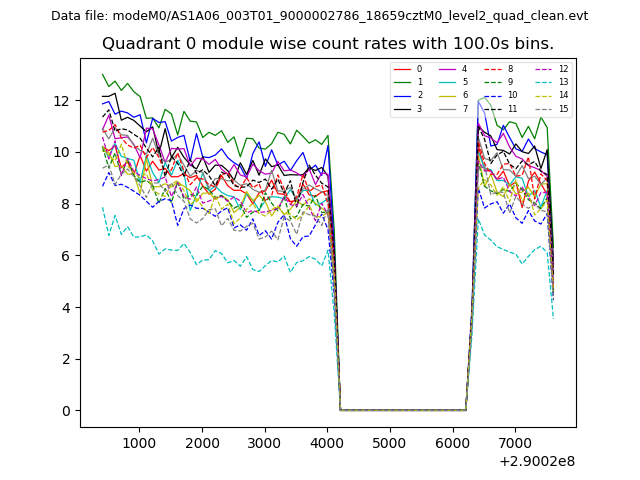 |
 |
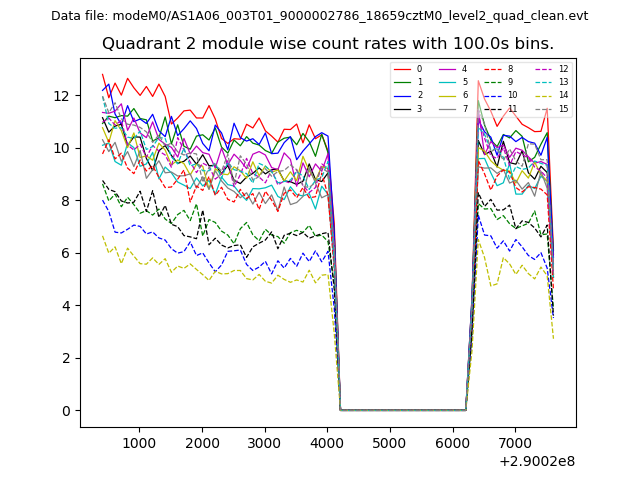
| Module-wise count rates for Quadrant B Data is divided into 100 sec bins |
 |
 |
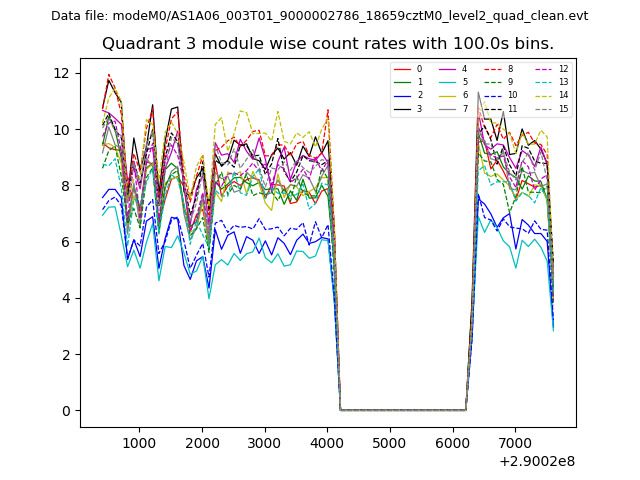
| Module-wise count rates for Quadrant C Data is divided into 100 sec bins |
 |
 |
| Module-wise count rates for Quadrant D Data is divided into 100 sec bins |
 |
 |
| Parameter | Plot |
|---|---|
| CZT HV Monitor | 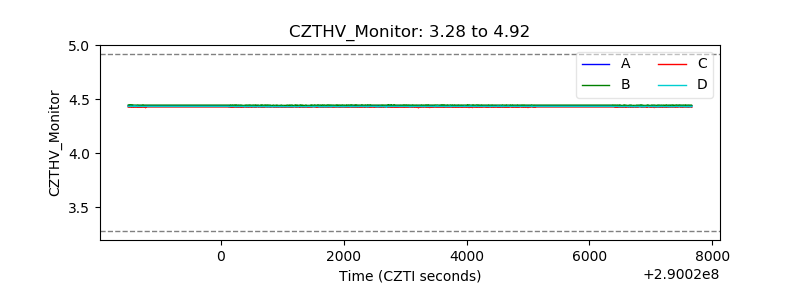 |
| D_VDD | 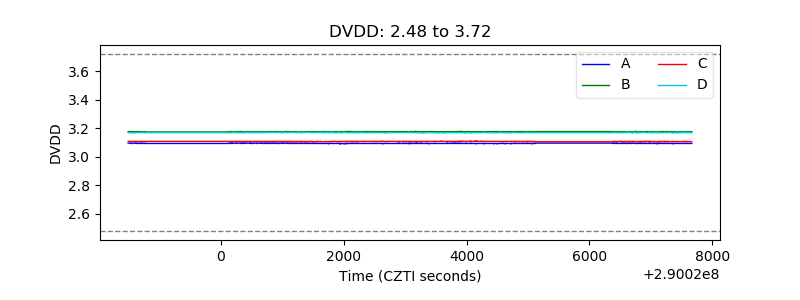 |
| Temperature 1 | 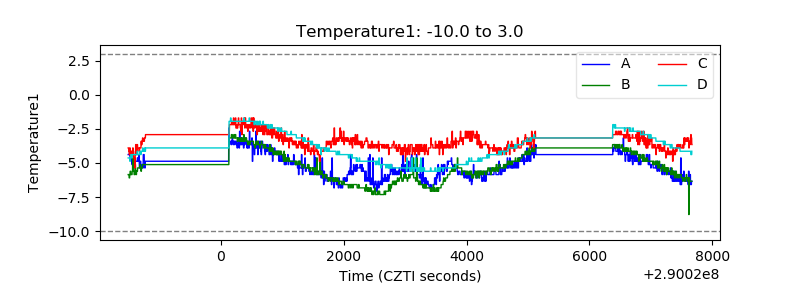 |
| Veto HV Monitor | 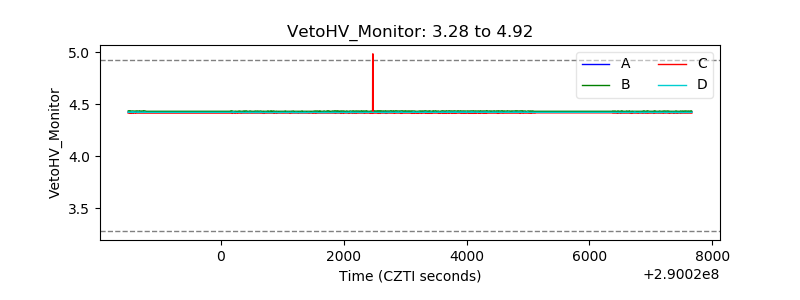 |
| Veto LLD | 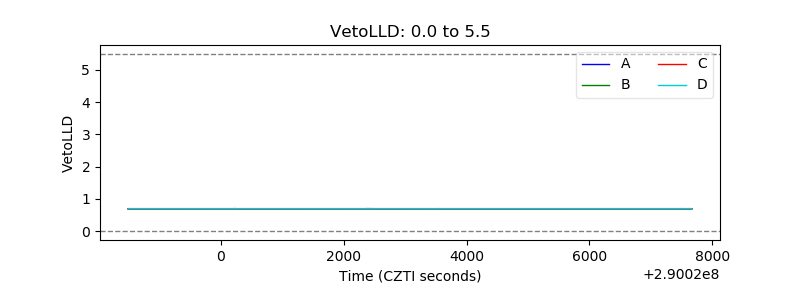 |
| Alpha Counter | 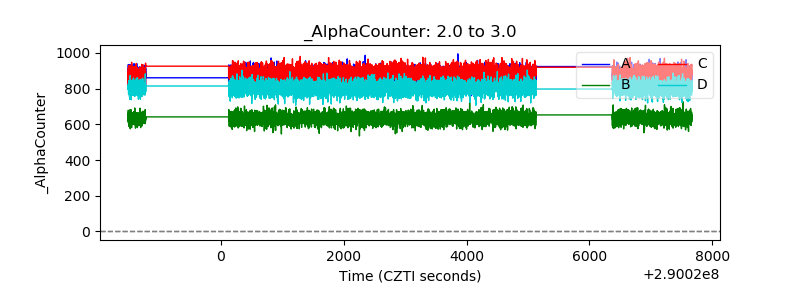 |
| _CPM_Rate | 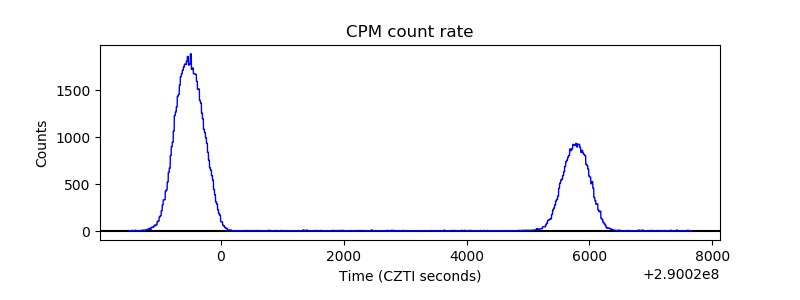 |
| CZT Counter | 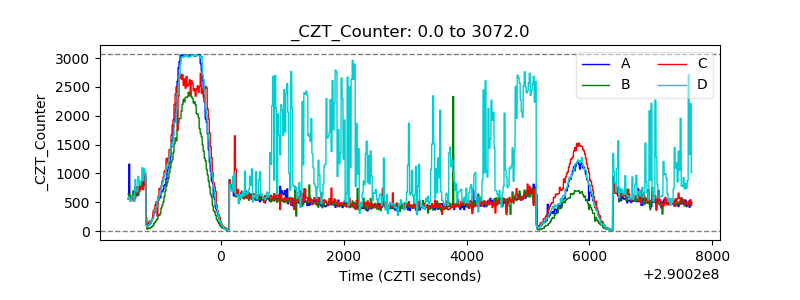 |
| +2.5 Volts monitor | 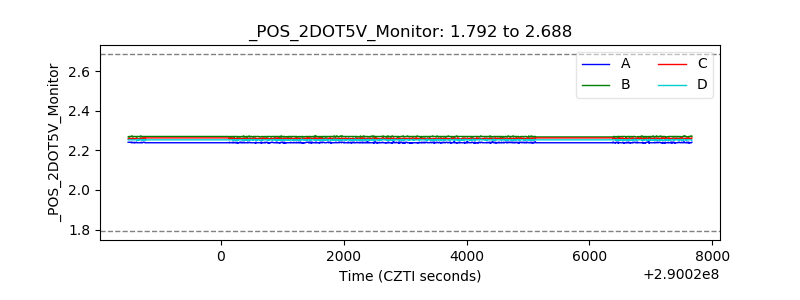 |
| +5 Volts monitor | 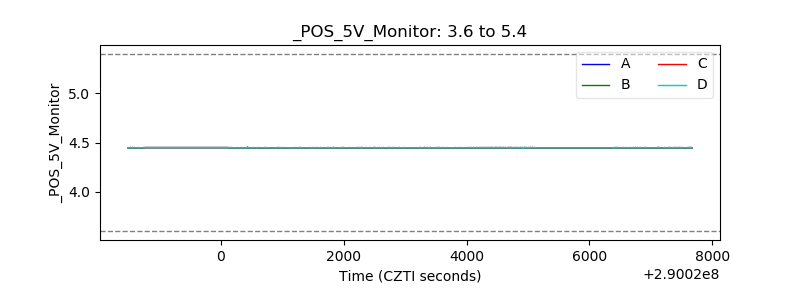 |
| _ROLL_ROT | 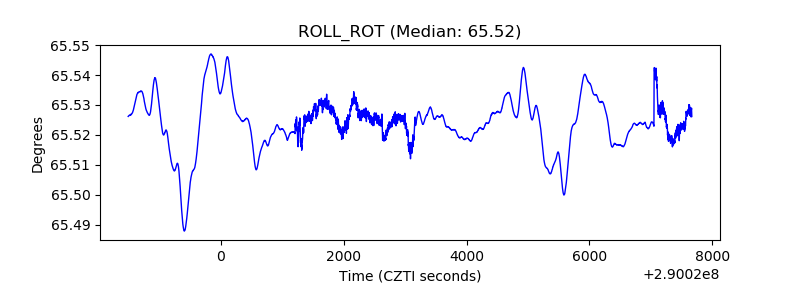 |
| _Roll_DEC | 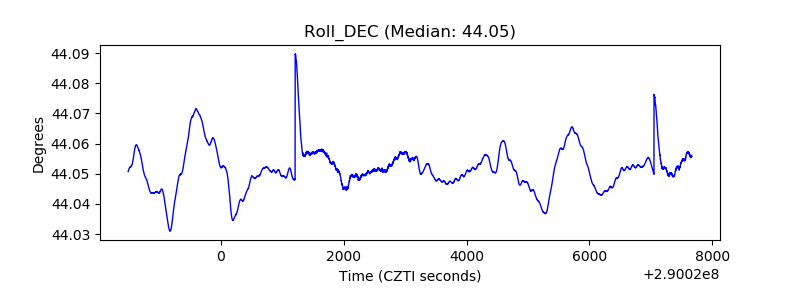 |
| _Roll_RA | 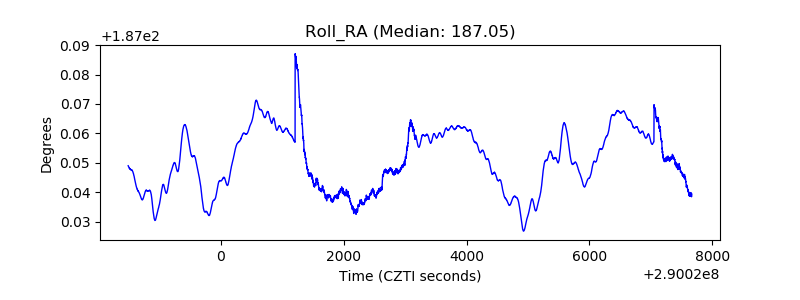 |
| Veto Counter | 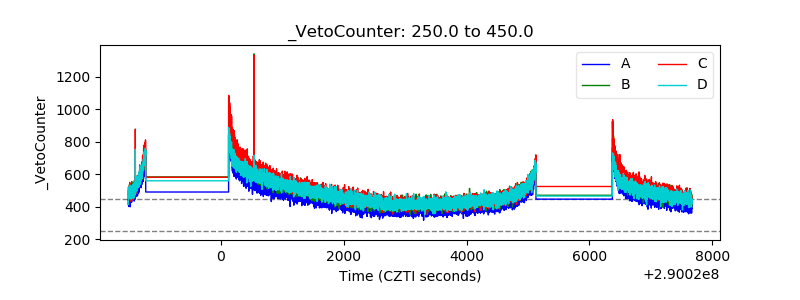 |