| Param | Original file | Final file |
|---|---|---|
| Filename | modeM0/AS1A06_003T01_9000002786_18661cztM0_level2.evt | modeM0/AS1A06_003T01_9000002786_18661cztM0_level2_quad_clean.evt |
| Size (bytes) | 486,878,400 | 94,979,520 |
| Size | 464.3 MB | 90.6 MB |
| Events in quadrant A | 2,983,453 | 618,217 |
| Events in quadrant B | 3,053,349 | 632,544 |
| Events in quadrant C | 3,129,827 | 617,527 |
| Events in quadrant D | 5,153,624 | 571,155 |
| Mode SS | |||
|---|---|---|---|
| Quadrant | BADHDUFLAG | Total packets | Discarded packets |
| A | 0 | 128 | 0 |
| B | 0 | 128 | 0 |
| C | 0 | 128 | 0 |
| D | 0 | 128 | 0 |
| Mode M0 | |||
|---|---|---|---|
| Quadrant | BADHDUFLAG | Total packets | Discarded packets |
| A | 0 | 12934 | 2 |
| B | 0 | 13099 | 2 |
| C | 0 | 13246 | 2 |
| D | 0 | 19493 | 2 |
| Mode M9 | |||
|---|---|---|---|
| Quadrant | BADHDUFLAG | Total packets | Discarded packets |
| A | 0 | 10 | 0 |
| B | 0 | 11 | 0 |
| C | 0 | 11 | 0 |
| D | 0 | 11 | 0 |
| Quadrant | Total seconds | Saturated seconds | Saturation percentage |
|---|---|---|---|
| A | 6256 | 19 | 0.303708% |
| B | 6256 | 40 | 0.639386% |
| C | 6256 | 78 | 1.246803% |
| D | 6256 | 450 | 7.193095% |
Noise dominated data is calculated using 1-second bins in cleaned event files. If a bin has >2000 counts, and if more than 50% of those come from <1% of pixels, then it is considered to be noise-dominated and hence unusable.
| Quadrant | # 1 sec bins | Bins with >0 counts | Bins with >2000 counts | High rate bins dominated by noise | Noise dominated (total time) | Noise dominated (detector-on time) | Marked lightcurve |
|---|---|---|---|---|---|---|---|
| A | 7241 | 6257 | 0 | 0 | 0.00% | 0.00% | 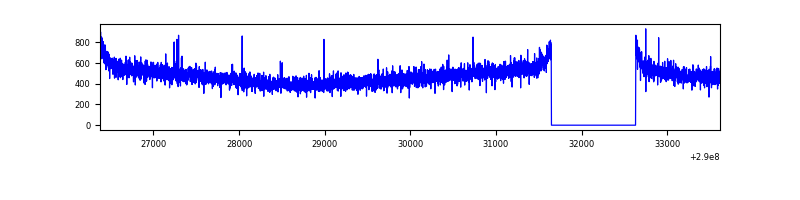 |
| B | 7241 | 6257 | 2 | 2 | 0.03% | 0.03% | 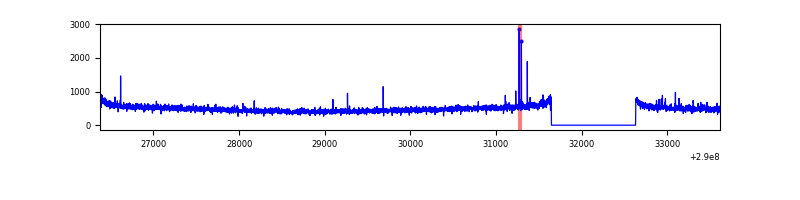 |
| C | 7241 | 6257 | 0 | 0 | 0.00% | 0.00% | 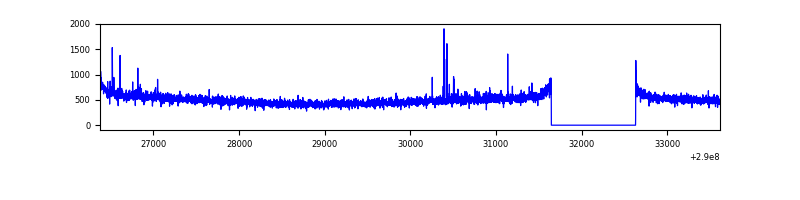 |
| D | 7241 | 6257 | 408 | 408 | 5.63% | 6.52% | 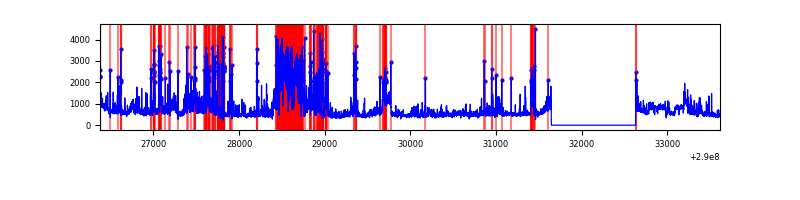 |
Top three noisy pixels from each quadrant. If the there are fewer than three noisy pixels in the level2.evt file, extra rows are filled as -1
| Pixel properties | Quadrant properties | ||||||
|---|---|---|---|---|---|---|---|
| Quadrant | DetID | PixID | Counts | Sigma | Mean | Median | Sigma |
| A | 11 | 29 | 11786 | 71.85 | 767 | 752 | 153.6 |
| A | 15 | 192 | 10698 | 64.77 | 767 | 752 | 153.6 |
| A | 13 | 254 | 8133 | 48.06 | 767 | 752 | 153.6 |
| B | 12 | 111 | 17764 | 116.33 | 769 | 752 | 146.2 |
| B | 11 | 111 | 15450 | 100.51 | 769 | 752 | 146.2 |
| B | 14 | 111 | 13745 | 88.85 | 769 | 752 | 146.2 |
| C | 14 | 238 | 116364 | 661.6 | 752 | 757 | 174.7 |
| C | 9 | 221 | 46876 | 263.93 | 752 | 757 | 174.7 |
| C | 3 | 233 | 35510 | 198.88 | 752 | 757 | 174.7 |
| D | 7 | 238 | 1221465 | 6831.43 | 738 | 716 | 178.7 |
| D | 13 | 168 | 574509 | 3211.0 | 738 | 716 | 178.7 |
| D | 1 | 52 | 532282 | 2974.7 | 738 | 716 | 178.7 |
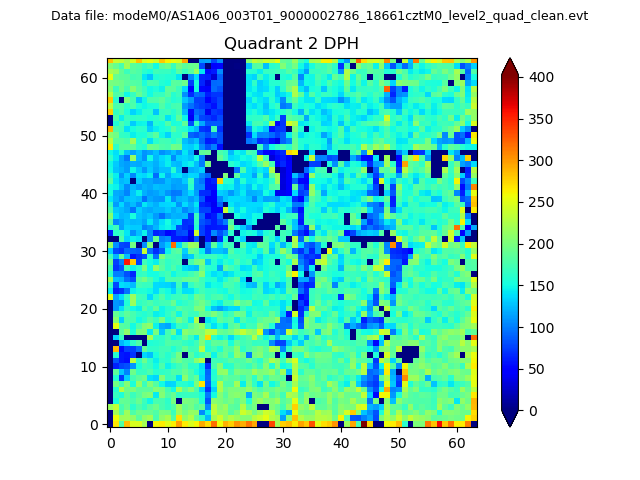
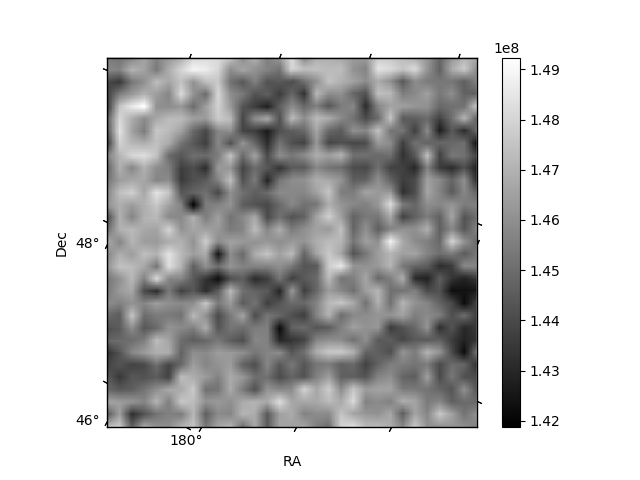
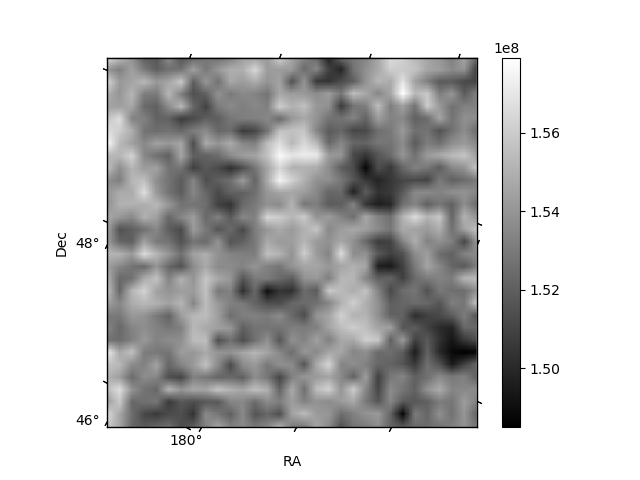
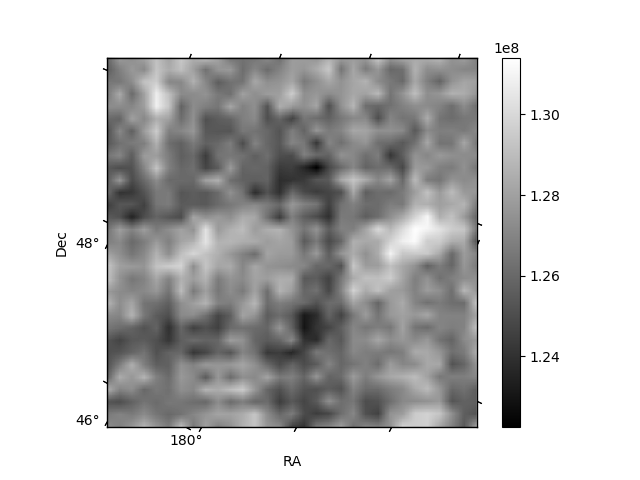
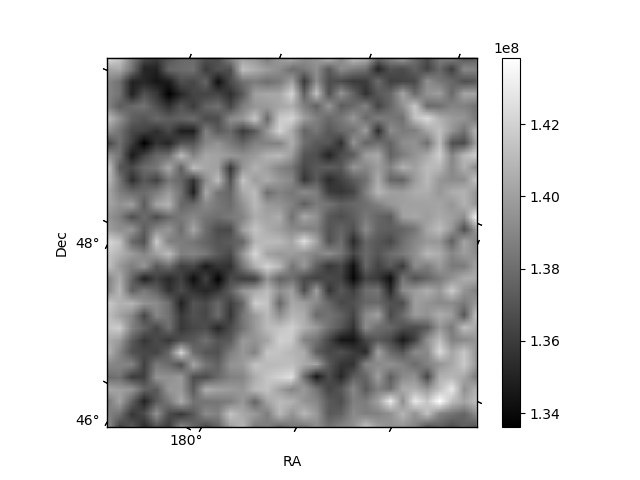
Histogram calculated using DETX and DETY for each event in the final _common_clean file
| Quadrant A | 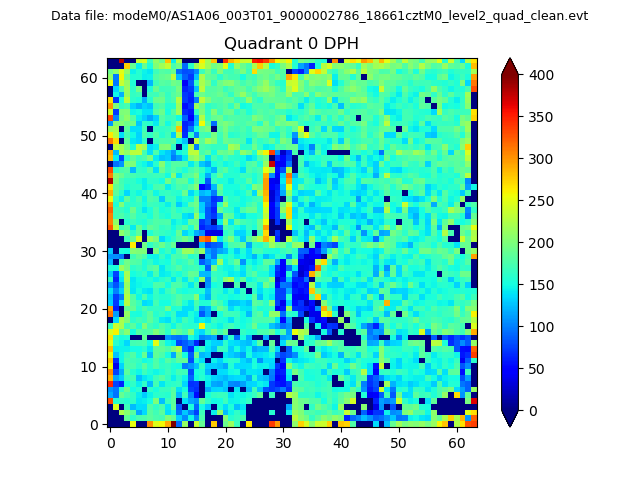 |
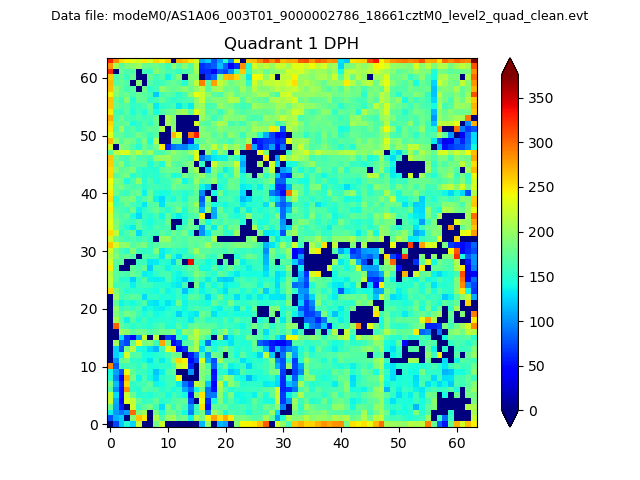 |
Quadrant B |
|---|---|---|---|
| Quadrant D | 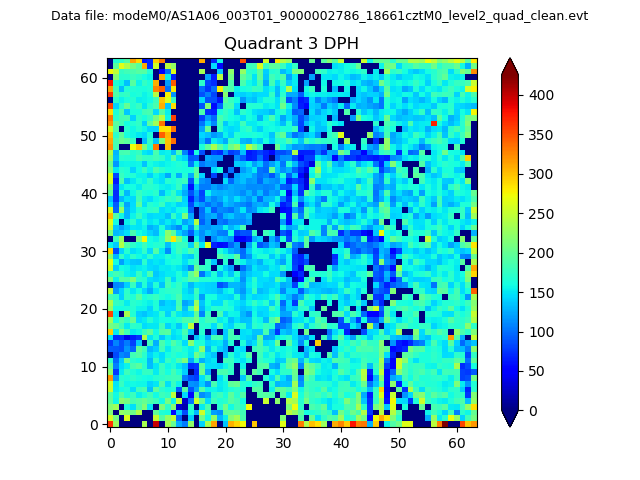 |
 |
Quadrant C |
| Plot type | Count rate plots | Images |
|---|---|---|
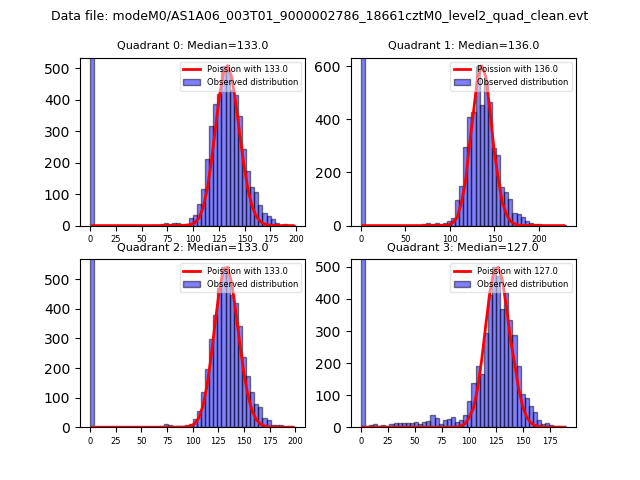
| Comparison with Poisson distribution Blue bars denote a histogram of data divided into 1 sec bins. Red curve is a Poisson curve with rate = median count rate of data. |
 |
 |
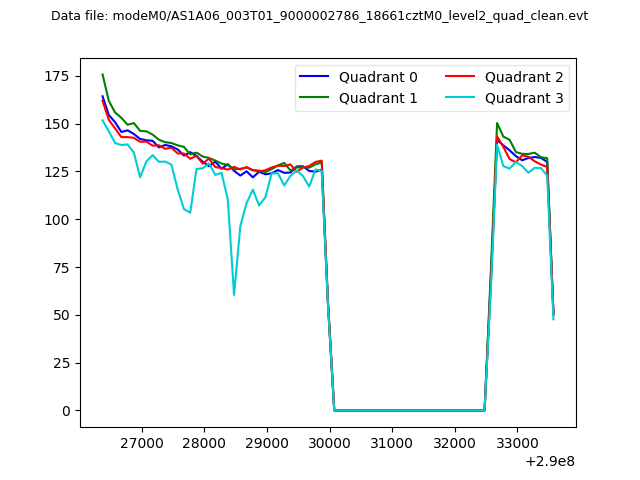
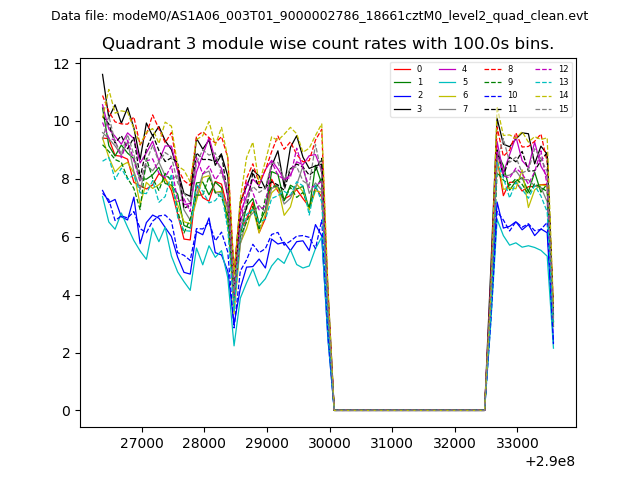
| Quadrant-wise count rates Data is divided into 100 sec bins |
 |
|
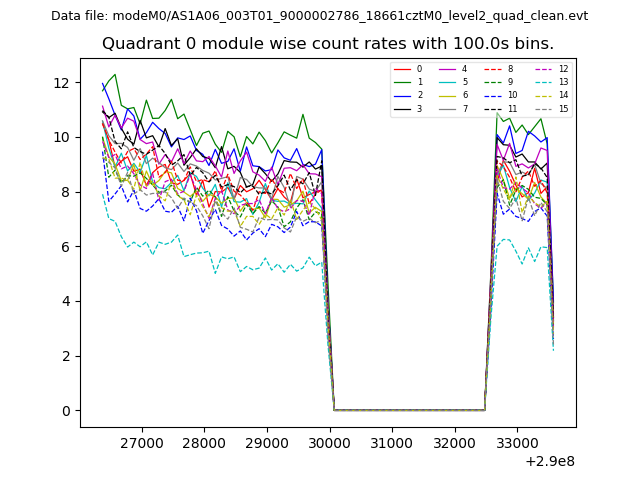
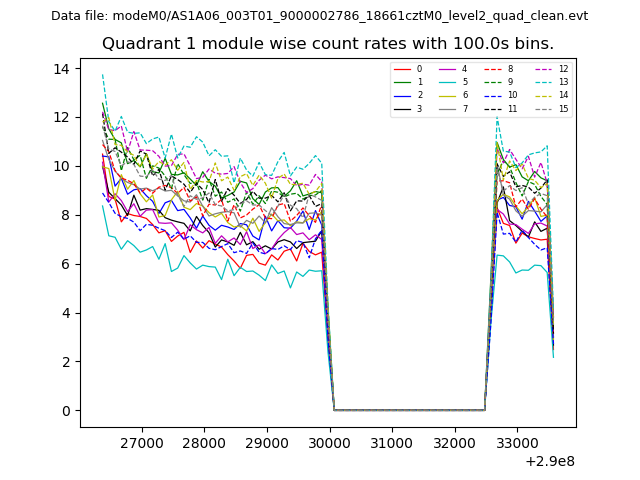
| Module-wise count rates for Quadrant A Data is divided into 100 sec bins |
 |
 |
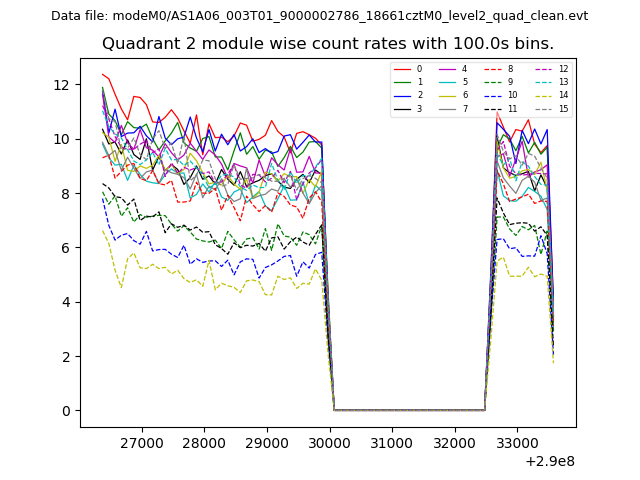
| Module-wise count rates for Quadrant B Data is divided into 100 sec bins |
 |
 |
| Module-wise count rates for Quadrant C Data is divided into 100 sec bins |
 |
 |
| Module-wise count rates for Quadrant D Data is divided into 100 sec bins |
 |
 |
| Parameter | Plot |
|---|---|
| CZT HV Monitor | 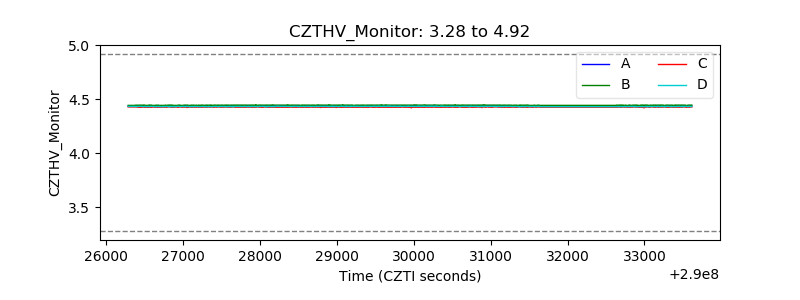 |
| D_VDD | 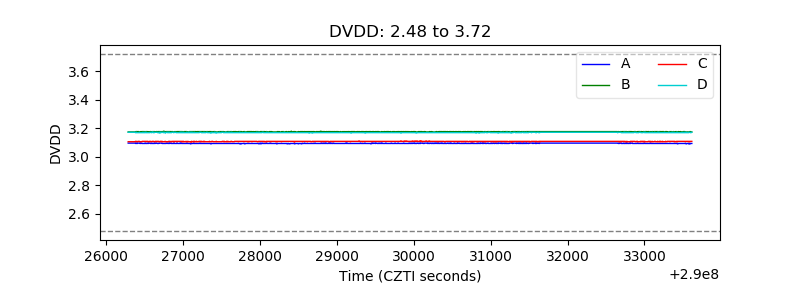 |
| Temperature 1 | 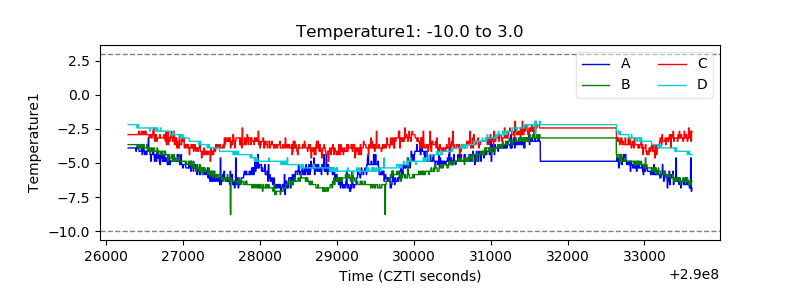 |
| Veto HV Monitor | 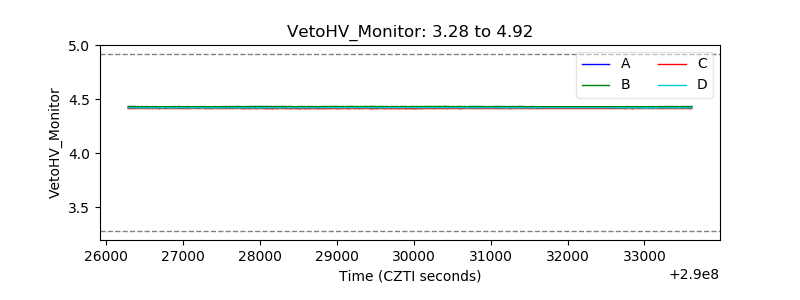 |
| Veto LLD | 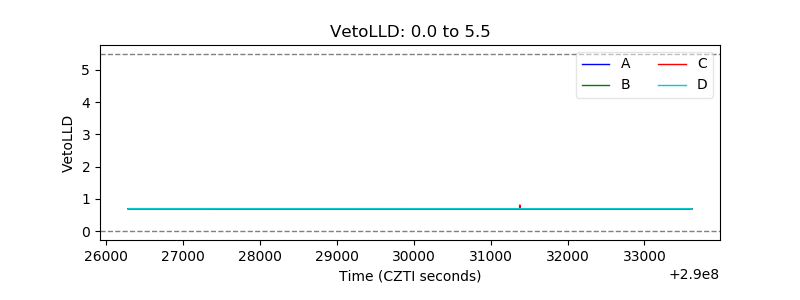 |
| Alpha Counter | 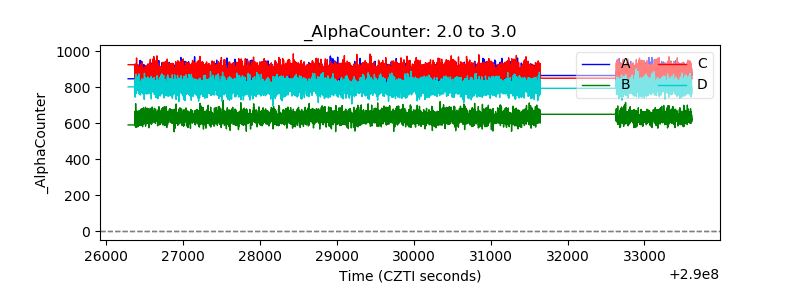 |
| _CPM_Rate | 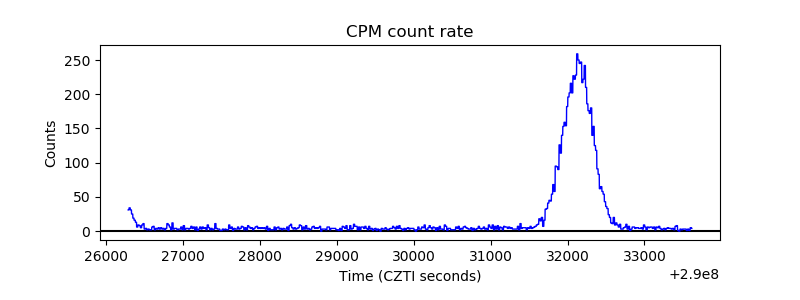 |
| CZT Counter | 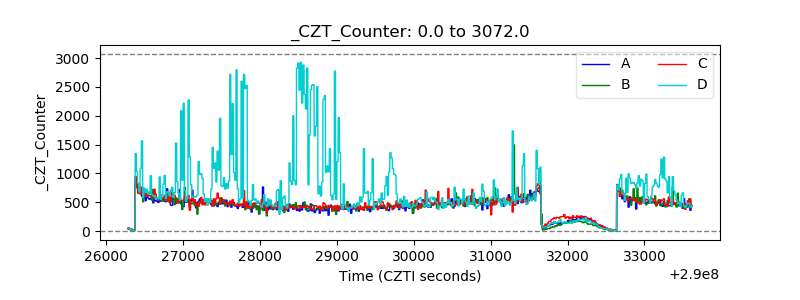 |
| +2.5 Volts monitor |  |
| +5 Volts monitor |  |
| _ROLL_ROT | 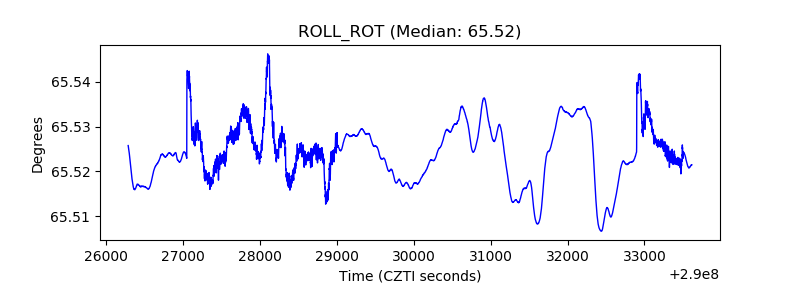 |
| _Roll_DEC |  |
| _Roll_RA | 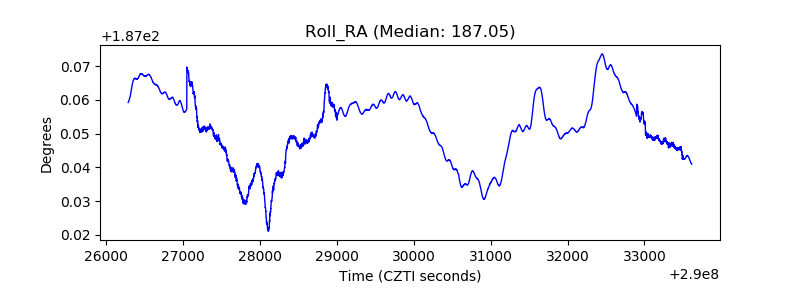 |
| Veto Counter | 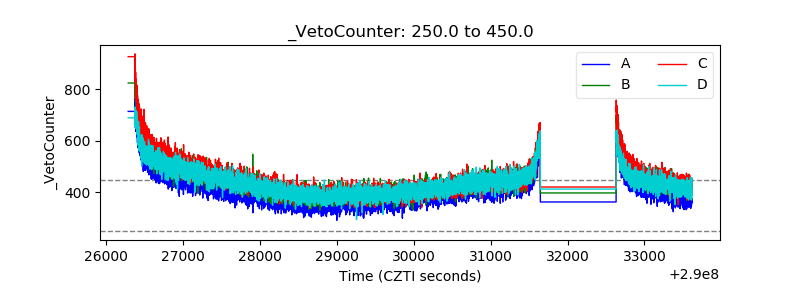 |