| Param | Original file | Final file |
|---|---|---|
| Filename | modeM0/AS1A06_005T01_9000002788cztM0_level2.fits | modeM0/AS1A06_005T01_9000002788cztM0_level2_quad_clean.evt |
| Size (bytes) | 568,998,720 | 566,380,800 |
| Size | 542.6 MB | 540.1 MB |
| Events in quadrant A | 3,596,826 | 3,668,211 |
| Events in quadrant B | 3,460,934 | 3,682,470 |
| Events in quadrant C | 3,499,752 | 3,477,501 |
| Events in quadrant D | 2,579,832 | 2,236,520 |
| Mode SS | |||
|---|---|---|---|
| Quadrant | BADHDUFLAG | Total packets | Discarded packets |
| A | 0 | 1210 | 0 |
| B | 0 | 1210 | 0 |
| C | 0 | 1210 | 0 |
| D | 0 | 1210 | 0 |
| Mode M9 | |||
|---|---|---|---|
| Quadrant | BADHDUFLAG | Total packets | Discarded packets |
| A | 0 | 92 | 0 |
| B | 0 | 92 | 0 |
| C | 0 | 92 | 0 |
| D | 0 | 92 | 0 |
| Mode M0 | |||
|---|---|---|---|
| Quadrant | BADHDUFLAG | Total packets | Discarded packets |
| A | 0 | 126022 | 0 |
| B | 0 | 125815 | 0 |
| C | 0 | 125285 | 0 |
| D | 0 | 246437 | 0 |
| Quadrant | Total seconds | Saturated seconds | Saturation percentage |
|---|---|---|---|
| A | 59615 | 600 | 1.006458% |
| B | 59616 | 765 | 1.283213% |
| C | 59616 | 910 | 1.526436% |
| D | 59615 | 14597 | 24.485448% |
Noise dominated data is calculated using 1-second bins in cleaned event files. If a bin has >2000 counts, and if more than 50% of those come from <1% of pixels, then it is considered to be noise-dominated and hence unusable.
| Quadrant | # 1 sec bins | Bins with >0 counts | Bins with >2000 counts | High rate bins dominated by noise | Noise dominated (total time) | Noise dominated (detector-on time) | Marked lightcurve |
|---|---|---|---|---|---|---|---|
| A | 68636 | 59611 | 0 | 0 | 0.00% | 0.00% | 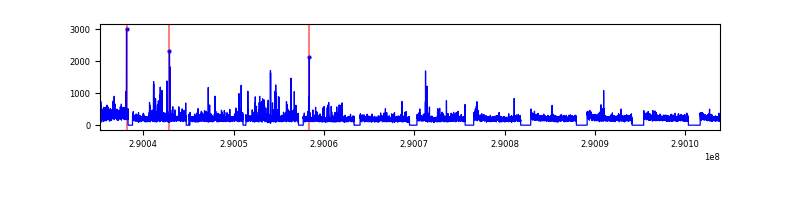 |
| B | 68636 | 59609 | 0 | 0 | 0.00% | 0.00% | 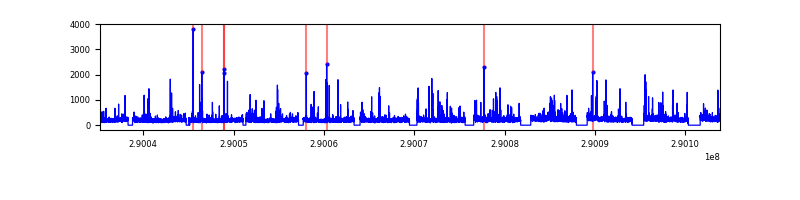 |
| C | 68636 | 59609 | 0 | 0 | 0.00% | 0.00% | 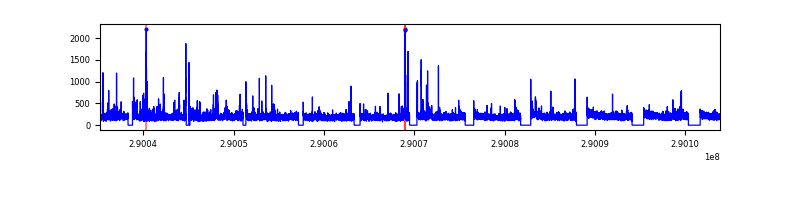 |
| D | 68636 | 58302 | 0 | 0 | 0.00% | 0.00% | 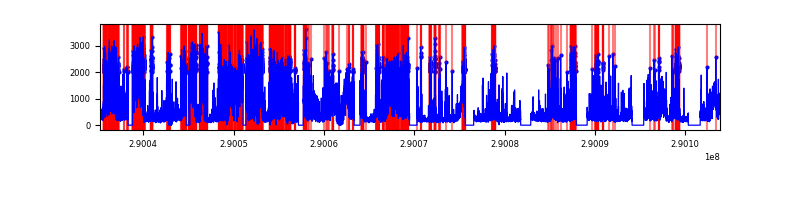 |
Top three noisy pixels from each quadrant. If the there are fewer than three noisy pixels in the level2.evt file, extra rows are filled as -1
| Pixel properties | Quadrant properties | ||||||
|---|---|---|---|---|---|---|---|
| Quadrant | DetID | PixID | Counts | Sigma | Mean | Median | Sigma |
| A | 7 | 110 | 2954 | 8.93 | 937 | 881 | 232.0 |
| A | 0 | 29 | 2917 | 8.78 | 937 | 881 | 232.0 |
| A | 9 | 19 | 2653 | 7.64 | 937 | 881 | 232.0 |
| B | 2 | 9 | 2748 | 10.46 | 915 | 874 | 179.2 |
| B | 2 | 8 | 2310 | 8.01 | 915 | 874 | 179.2 |
| B | 14 | 254 | 2260 | 7.73 | 915 | 874 | 179.2 |
| C | 12 | 241 | 2457 | 6.68 | 924 | 865 | 238.4 |
| C | 3 | 126 | 2426 | 6.55 | 924 | 865 | 238.4 |
| C | 2 | 191 | 2380 | 6.36 | 924 | 865 | 238.4 |
| D | 10 | 190 | 1919 | 6.49 | 735 | 672 | 192.1 |
| D | 3 | 14 | 1880 | 6.29 | 735 | 672 | 192.1 |
| D | 6 | 231 | 1865 | 6.21 | 735 | 672 | 192.1 |
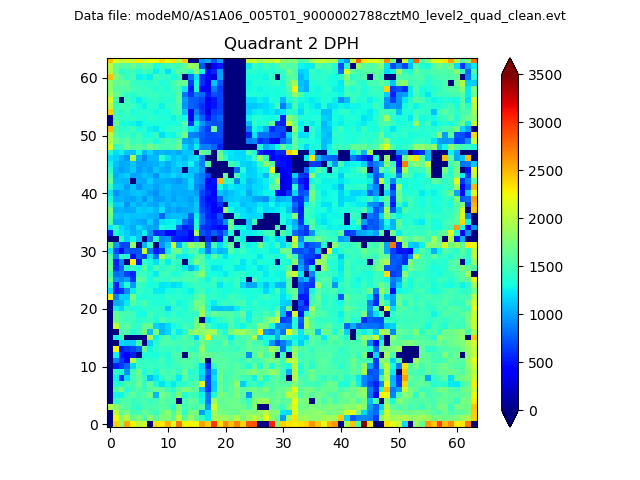
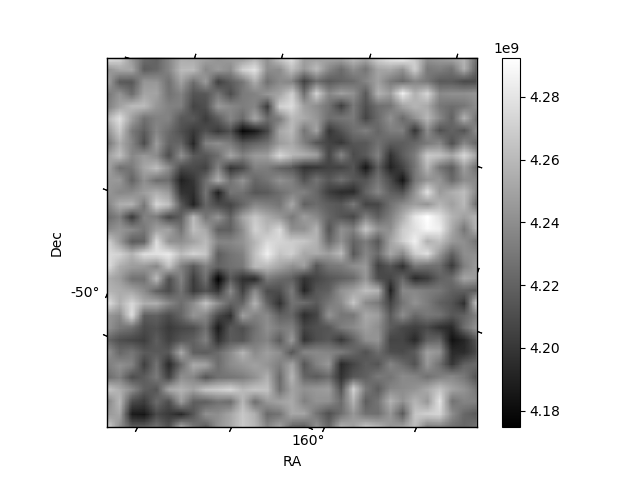
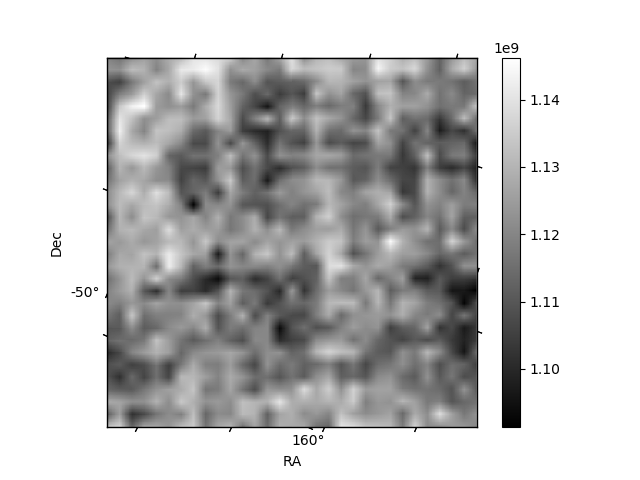
Histogram calculated using DETX and DETY for each event in the final _common_clean file
| Quadrant A | 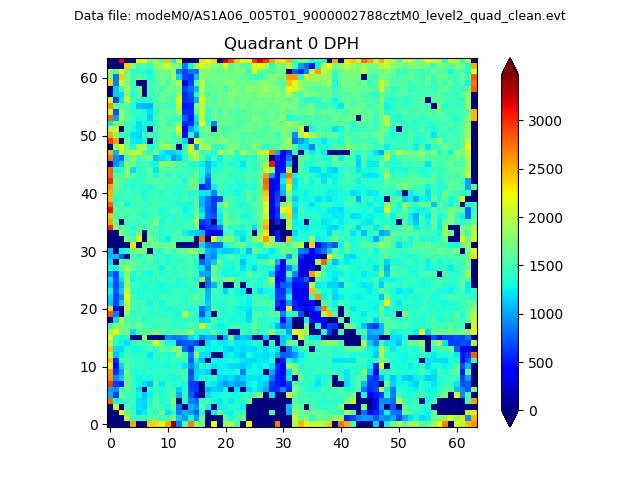 |
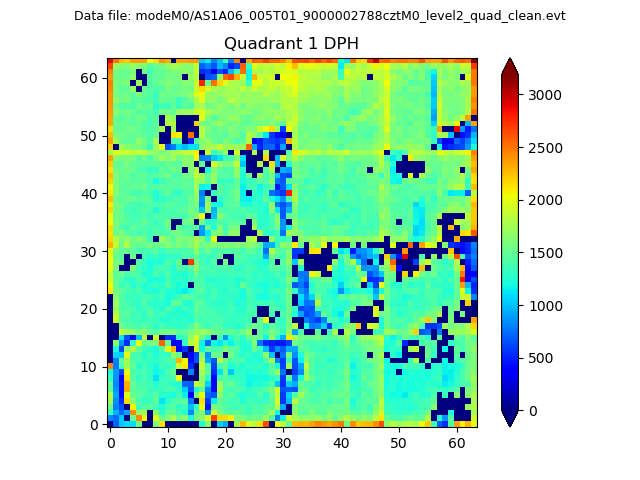 |
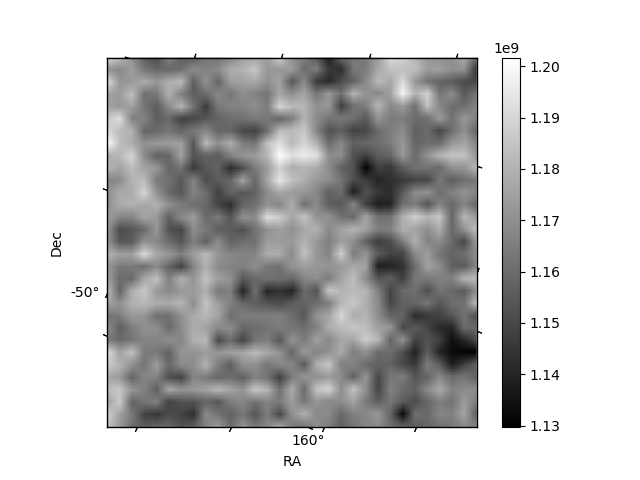
Quadrant B |
|---|---|---|---|
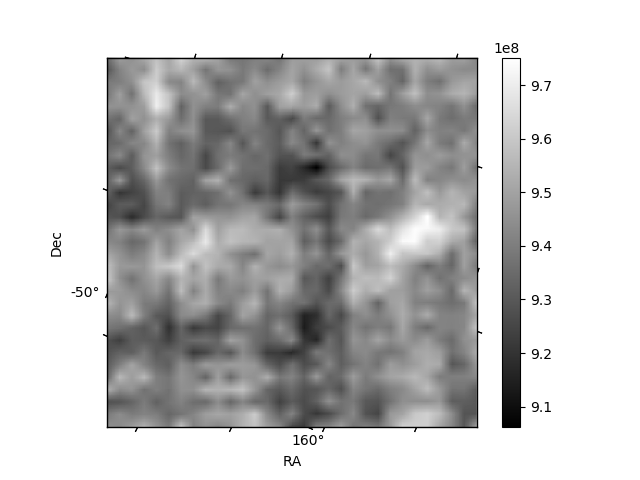
| Quadrant D | 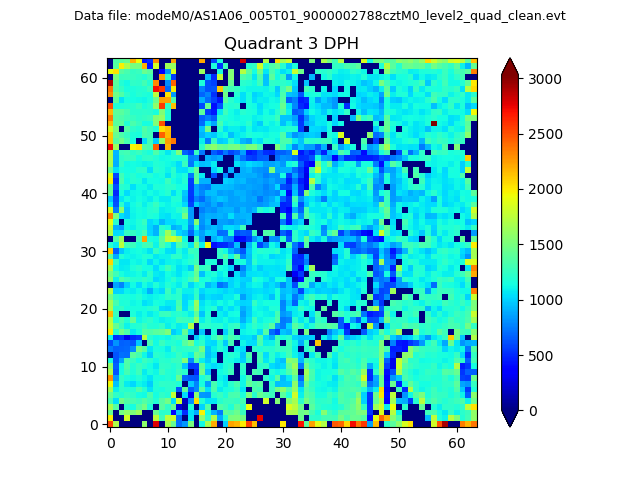 |
 |
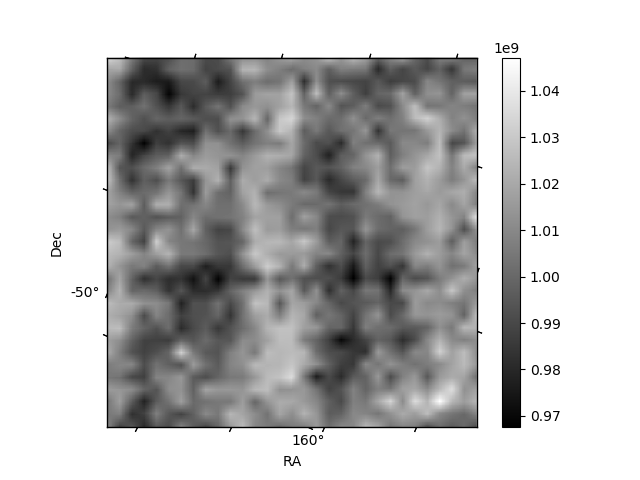
Quadrant C |
| Plot type | Count rate plots | Images |
|---|---|---|
| Comparison with Poisson distribution Blue bars denote a histogram of data divided into 1 sec bins. Red curve is a Poisson curve with rate = median count rate of data. |
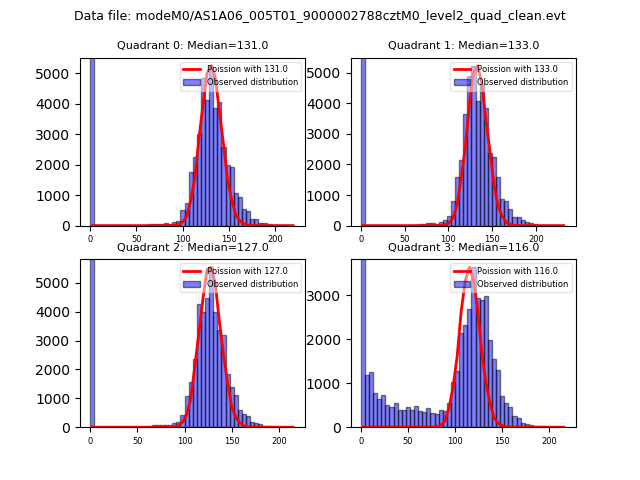 |
 |
| Quadrant-wise count rates Data is divided into 100 sec bins |
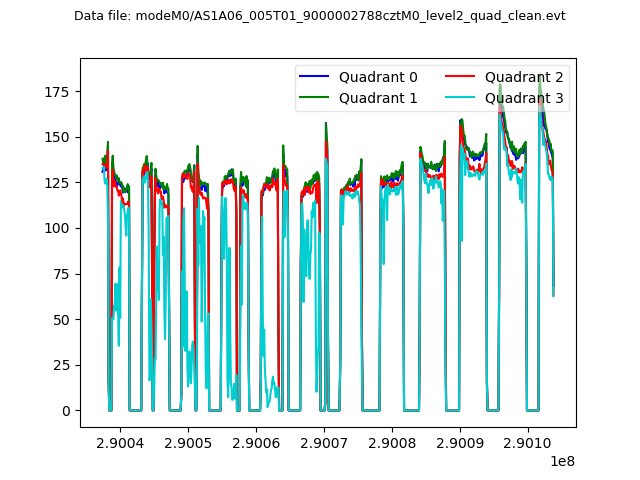 |
|
| Module-wise count rates for Quadrant A Data is divided into 100 sec bins |
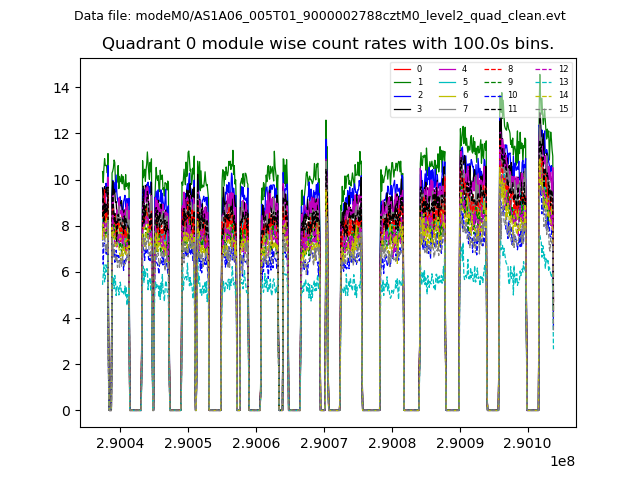 |
 |
| Module-wise count rates for Quadrant B Data is divided into 100 sec bins |
 |
 |
| Module-wise count rates for Quadrant C Data is divided into 100 sec bins |
 |
 |
| Module-wise count rates for Quadrant D Data is divided into 100 sec bins |
 |
 |
| Parameter | Plot |
|---|---|
| CZT HV Monitor | 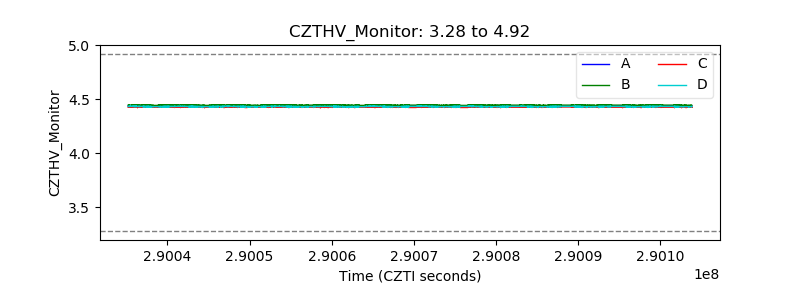 |
| D_VDD | 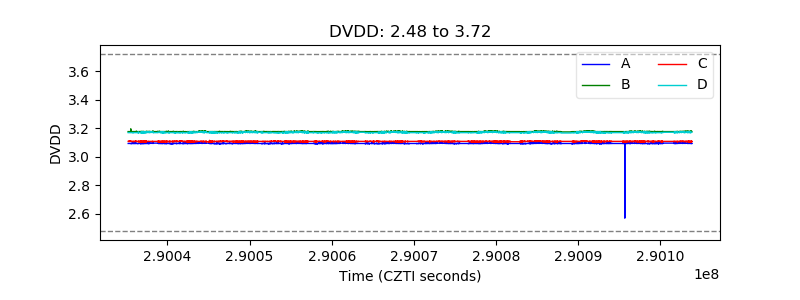 |
| Temperature 1 | 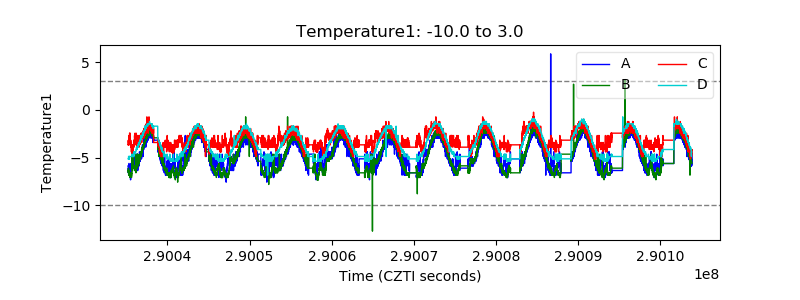 |
| Veto HV Monitor |  |
| Veto LLD | 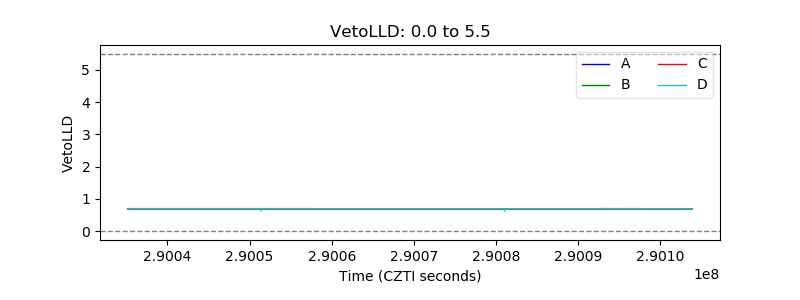 |
| Alpha Counter | 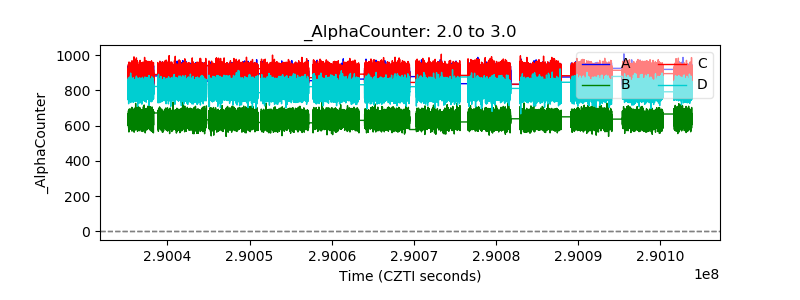 |
| _CPM_Rate | 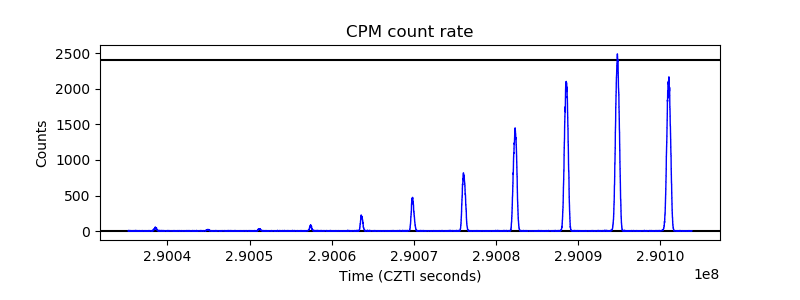 |
| CZT Counter | 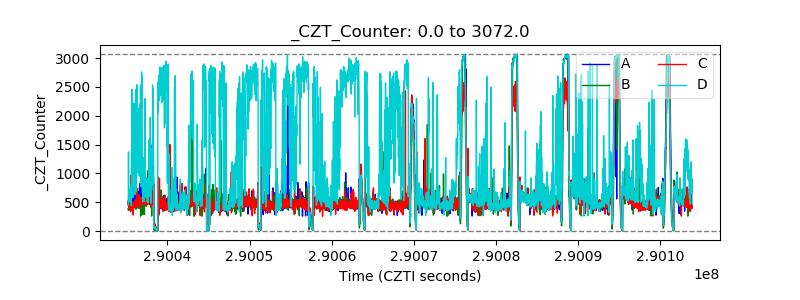 |
| +2.5 Volts monitor | 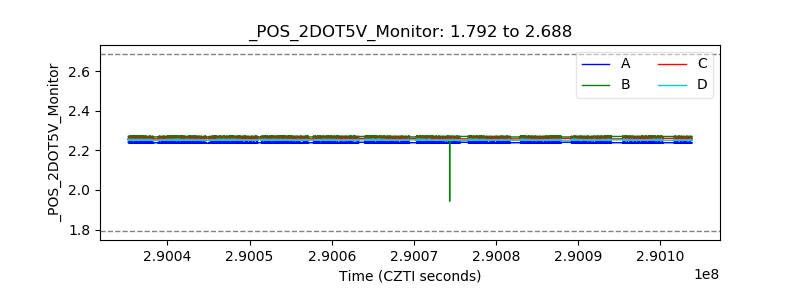 |
| +5 Volts monitor | 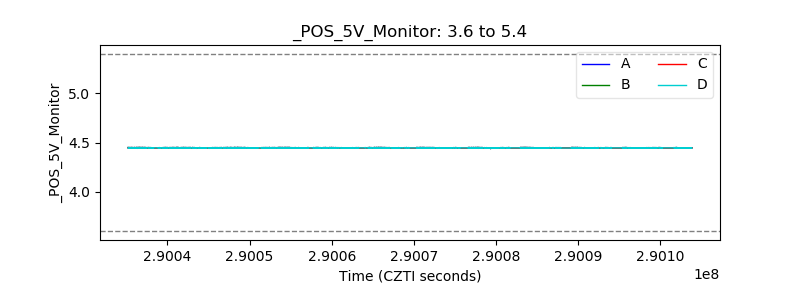 |
| _ROLL_ROT | 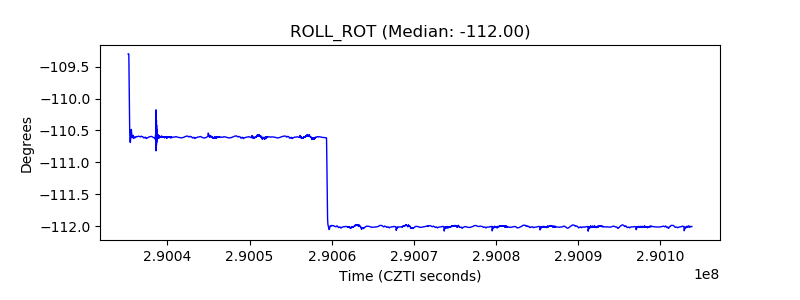 |
| _Roll_DEC |  |
| _Roll_RA | 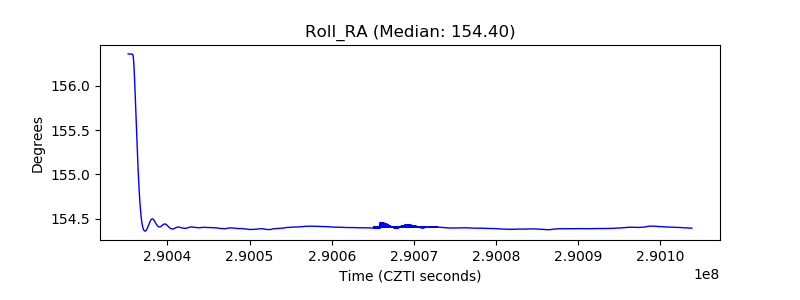 |
| Veto Counter | 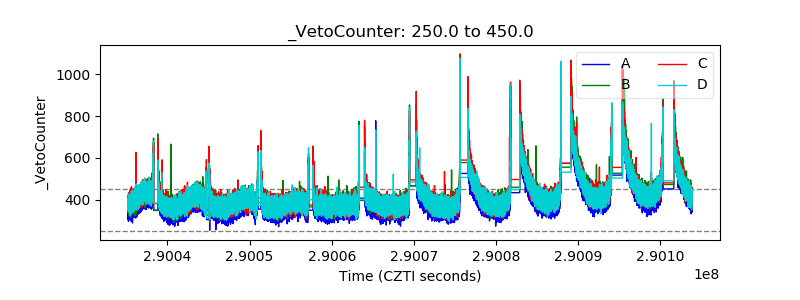 |