| Param | Original file | Final file |
|---|---|---|
| Filename | modeM0/AS1A06_005T01_9000002788_18661cztM0_level2.evt | modeM0/AS1A06_005T01_9000002788_18661cztM0_level2_quad_clean.evt |
| Size (bytes) | 487,298,880 | 53,809,920 |
| Size | 464.7 MB | 51.3 MB |
| Events in quadrant A | 2,635,800 | 351,014 |
| Events in quadrant B | 2,283,109 | 359,064 |
| Events in quadrant C | 2,392,537 | 343,585 |
| Events in quadrant D | 7,128,277 | 245,714 |
| Mode SS | |||
|---|---|---|---|
| Quadrant | BADHDUFLAG | Total packets | Discarded packets |
| A | 0 | 96 | 0 |
| B | 0 | 96 | 0 |
| C | 0 | 96 | 0 |
| D | 0 | 96 | 0 |
| Mode M9 | |||
|---|---|---|---|
| Quadrant | BADHDUFLAG | Total packets | Discarded packets |
| A | 0 | 5 | 0 |
| B | 0 | 5 | 0 |
| C | 0 | 5 | 0 |
| D | 0 | 5 | 0 |
| Mode M0 | |||
|---|---|---|---|
| Quadrant | BADHDUFLAG | Total packets | Discarded packets |
| A | 0 | 11080 | 1 |
| B | 0 | 9750 | 1 |
| C | 0 | 10011 | 1 |
| D | 0 | 24432 | 1 |
| Quadrant | Total seconds | Saturated seconds | Saturation percentage |
|---|---|---|---|
| A | 4684 | 37 | 0.789923% |
| B | 4683 | 43 | 0.918215% |
| C | 4683 | 76 | 1.622891% |
| D | 4683 | 1798 | 38.394192% |
Noise dominated data is calculated using 1-second bins in cleaned event files. If a bin has >2000 counts, and if more than 50% of those come from <1% of pixels, then it is considered to be noise-dominated and hence unusable.
| Quadrant | # 1 sec bins | Bins with >0 counts | Bins with >2000 counts | High rate bins dominated by noise | Noise dominated (total time) | Noise dominated (detector-on time) | Marked lightcurve |
|---|---|---|---|---|---|---|---|
| A | 5184 | 4685 | 1 | 1 | 0.02% | 0.02% | 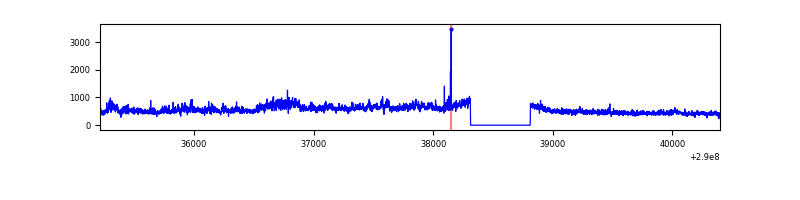 |
| B | 5183 | 4684 | 0 | 0 | 0.00% | 0.00% | 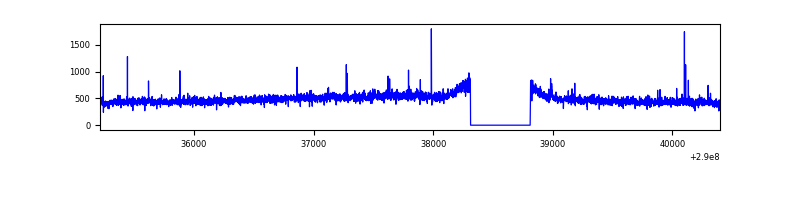 |
| C | 5183 | 4684 | 7 | 7 | 0.14% | 0.15% | 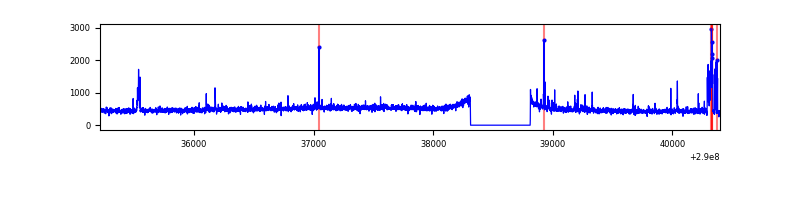 |
| D | 5183 | 4684 | 1619 | 1619 | 31.24% | 34.56% | 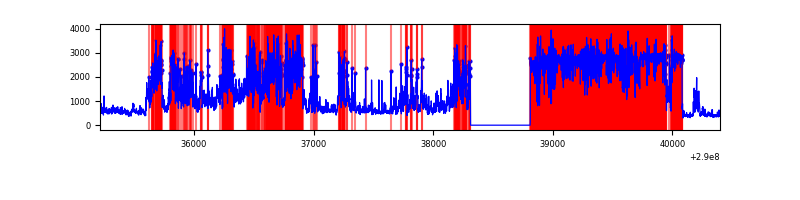 |
Top three noisy pixels from each quadrant. If the there are fewer than three noisy pixels in the level2.evt file, extra rows are filled as -1
| Pixel properties | Quadrant properties | ||||||
|---|---|---|---|---|---|---|---|
| Quadrant | DetID | PixID | Counts | Sigma | Mean | Median | Sigma |
| A | 15 | 192 | 383402 | 3306.8 | 574 | 562 | 115.8 |
| A | 0 | 13 | 29894 | 253.36 | 574 | 562 | 115.8 |
| A | 13 | 254 | 7529 | 60.18 | 574 | 562 | 115.8 |
| B | 12 | 111 | 13555 | 116.59 | 575 | 560 | 111.5 |
| B | 11 | 111 | 11577 | 98.85 | 575 | 560 | 111.5 |
| B | 14 | 111 | 10168 | 86.2 | 575 | 560 | 111.5 |
| C | 9 | 221 | 117639 | 895.8 | 552 | 556 | 130.7 |
| C | 14 | 238 | 86251 | 655.65 | 552 | 556 | 130.7 |
| C | 9 | 54 | 23631 | 176.55 | 552 | 556 | 130.7 |
| D | 7 | 238 | 5022019 | 43980.34 | 468 | 453 | 114.2 |
| D | 1 | 52 | 266856 | 2333.24 | 468 | 453 | 114.2 |
| D | 12 | 225 | 32696 | 282.39 | 468 | 453 | 114.2 |
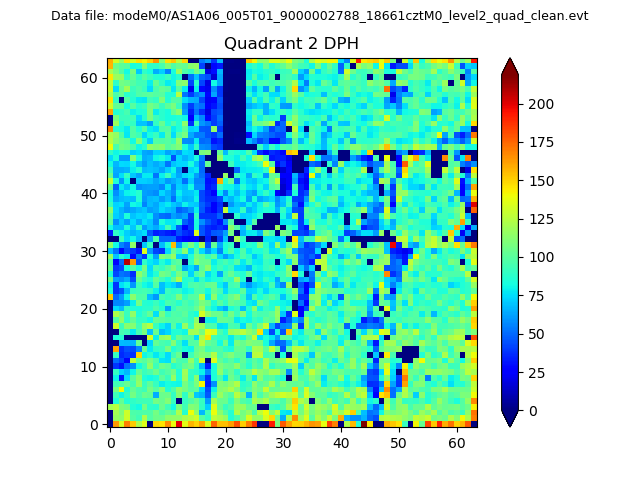
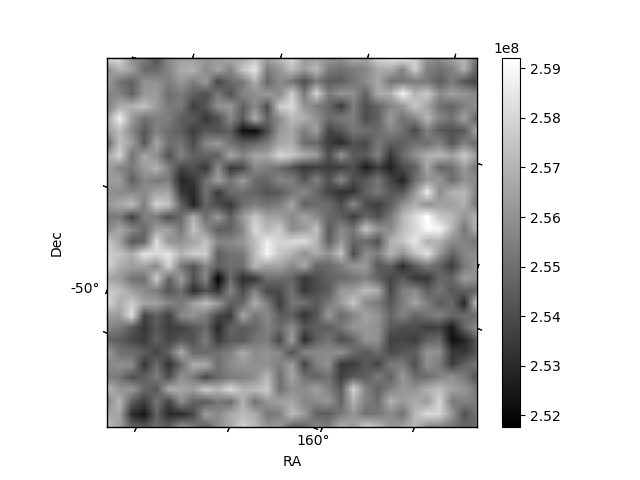
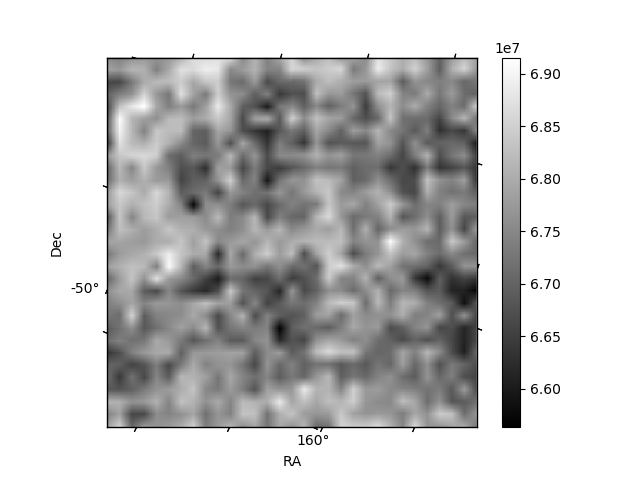
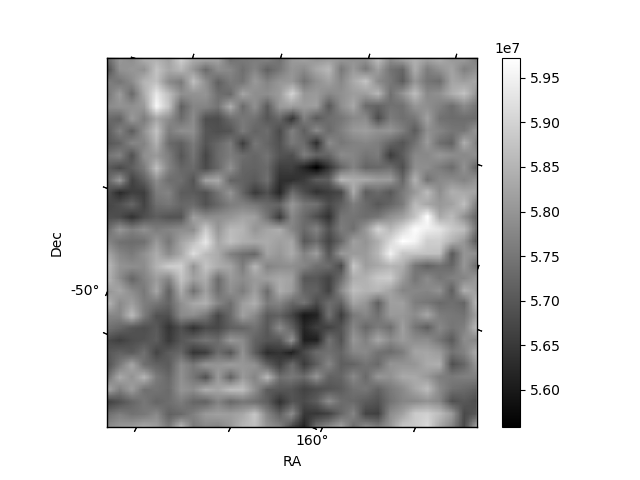
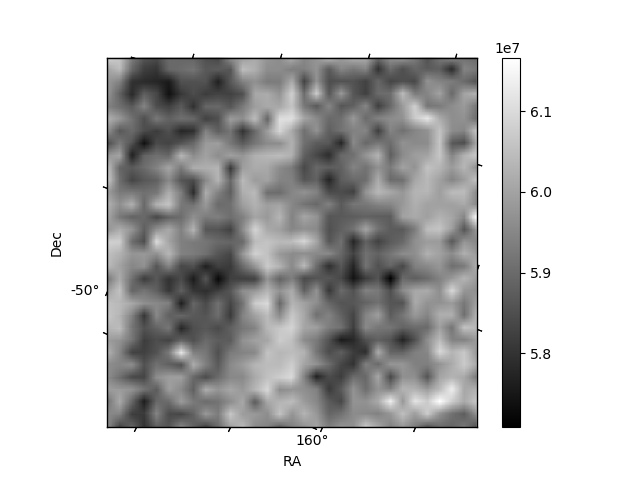
Histogram calculated using DETX and DETY for each event in the final _common_clean file
| Quadrant A | 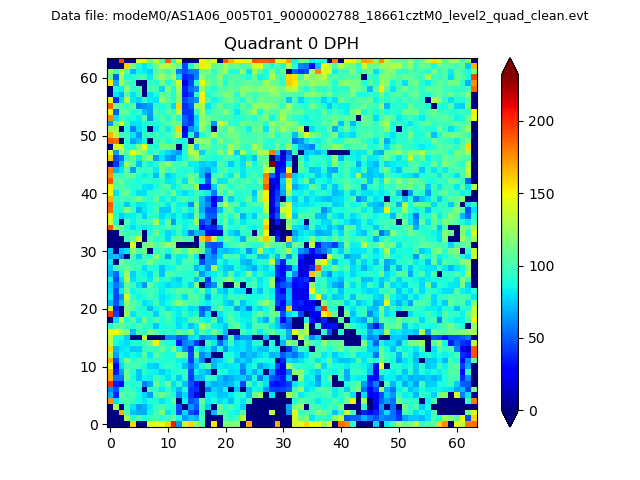 |
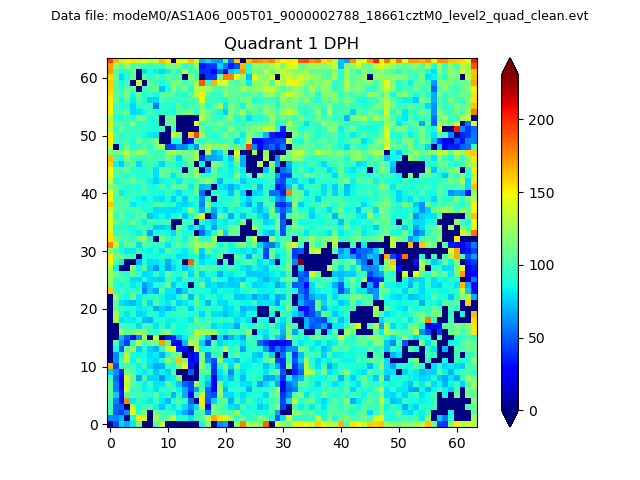 |
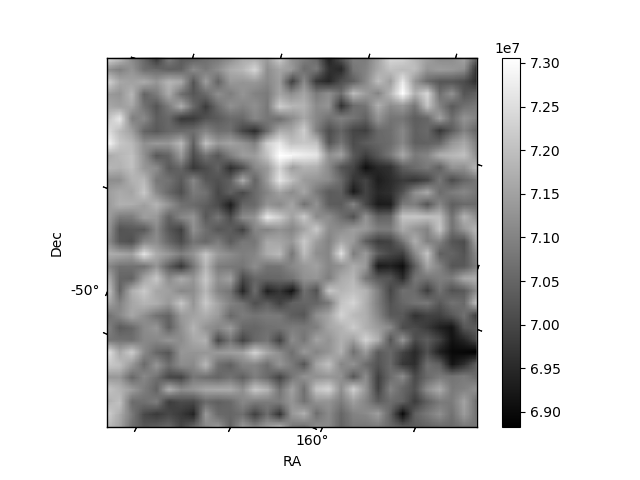
Quadrant B |
|---|---|---|---|
| Quadrant D | 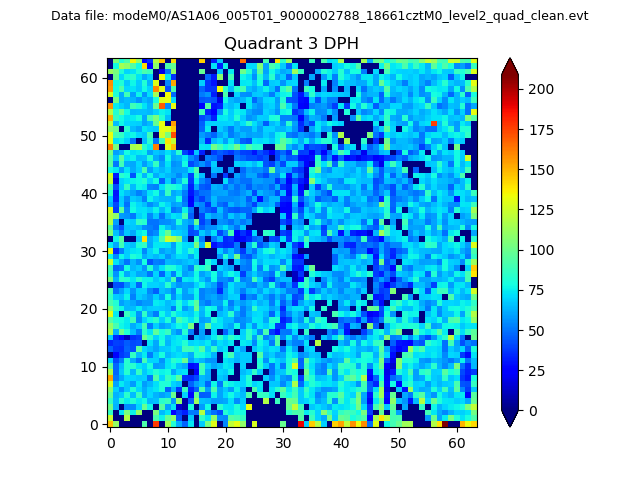 |
 |
Quadrant C |
| Plot type | Count rate plots | Images |
|---|---|---|
| Comparison with Poisson distribution Blue bars denote a histogram of data divided into 1 sec bins. Red curve is a Poisson curve with rate = median count rate of data. |
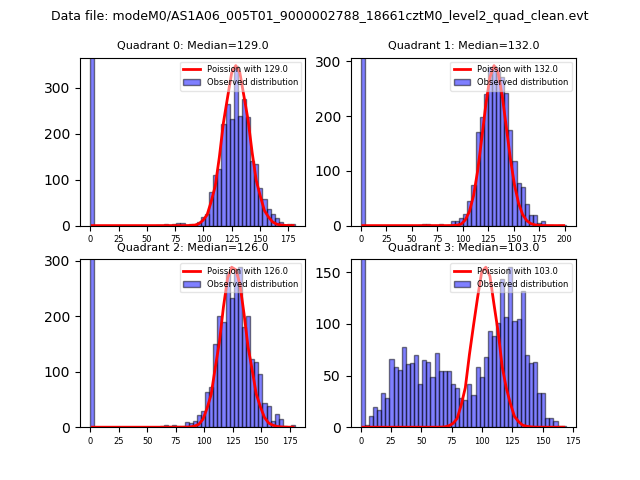 |
 |
| Quadrant-wise count rates Data is divided into 100 sec bins |
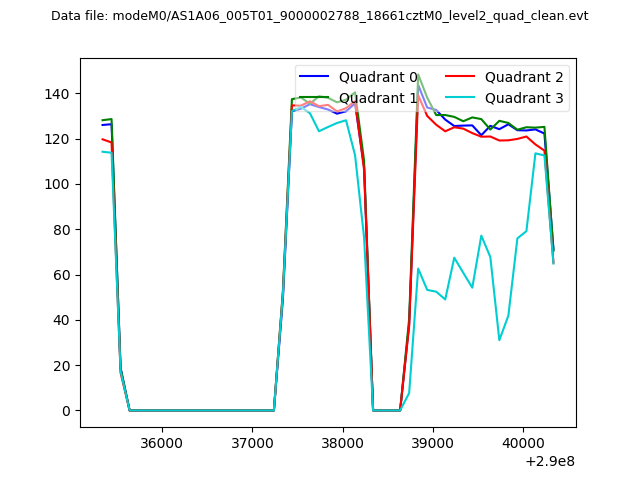 |
|
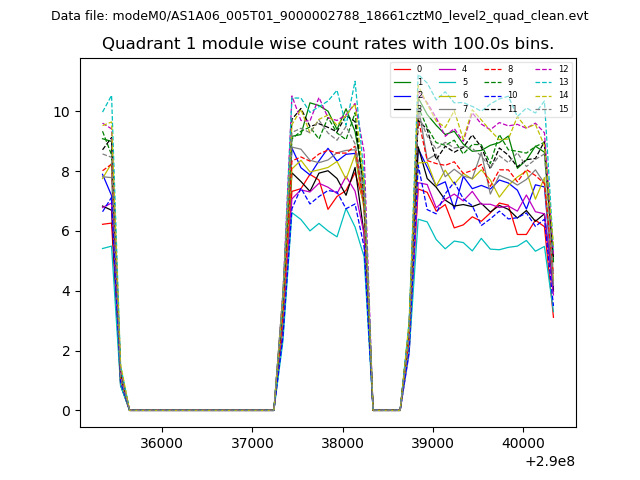
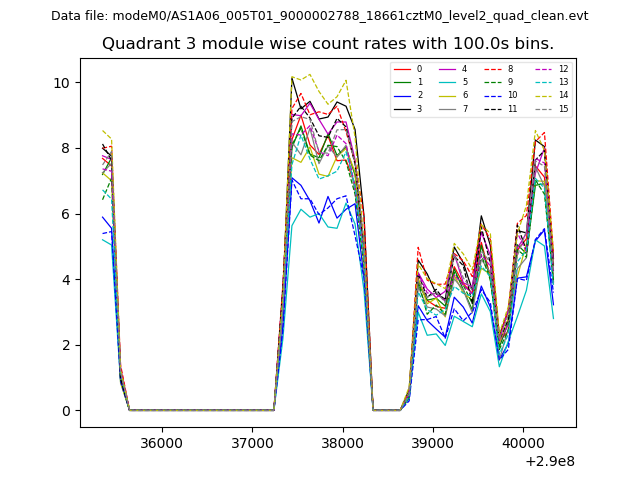
| Module-wise count rates for Quadrant A Data is divided into 100 sec bins |
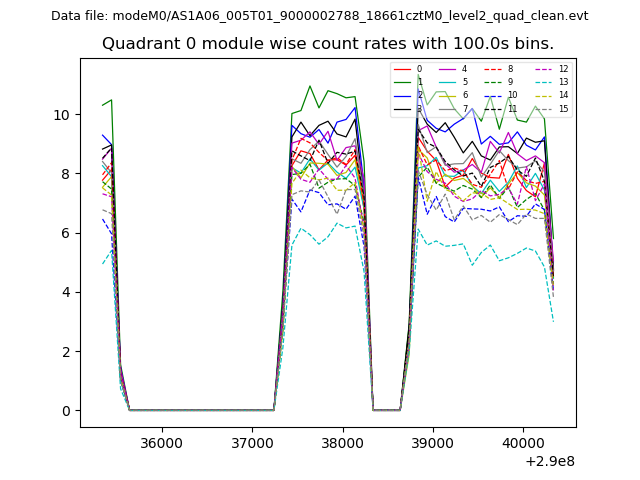 |
 |
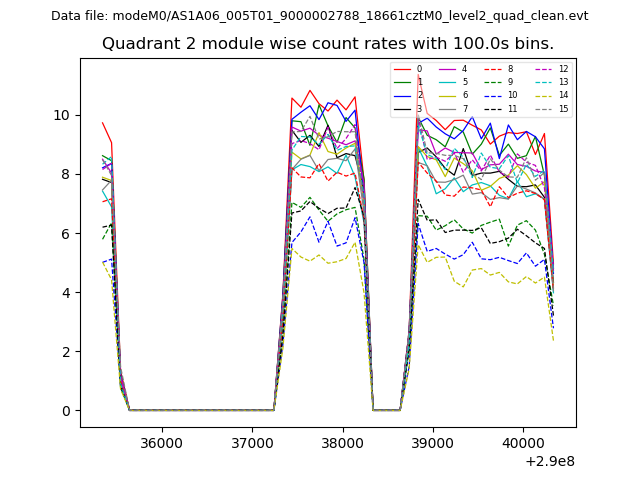
| Module-wise count rates for Quadrant B Data is divided into 100 sec bins |
 |
 |
| Module-wise count rates for Quadrant C Data is divided into 100 sec bins |
 |
 |
| Module-wise count rates for Quadrant D Data is divided into 100 sec bins |
 |
 |
| Parameter | Plot |
|---|---|
| CZT HV Monitor | 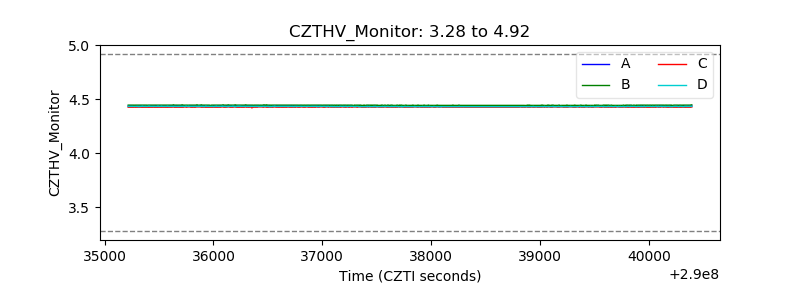 |
| D_VDD | 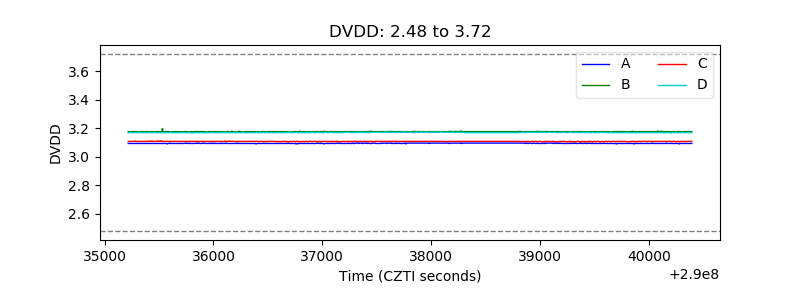 |
| Temperature 1 | 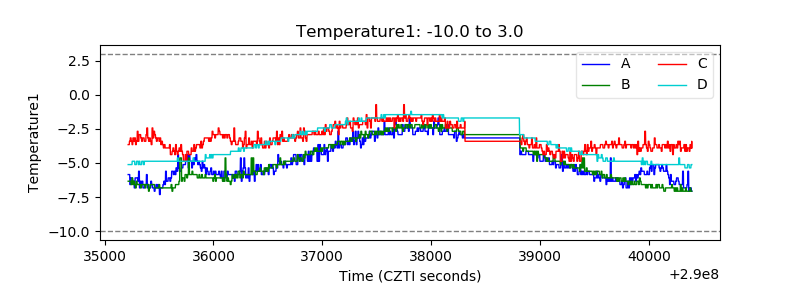 |
| Veto HV Monitor | 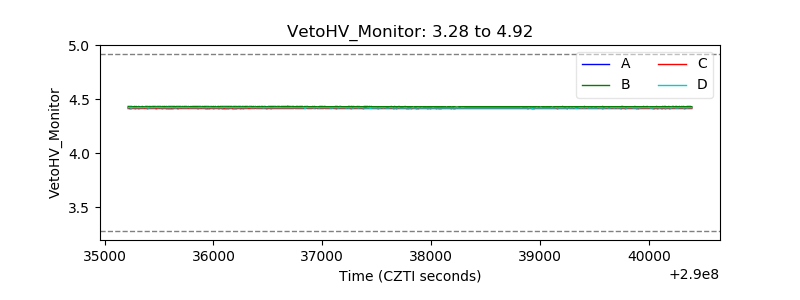 |
| Veto LLD | 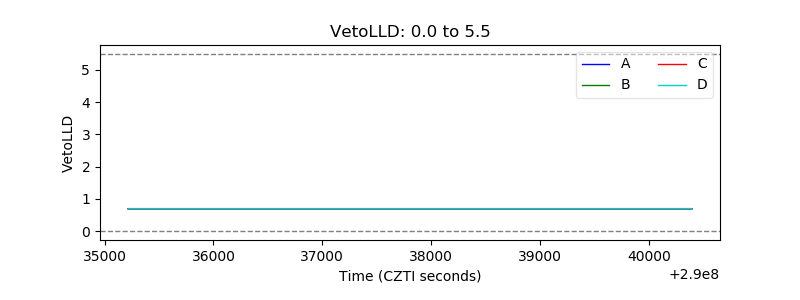 |
| Alpha Counter | 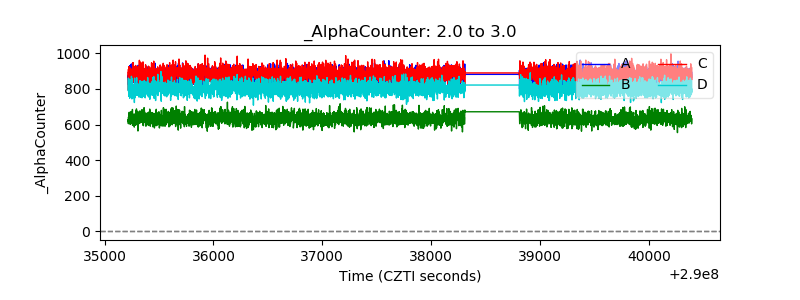 |
| _CPM_Rate | 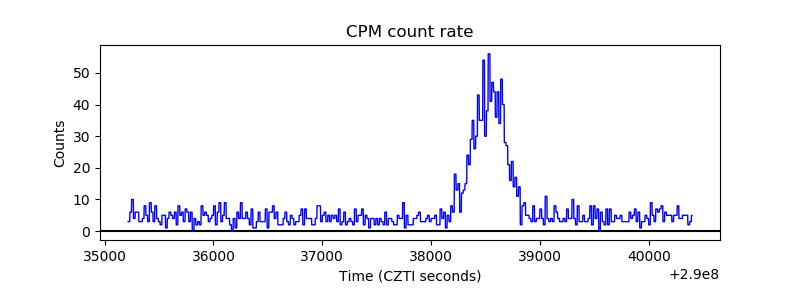 |
| CZT Counter | 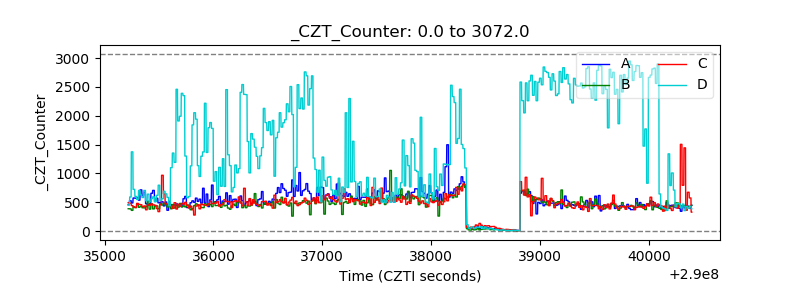 |
| +2.5 Volts monitor |  |
| +5 Volts monitor |  |
| _ROLL_ROT | 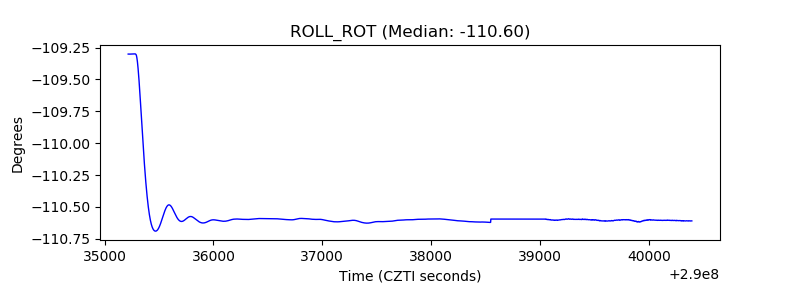 |
| _Roll_DEC | 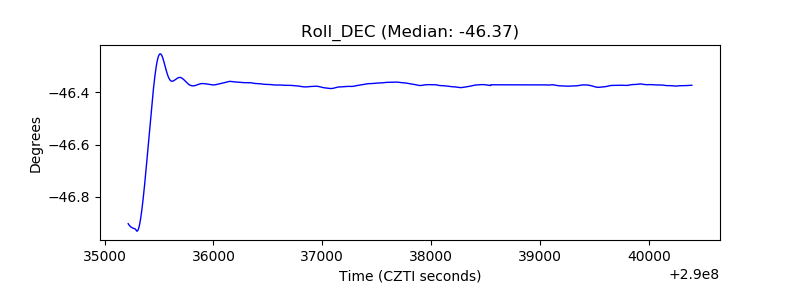 |
| _Roll_RA | 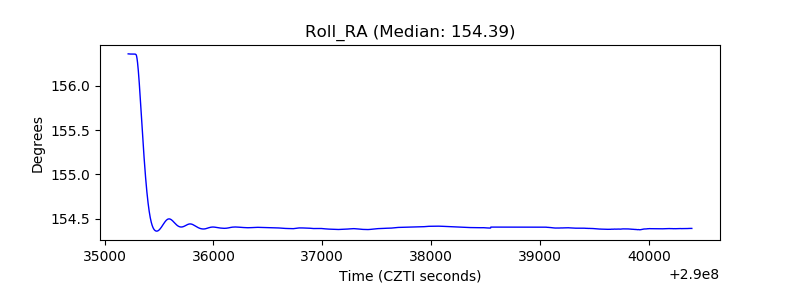 |
| Veto Counter | 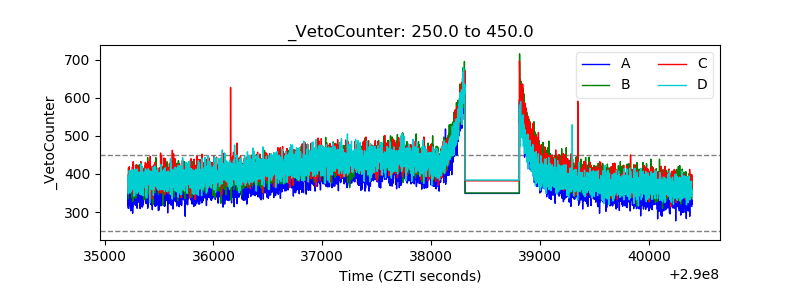 |