| Param | Original file | Final file |
|---|---|---|
| Filename | modeM0/AS1A06_005T01_9000002788_18662cztM0_level2.evt | modeM0/AS1A06_005T01_9000002788_18662cztM0_level2_quad_clean.evt |
| Size (bytes) | 738,480,960 | 107,769,600 |
| Size | 704.3 MB | 102.8 MB |
| Events in quadrant A | 3,751,011 | 741,981 |
| Events in quadrant B | 3,684,609 | 754,206 |
| Events in quadrant C | 3,767,549 | 719,104 |
| Events in quadrant D | 10,640,985 | 512,669 |
| Mode SS | |||
|---|---|---|---|
| Quadrant | BADHDUFLAG | Total packets | Discarded packets |
| A | 0 | 158 | 0 |
| B | 0 | 158 | 0 |
| C | 0 | 158 | 0 |
| D | 0 | 158 | 0 |
| Mode M9 | |||
|---|---|---|---|
| Quadrant | BADHDUFLAG | Total packets | Discarded packets |
| A | 0 | 8 | 0 |
| B | 0 | 8 | 0 |
| C | 0 | 8 | 0 |
| D | 0 | 8 | 0 |
| Mode M0 | |||
|---|---|---|---|
| Quadrant | BADHDUFLAG | Total packets | Discarded packets |
| A | 0 | 16210 | 3 |
| B | 0 | 16016 | 3 |
| C | 0 | 16264 | 3 |
| D | 0 | 36917 | 3 |
| Quadrant | Total seconds | Saturated seconds | Saturation percentage |
|---|---|---|---|
| A | 7687 | 64 | 0.832574% |
| B | 7688 | 79 | 1.027575% |
| C | 7688 | 113 | 1.469823% |
| D | 7688 | 2935 | 38.176379% |
Noise dominated data is calculated using 1-second bins in cleaned event files. If a bin has >2000 counts, and if more than 50% of those come from <1% of pixels, then it is considered to be noise-dominated and hence unusable.
| Quadrant | # 1 sec bins | Bins with >0 counts | Bins with >2000 counts | High rate bins dominated by noise | Noise dominated (total time) | Noise dominated (detector-on time) | Marked lightcurve |
|---|---|---|---|---|---|---|---|
| A | 8497 | 7690 | 7 | 7 | 0.08% | 0.09% | 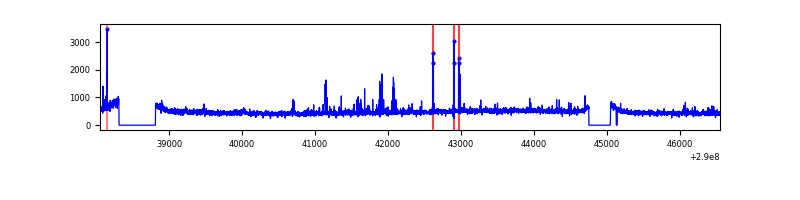 |
| B | 8498 | 7691 | 5 | 5 | 0.06% | 0.07% | 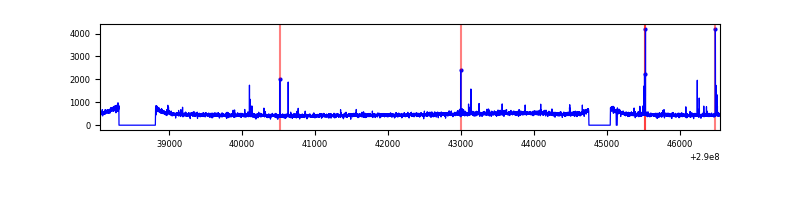 |
| C | 8498 | 7691 | 10 | 10 | 0.12% | 0.13% | 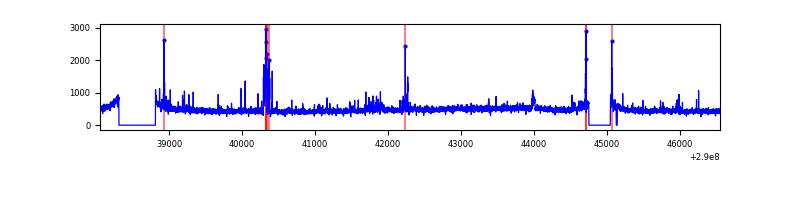 |
| D | 8497 | 7688 | 2698 | 2698 | 31.75% | 35.09% | 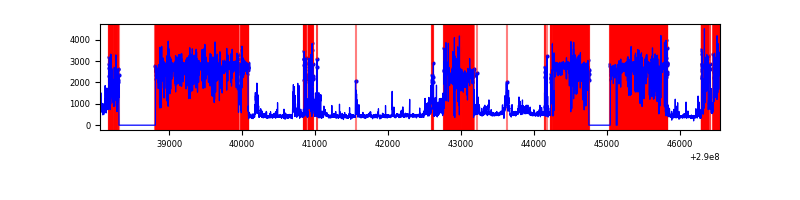 |
Top three noisy pixels from each quadrant. If the there are fewer than three noisy pixels in the level2.evt file, extra rows are filled as -1
| Pixel properties | Quadrant properties | ||||||
|---|---|---|---|---|---|---|---|
| Quadrant | DetID | PixID | Counts | Sigma | Mean | Median | Sigma |
| A | 15 | 192 | 157283 | 848.62 | 915 | 896 | 184.3 |
| A | 0 | 13 | 26732 | 140.2 | 915 | 896 | 184.3 |
| A | 6 | 16 | 25593 | 134.02 | 915 | 896 | 184.3 |
| B | 4 | 80 | 60082 | 338.17 | 918 | 895 | 175.0 |
| B | 12 | 111 | 21681 | 118.76 | 918 | 895 | 175.0 |
| B | 11 | 111 | 18538 | 100.81 | 918 | 895 | 175.0 |
| C | 9 | 221 | 147408 | 709.83 | 877 | 883 | 206.4 |
| C | 14 | 238 | 138070 | 664.6 | 877 | 883 | 206.4 |
| C | 3 | 233 | 38693 | 183.17 | 877 | 883 | 206.4 |
| D | 7 | 238 | 7896779 | 47255.23 | 689 | 669 | 167.1 |
| D | 12 | 110 | 96840 | 575.55 | 689 | 669 | 167.1 |
| D | 2 | 234 | 26496 | 154.56 | 689 | 669 | 167.1 |
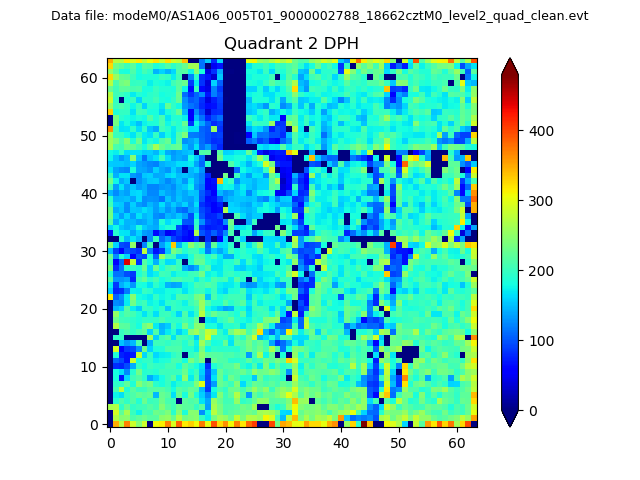
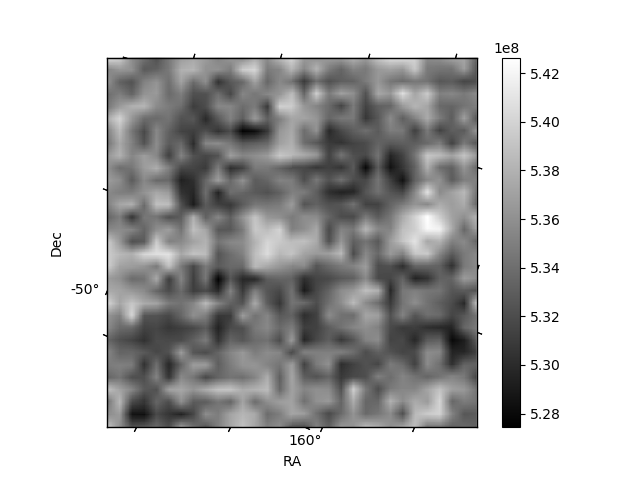
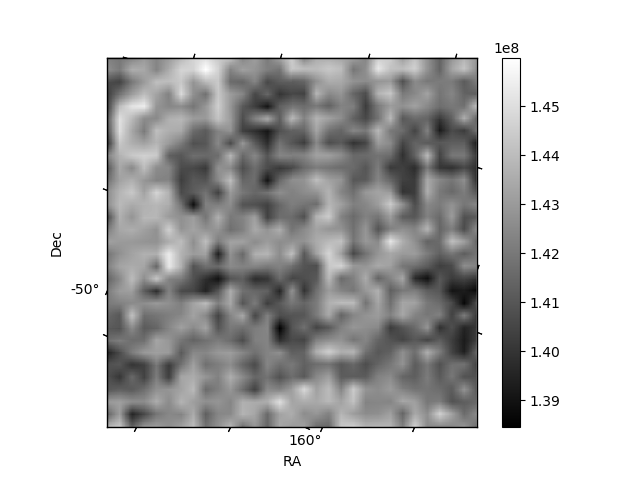
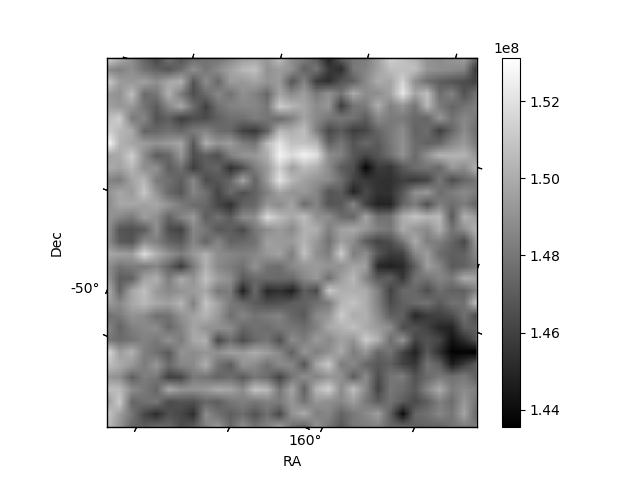
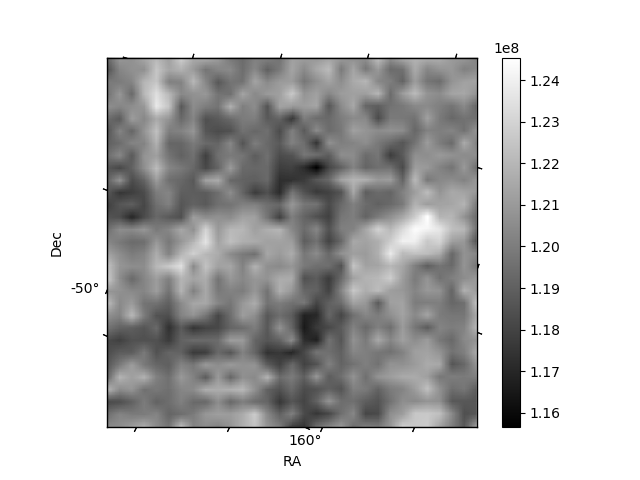
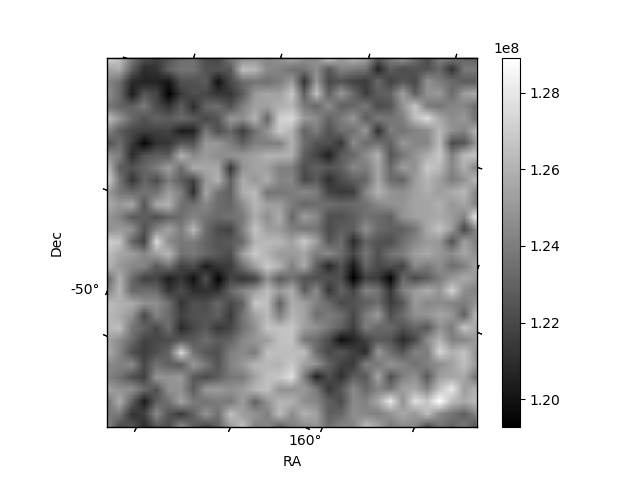
Histogram calculated using DETX and DETY for each event in the final _common_clean file
| Quadrant A | 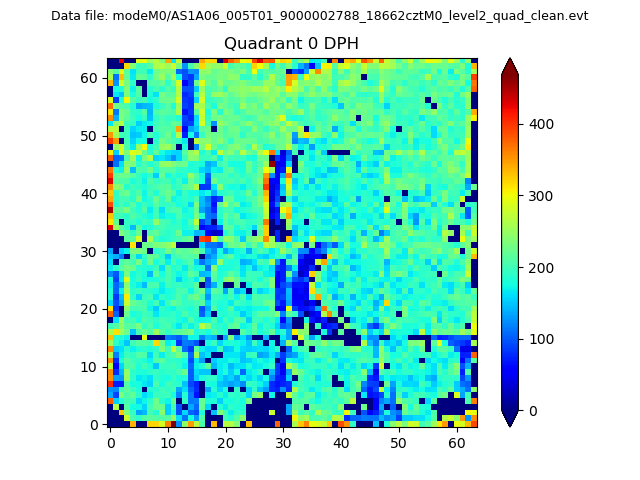 |
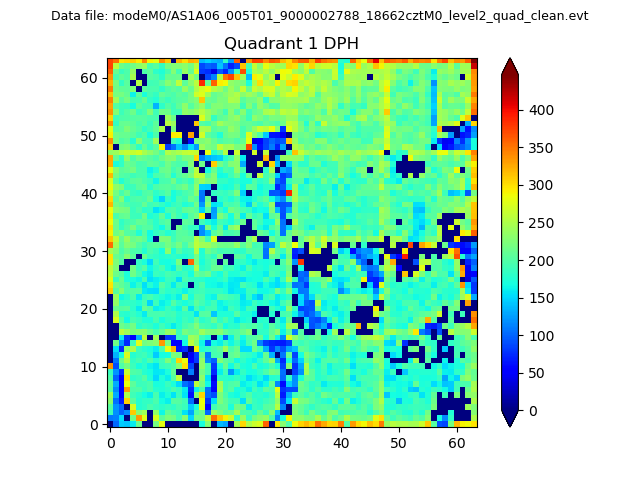 |
Quadrant B |
|---|---|---|---|
| Quadrant D | 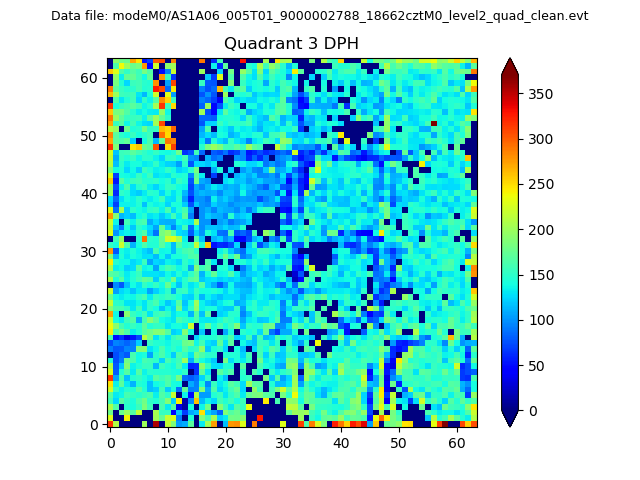 |
 |
Quadrant C |
| Plot type | Count rate plots | Images |
|---|---|---|
| Comparison with Poisson distribution Blue bars denote a histogram of data divided into 1 sec bins. Red curve is a Poisson curve with rate = median count rate of data. |
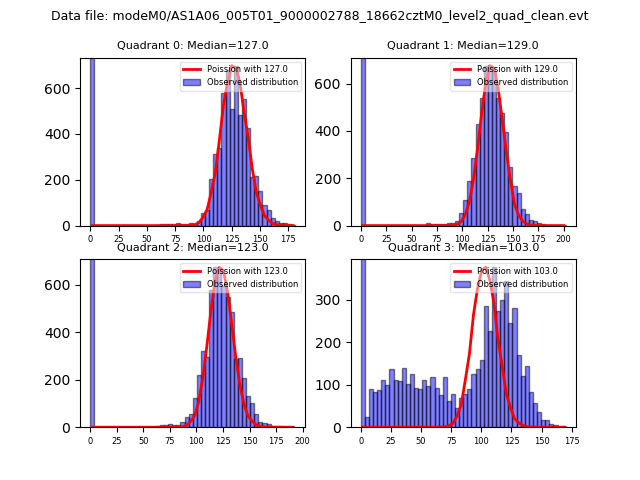 |
 |
| Quadrant-wise count rates Data is divided into 100 sec bins |
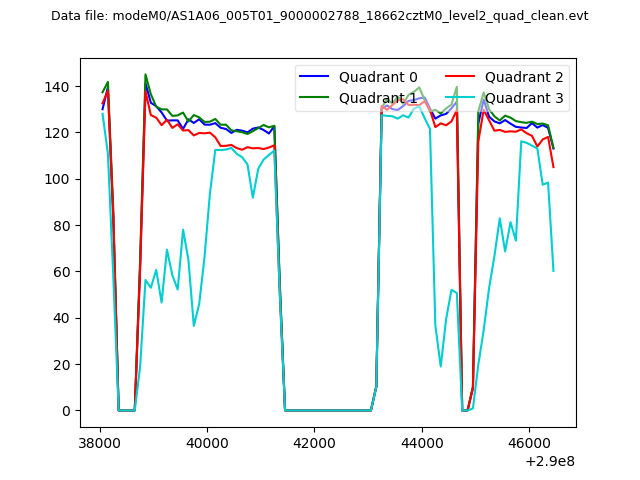 |
|
| Module-wise count rates for Quadrant A Data is divided into 100 sec bins |
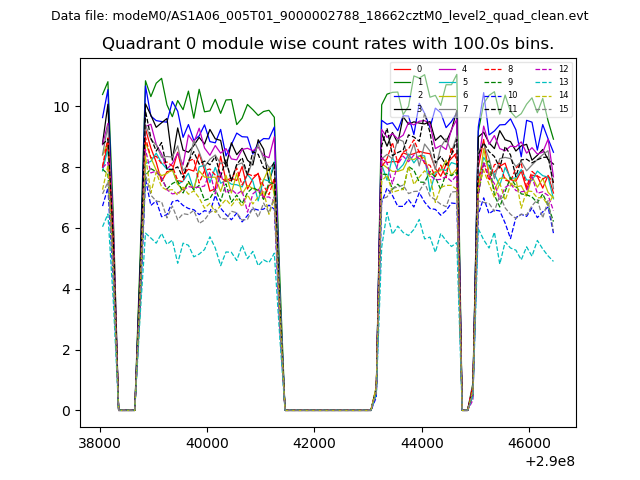 |
 |
| Module-wise count rates for Quadrant B Data is divided into 100 sec bins |
 |
 |
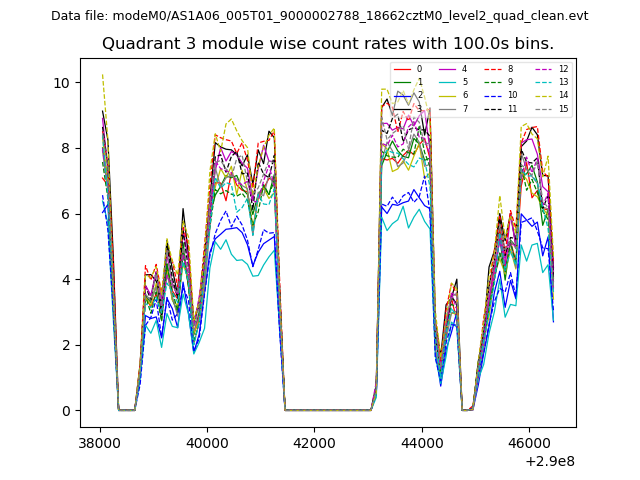
| Module-wise count rates for Quadrant C Data is divided into 100 sec bins |
 |
 |
| Module-wise count rates for Quadrant D Data is divided into 100 sec bins |
 |
 |
| Parameter | Plot |
|---|---|
| CZT HV Monitor | 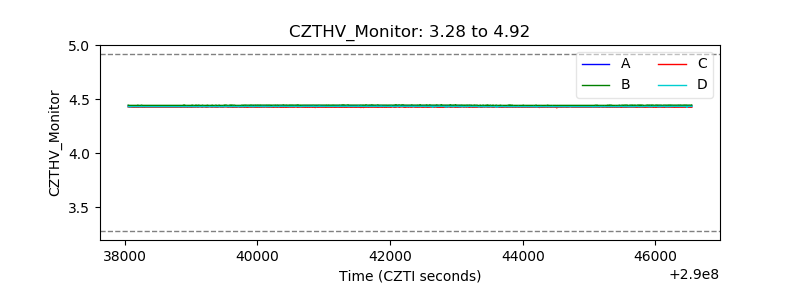 |
| D_VDD | 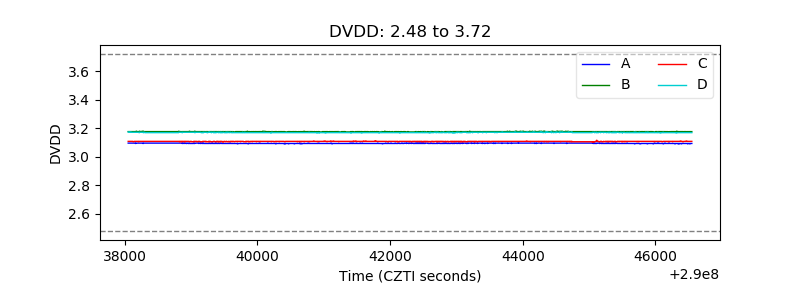 |
| Temperature 1 | 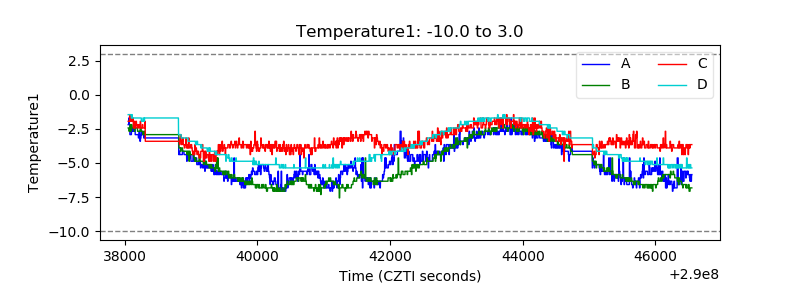 |
| Veto HV Monitor | 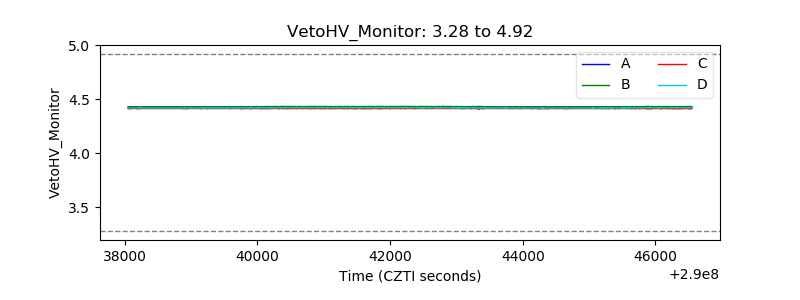 |
| Veto LLD | 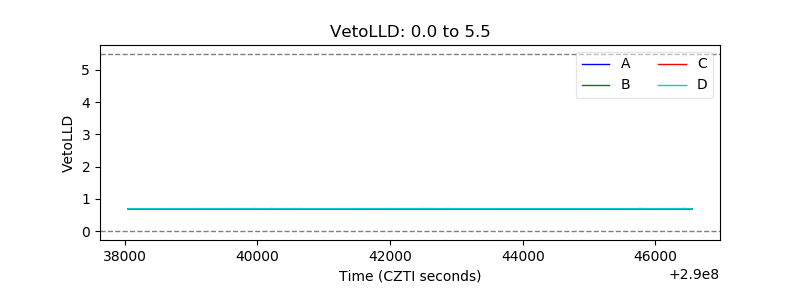 |
| Alpha Counter | 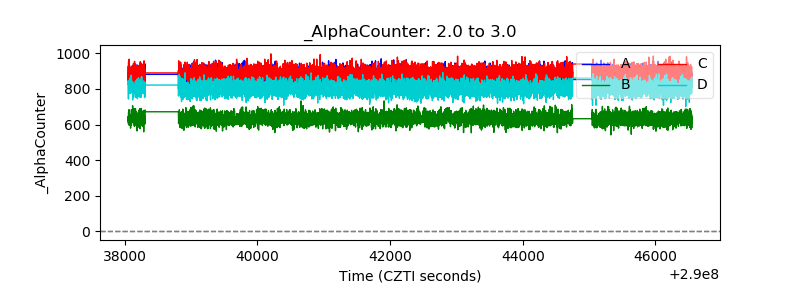 |
| _CPM_Rate | 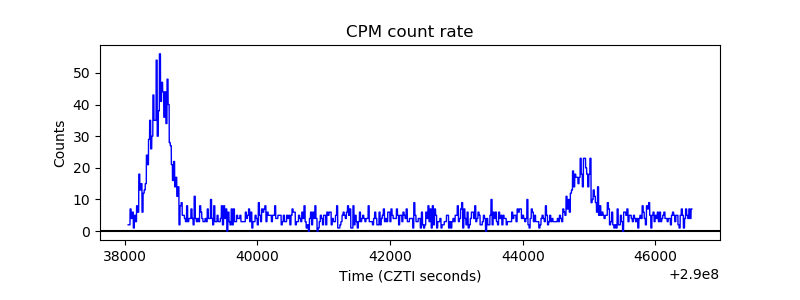 |
| CZT Counter | 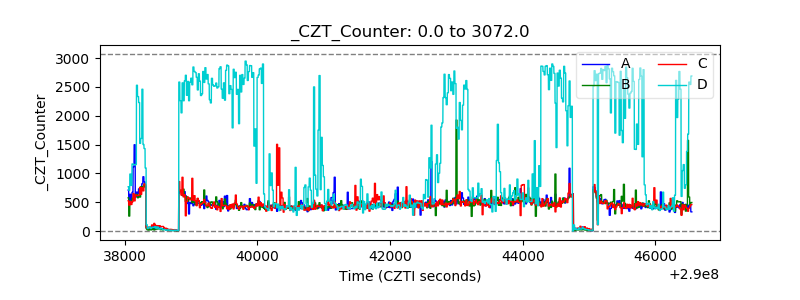 |
| +2.5 Volts monitor | 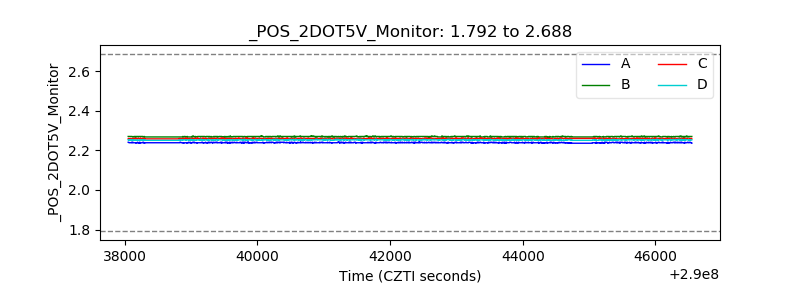 |
| +5 Volts monitor | 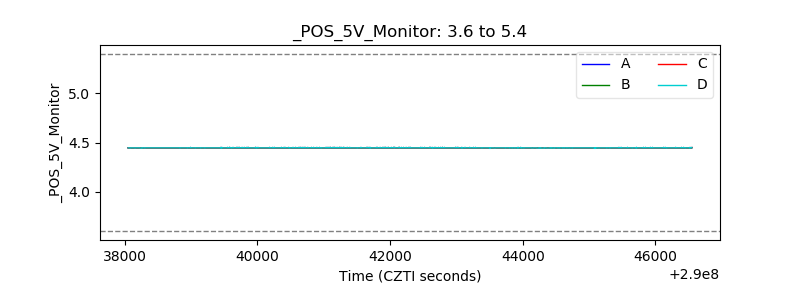 |
| _ROLL_ROT | 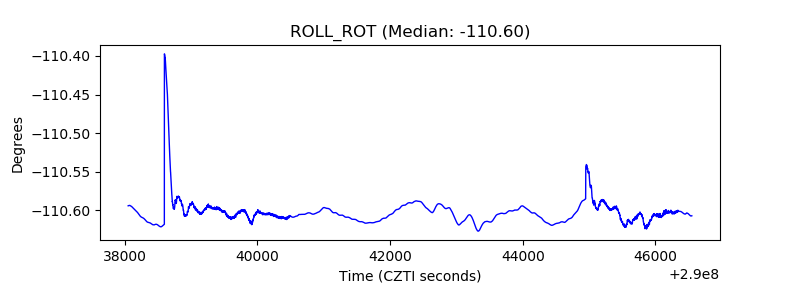 |
| _Roll_DEC | 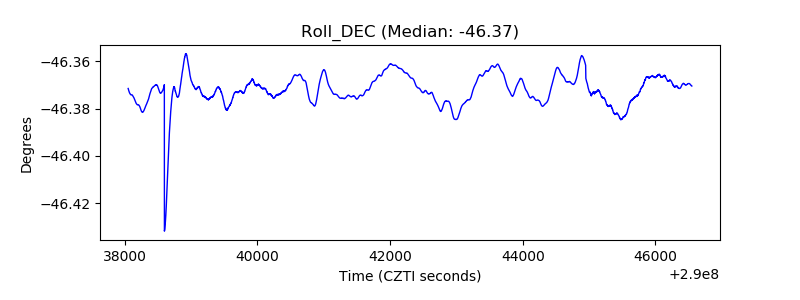 |
| _Roll_RA | 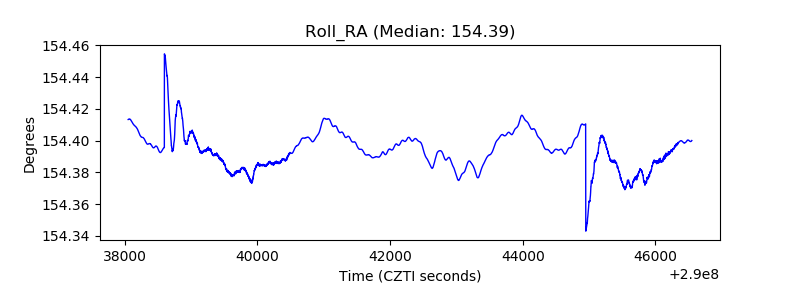 |
| Veto Counter | 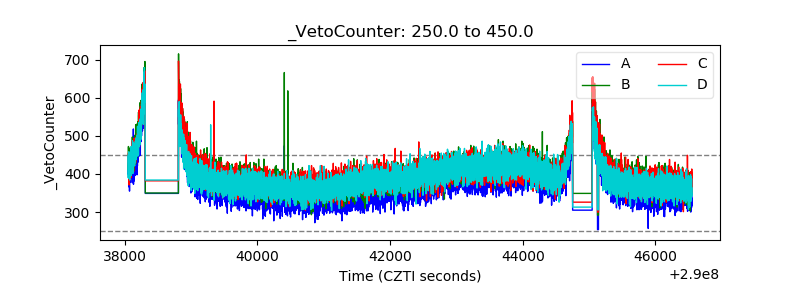 |