| Param | Original file | Final file |
|---|---|---|
| Filename | modeM0/AS1A06_005T01_9000002788_18663cztM0_level2.evt | modeM0/AS1A06_005T01_9000002788_18663cztM0_level2_quad_clean.evt |
| Size (bytes) | 876,896,640 | 112,826,880 |
| Size | 836.3 MB | 107.6 MB |
| Events in quadrant A | 3,876,311 | 808,982 |
| Events in quadrant B | 3,952,394 | 822,924 |
| Events in quadrant C | 4,024,211 | 778,825 |
| Events in quadrant D | 14,145,048 | 430,207 |
| Mode SS | |||
|---|---|---|---|
| Quadrant | BADHDUFLAG | Total packets | Discarded packets |
| A | 0 | 170 | 0 |
| B | 0 | 170 | 0 |
| C | 0 | 170 | 0 |
| D | 0 | 170 | 0 |
| Mode M9 | |||
|---|---|---|---|
| Quadrant | BADHDUFLAG | Total packets | Discarded packets |
| A | 0 | 6 | 0 |
| B | 0 | 6 | 0 |
| C | 0 | 6 | 0 |
| D | 0 | 6 | 0 |
| Mode M0 | |||
|---|---|---|---|
| Quadrant | BADHDUFLAG | Total packets | Discarded packets |
| A | 0 | 17002 | 3 |
| B | 0 | 17137 | 3 |
| C | 0 | 17346 | 3 |
| D | 0 | 47753 | 3 |
| Quadrant | Total seconds | Saturated seconds | Saturation percentage |
|---|---|---|---|
| A | 8258 | 57 | 0.690240% |
| B | 8259 | 123 | 1.489284% |
| C | 8259 | 144 | 1.743552% |
| D | 8259 | 4146 | 50.199782% |
Noise dominated data is calculated using 1-second bins in cleaned event files. If a bin has >2000 counts, and if more than 50% of those come from <1% of pixels, then it is considered to be noise-dominated and hence unusable.
| Quadrant | # 1 sec bins | Bins with >0 counts | Bins with >2000 counts | High rate bins dominated by noise | Noise dominated (total time) | Noise dominated (detector-on time) | Marked lightcurve |
|---|---|---|---|---|---|---|---|
| A | 8893 | 8261 | 0 | 0 | 0.00% | 0.00% | 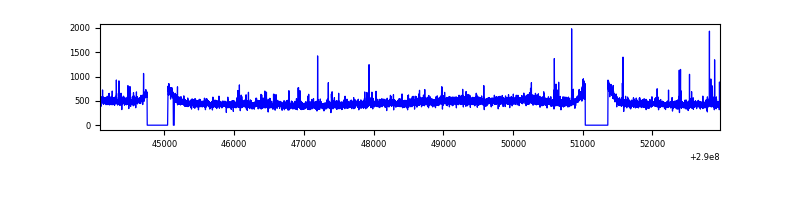 |
| B | 8894 | 8262 | 7 | 7 | 0.08% | 0.08% | 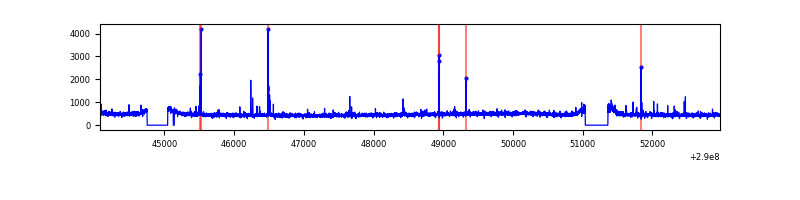 |
| C | 8894 | 8261 | 3 | 3 | 0.03% | 0.04% | 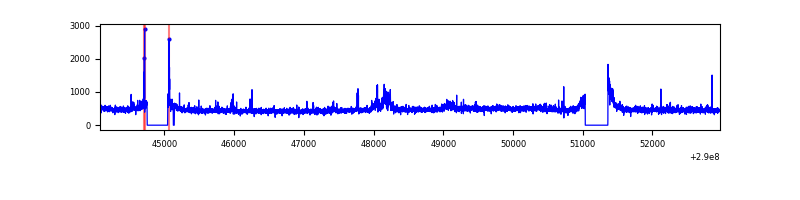 |
| D | 8893 | 8258 | 3915 | 3915 | 44.02% | 47.41% | 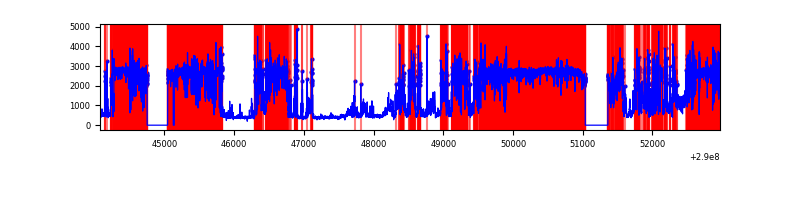 |
Top three noisy pixels from each quadrant. If the there are fewer than three noisy pixels in the level2.evt file, extra rows are filled as -1
| Pixel properties | Quadrant properties | ||||||
|---|---|---|---|---|---|---|---|
| Quadrant | DetID | PixID | Counts | Sigma | Mean | Median | Sigma |
| A | 15 | 192 | 66396 | 329.5 | 979 | 958 | 198.6 |
| A | 6 | 16 | 30142 | 146.95 | 979 | 958 | 198.6 |
| A | 13 | 254 | 13071 | 60.99 | 979 | 958 | 198.6 |
| B | 4 | 80 | 64505 | 341.05 | 980 | 954 | 186.3 |
| B | 12 | 111 | 22850 | 117.51 | 980 | 954 | 186.3 |
| B | 0 | 189 | 21204 | 108.67 | 980 | 954 | 186.3 |
| C | 3 | 233 | 199182 | 904.36 | 936 | 941 | 219.2 |
| C | 14 | 238 | 144667 | 655.67 | 936 | 941 | 219.2 |
| C | 9 | 221 | 25536 | 112.2 | 936 | 941 | 219.2 |
| D | 7 | 238 | 11513640 | 72723.4 | 654 | 634 | 158.3 |
| D | 1 | 52 | 135212 | 850.08 | 654 | 634 | 158.3 |
| D | 2 | 234 | 24453 | 150.46 | 654 | 634 | 158.3 |
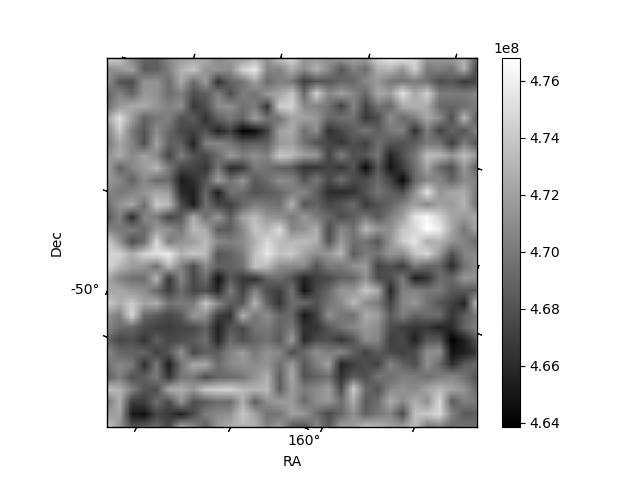
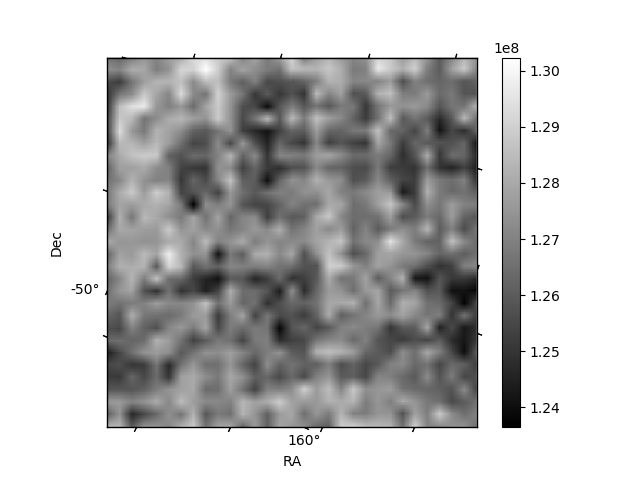
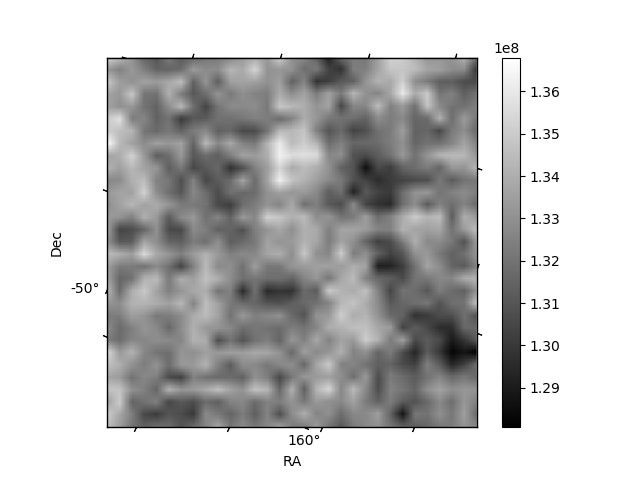
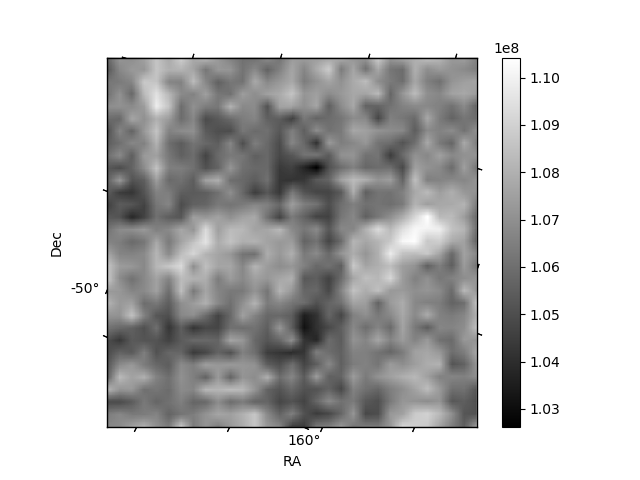
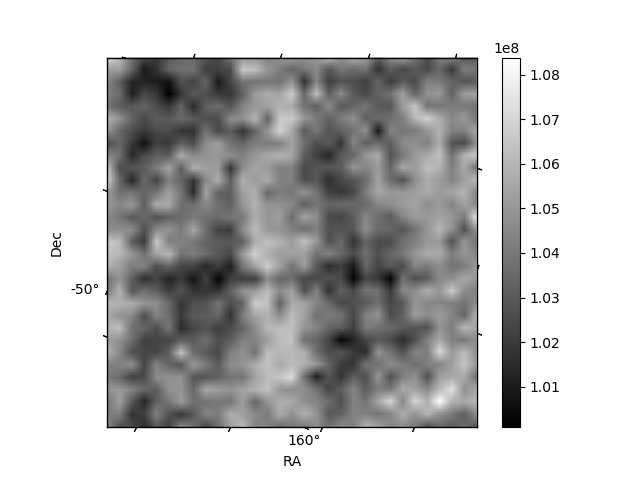
Histogram calculated using DETX and DETY for each event in the final _common_clean file
| Quadrant A | 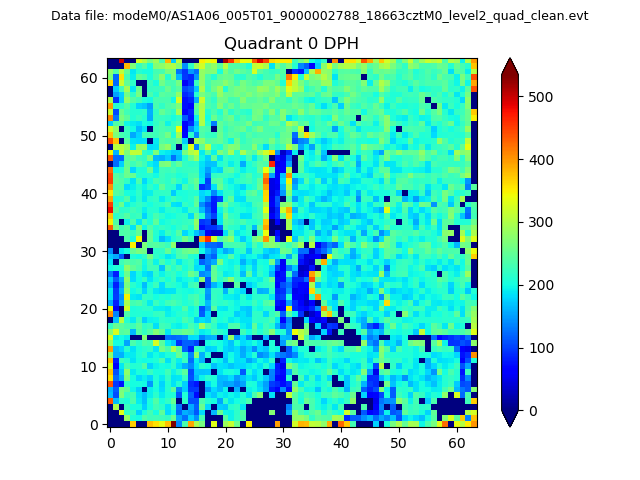 |
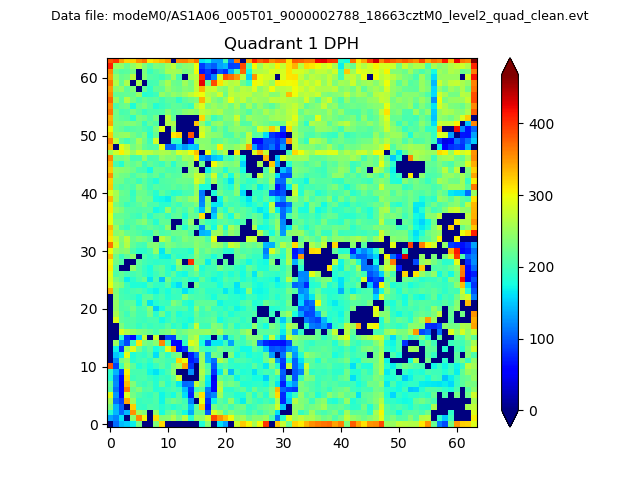 |
Quadrant B |
|---|---|---|---|
| Quadrant D | 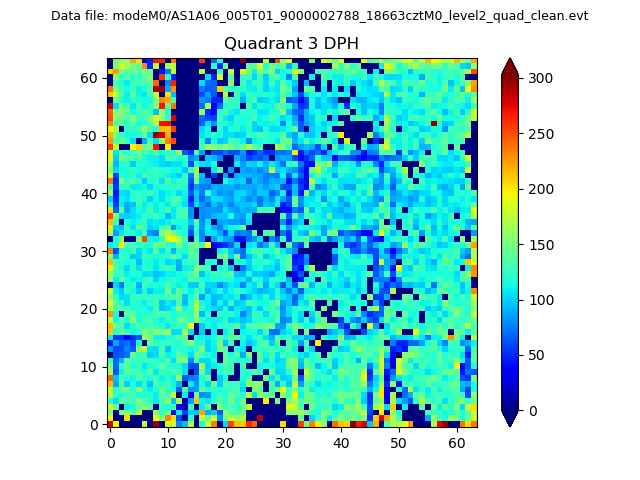 |
 |
Quadrant C |
| Plot type | Count rate plots | Images |
|---|---|---|
| Comparison with Poisson distribution Blue bars denote a histogram of data divided into 1 sec bins. Red curve is a Poisson curve with rate = median count rate of data. |
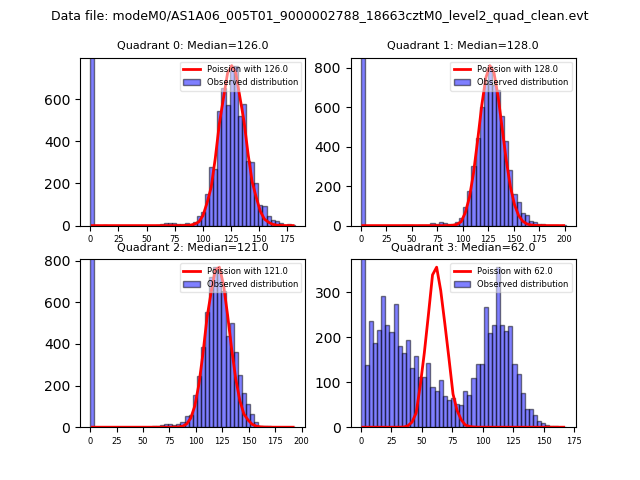 |
 |
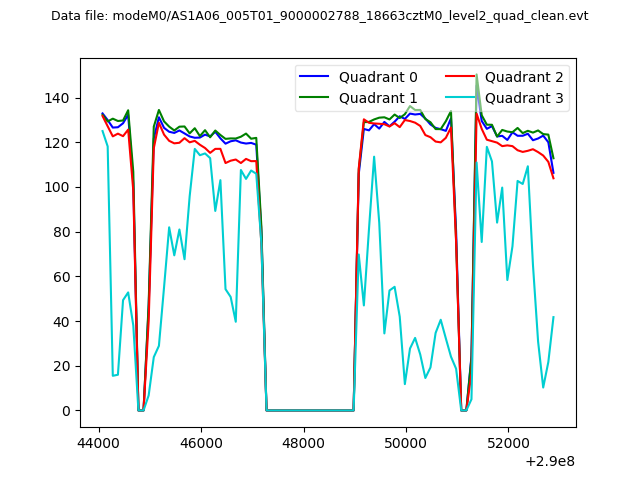
| Quadrant-wise count rates Data is divided into 100 sec bins |
 |
|
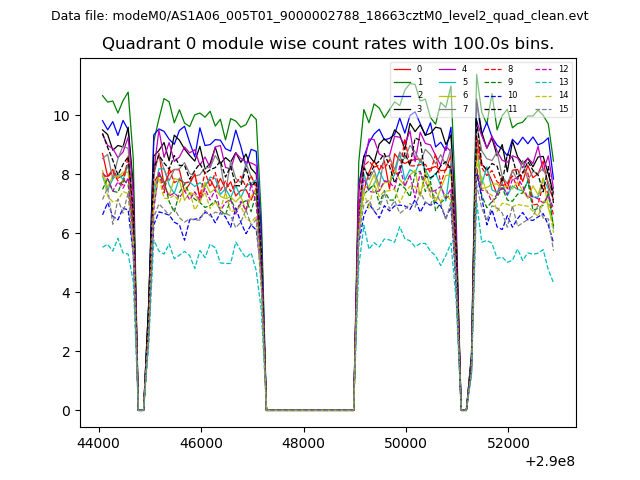
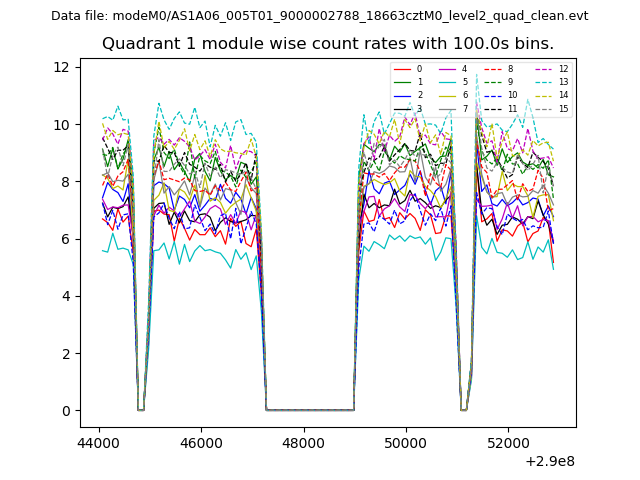
| Module-wise count rates for Quadrant A Data is divided into 100 sec bins |
 |
 |
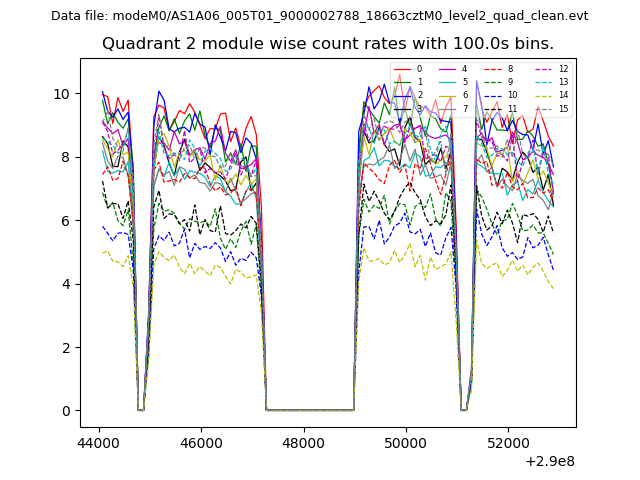
| Module-wise count rates for Quadrant B Data is divided into 100 sec bins |
 |
 |
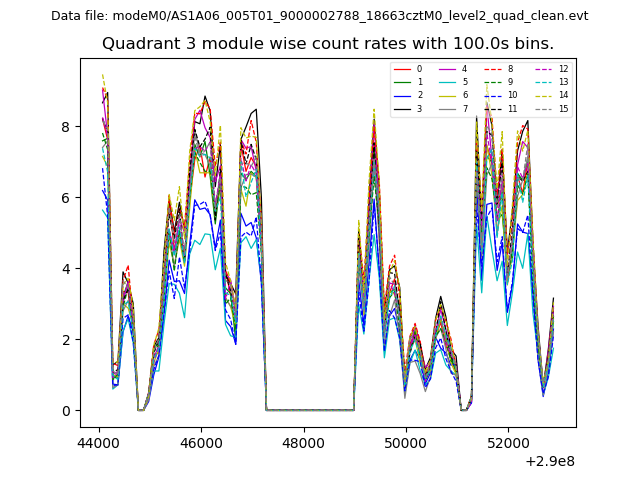
| Module-wise count rates for Quadrant C Data is divided into 100 sec bins |
 |
 |
| Module-wise count rates for Quadrant D Data is divided into 100 sec bins |
 |
 |
| Parameter | Plot |
|---|---|
| CZT HV Monitor | 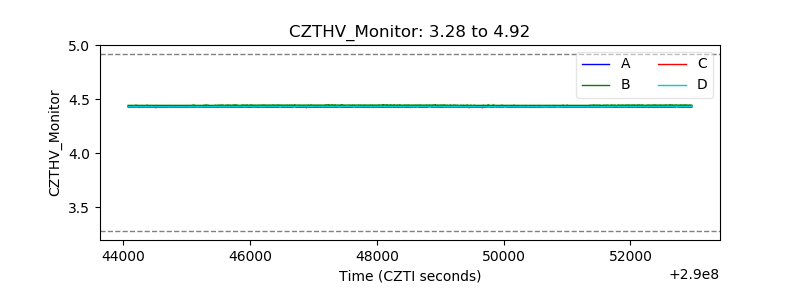 |
| D_VDD | 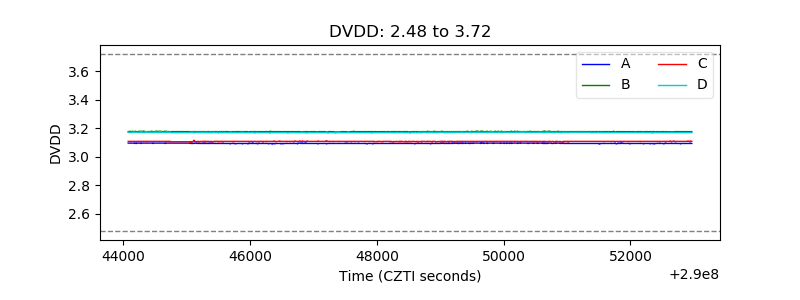 |
| Temperature 1 | 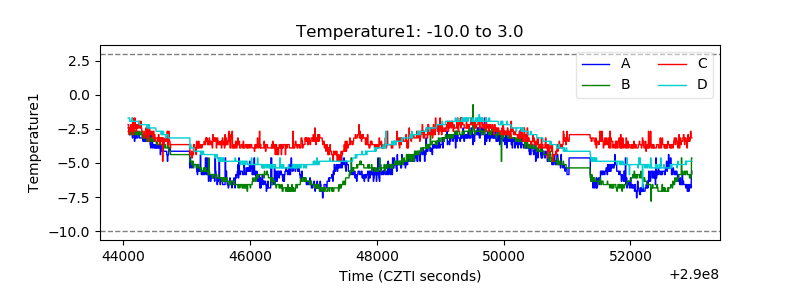 |
| Veto HV Monitor | 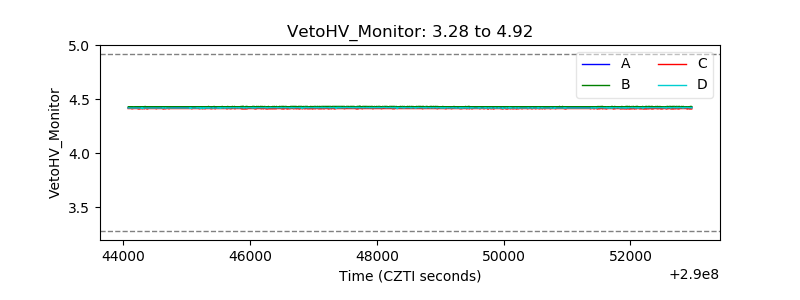 |
| Veto LLD | 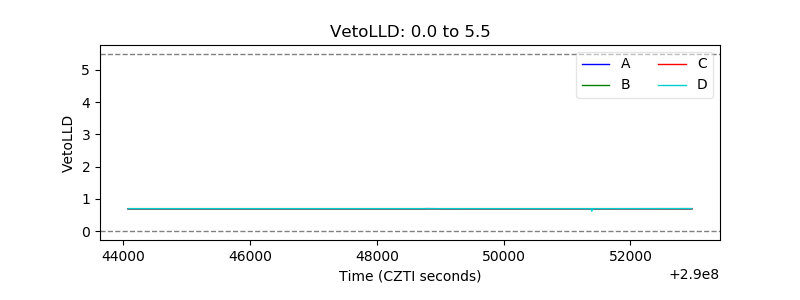 |
| Alpha Counter | 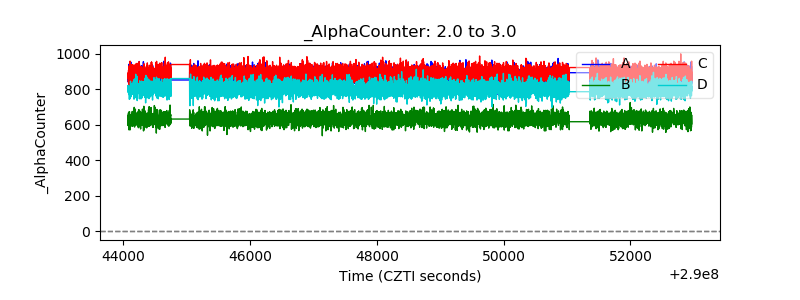 |
| _CPM_Rate | 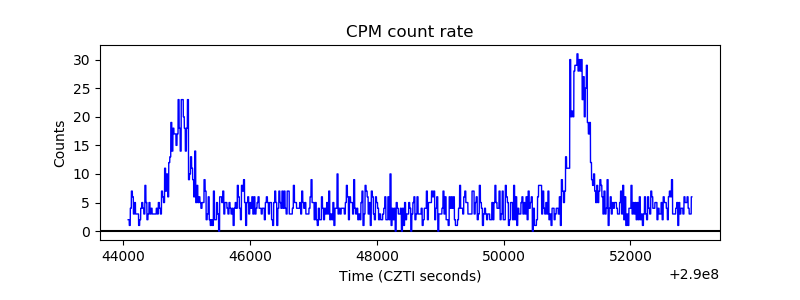 |
| CZT Counter | 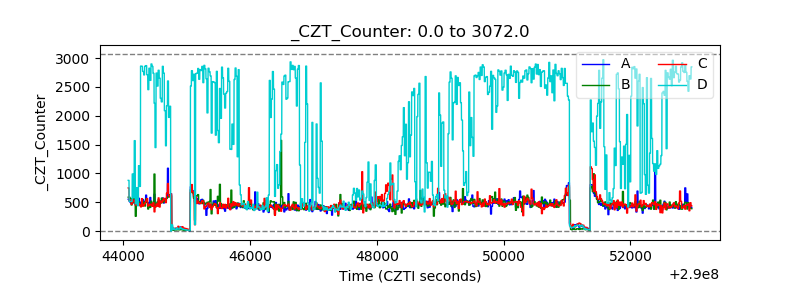 |
| +2.5 Volts monitor |  |
| +5 Volts monitor | 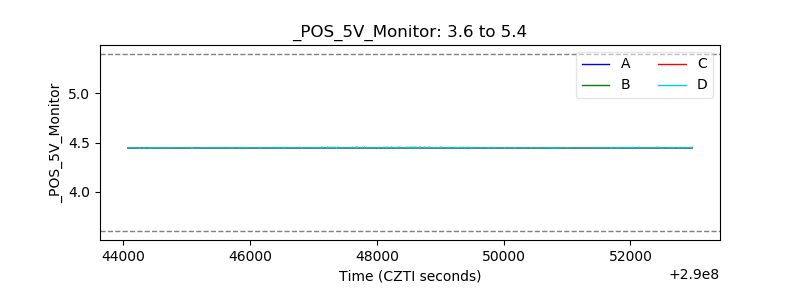 |
| _ROLL_ROT | 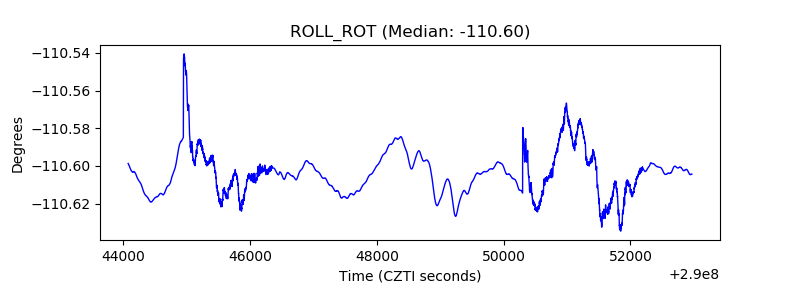 |
| _Roll_DEC |  |
| _Roll_RA | 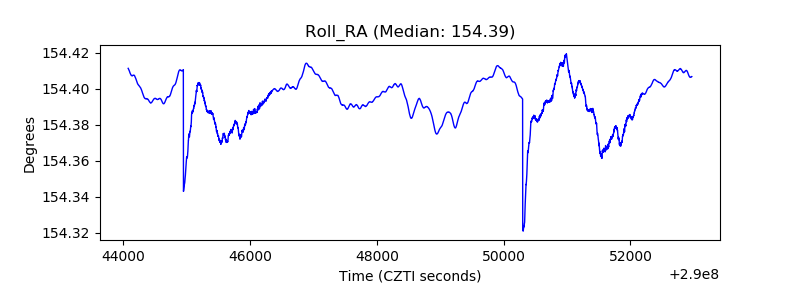 |
| Veto Counter | 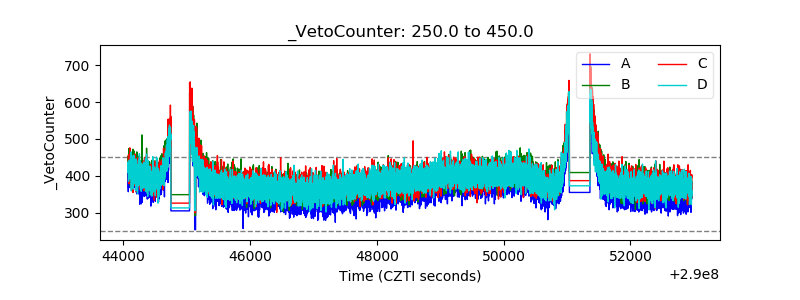 |