| Param | Original file | Final file |
|---|---|---|
| Filename | modeM0/AS1A06_005T01_9000002788_18665cztM0_level2.evt | modeM0/AS1A06_005T01_9000002788_18665cztM0_level2_quad_clean.evt |
| Size (bytes) | 587,877,120 | 63,745,920 |
| Size | 560.6 MB | 60.8 MB |
| Events in quadrant A | 2,618,252 | 440,013 |
| Events in quadrant B | 2,510,633 | 447,625 |
| Events in quadrant C | 2,547,902 | 426,985 |
| Events in quadrant D | 9,763,670 | 239,297 |
| Mode SS | |||
|---|---|---|---|
| Quadrant | BADHDUFLAG | Total packets | Discarded packets |
| A | 0 | 108 | 0 |
| B | 0 | 108 | 0 |
| C | 0 | 108 | 0 |
| D | 0 | 108 | 0 |
| Mode M0 | |||
|---|---|---|---|
| Quadrant | BADHDUFLAG | Total packets | Discarded packets |
| A | 0 | 11291 | 1 |
| B | 0 | 10953 | 1 |
| C | 0 | 10976 | 1 |
| D | 0 | 32705 | 1 |
| Quadrant | Total seconds | Saturated seconds | Saturation percentage |
|---|---|---|---|
| A | 5354 | 43 | 0.803138% |
| B | 5355 | 40 | 0.746965% |
| C | 5355 | 55 | 1.027077% |
| D | 5355 | 2826 | 52.773109% |
Noise dominated data is calculated using 1-second bins in cleaned event files. If a bin has >2000 counts, and if more than 50% of those come from <1% of pixels, then it is considered to be noise-dominated and hence unusable.
| Quadrant | # 1 sec bins | Bins with >0 counts | Bins with >2000 counts | High rate bins dominated by noise | Noise dominated (total time) | Noise dominated (detector-on time) | Marked lightcurve |
|---|---|---|---|---|---|---|---|
| A | 5354 | 5354 | 20 | 20 | 0.37% | 0.37% | 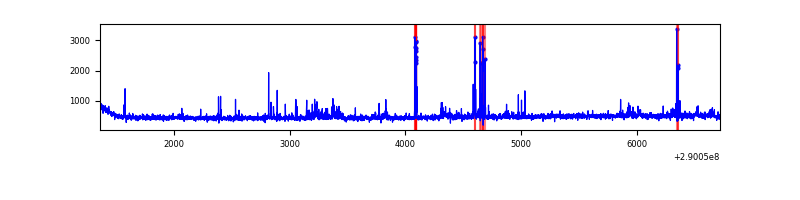 |
| B | 5355 | 5355 | 2 | 2 | 0.04% | 0.04% | 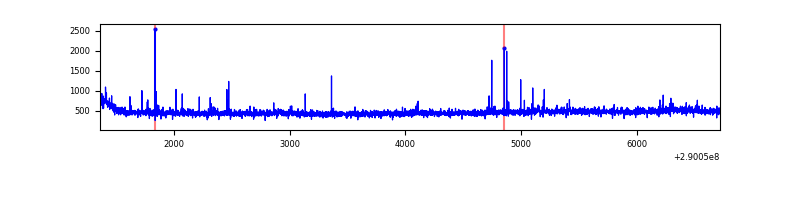 |
| C | 5355 | 5355 | 0 | 0 | 0.00% | 0.00% |  |
| D | 5354 | 5354 | 2605 | 2605 | 48.66% | 48.66% | 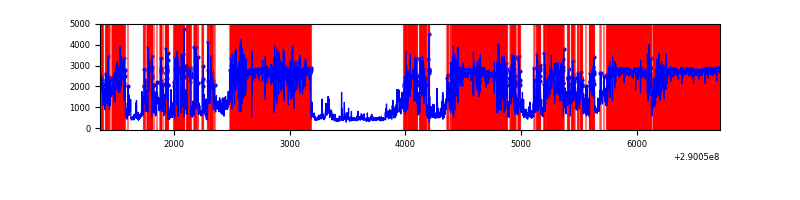 |
Top three noisy pixels from each quadrant. If the there are fewer than three noisy pixels in the level2.evt file, extra rows are filled as -1
| Pixel properties | Quadrant properties | ||||||
|---|---|---|---|---|---|---|---|
| Quadrant | DetID | PixID | Counts | Sigma | Mean | Median | Sigma |
| A | 15 | 192 | 115948 | 909.75 | 624 | 611 | 126.8 |
| A | 6 | 16 | 93860 | 735.52 | 624 | 611 | 126.8 |
| A | 13 | 254 | 8454 | 61.86 | 624 | 611 | 126.8 |
| B | 4 | 80 | 19445 | 157.0 | 625 | 609 | 120.0 |
| B | 0 | 189 | 15292 | 122.38 | 625 | 609 | 120.0 |
| B | 12 | 111 | 14898 | 119.1 | 625 | 609 | 120.0 |
| C | 3 | 233 | 93064 | 657.49 | 600 | 604 | 140.6 |
| C | 14 | 238 | 92209 | 651.41 | 600 | 604 | 140.6 |
| C | 9 | 221 | 15750 | 107.7 | 600 | 604 | 140.6 |
| D | 7 | 238 | 7903853 | 78704.9 | 411 | 398 | 100.4 |
| D | 1 | 52 | 274559 | 2730.17 | 411 | 398 | 100.4 |
| D | 2 | 234 | 14486 | 140.29 | 411 | 398 | 100.4 |
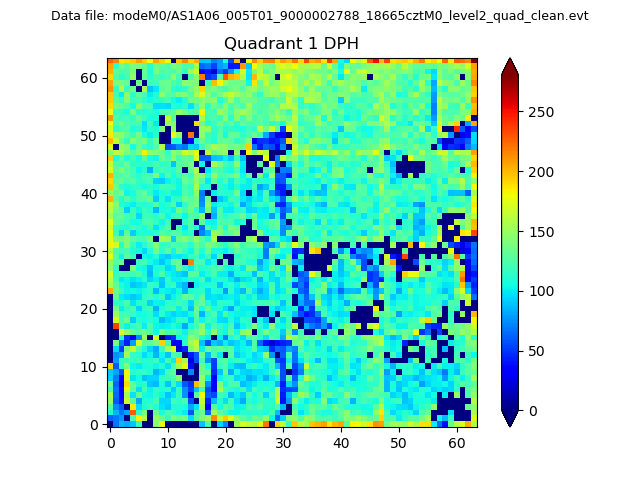
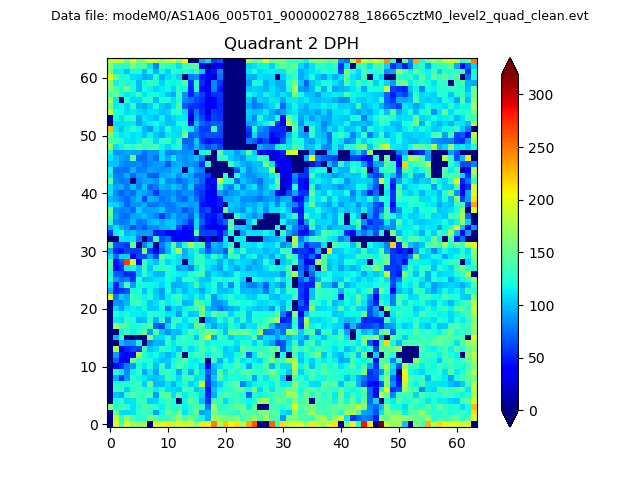
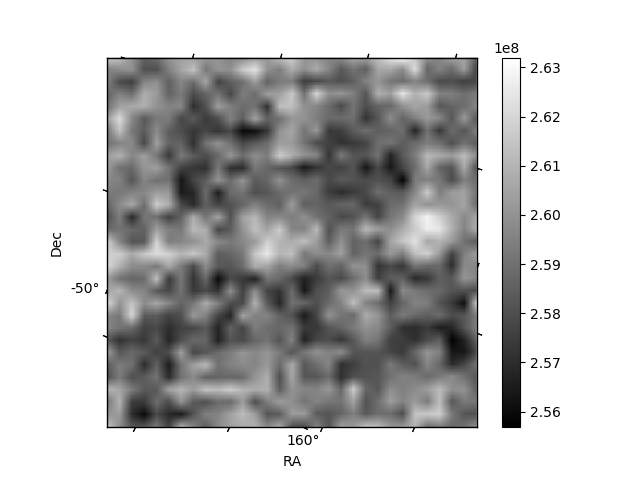
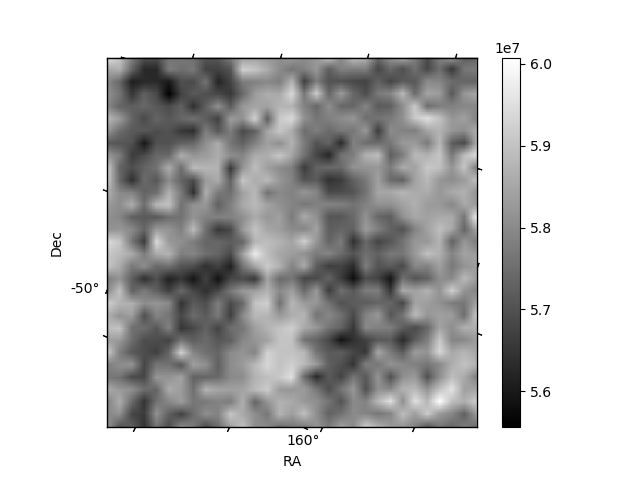
Histogram calculated using DETX and DETY for each event in the final _common_clean file
| Quadrant A | 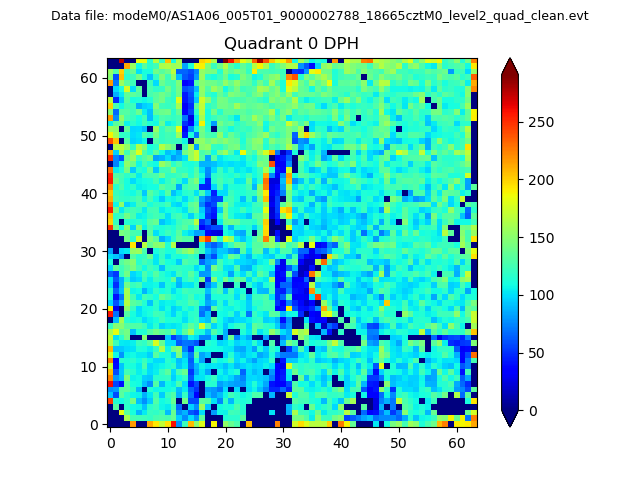 |
 |
Quadrant B |
|---|---|---|---|
| Quadrant D | 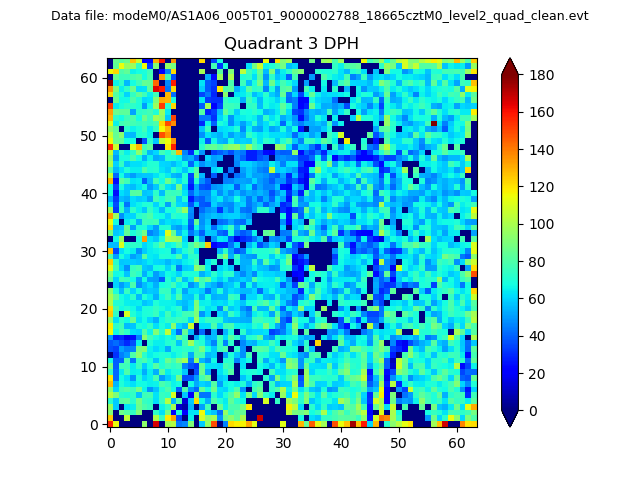 |
 |
Quadrant C |
| Plot type | Count rate plots | Images |
|---|---|---|
| Comparison with Poisson distribution Blue bars denote a histogram of data divided into 1 sec bins. Red curve is a Poisson curve with rate = median count rate of data. |
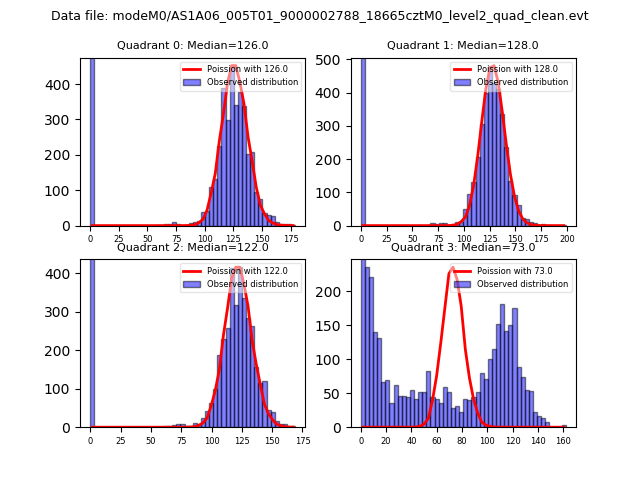 |
 |
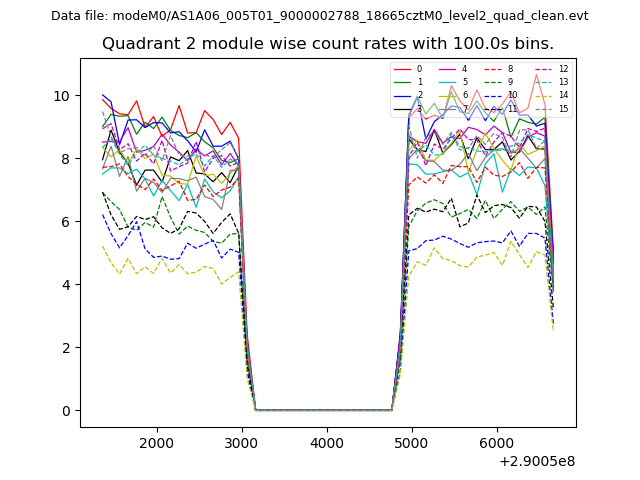
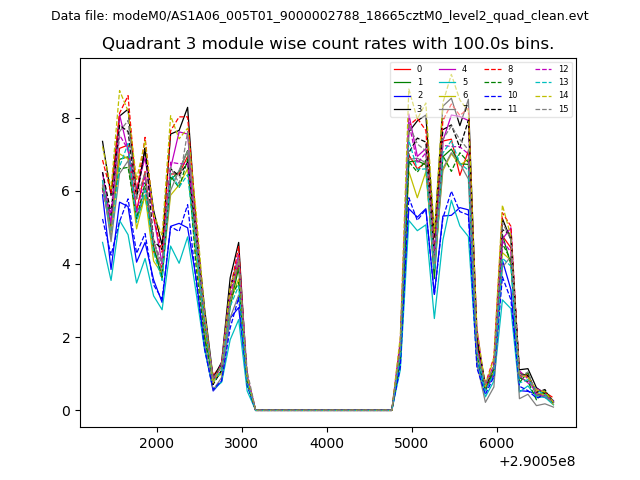
| Quadrant-wise count rates Data is divided into 100 sec bins |
 |
|
| Module-wise count rates for Quadrant A Data is divided into 100 sec bins |
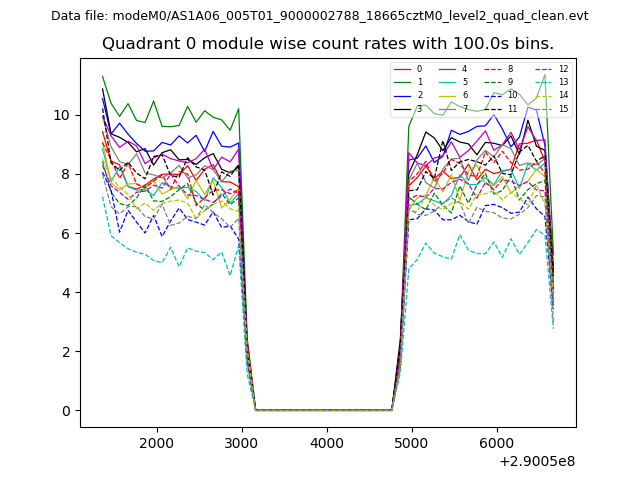 |
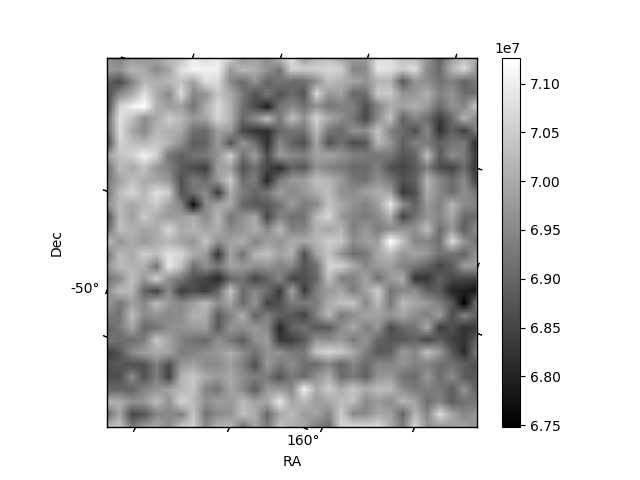 |
| Module-wise count rates for Quadrant B Data is divided into 100 sec bins |
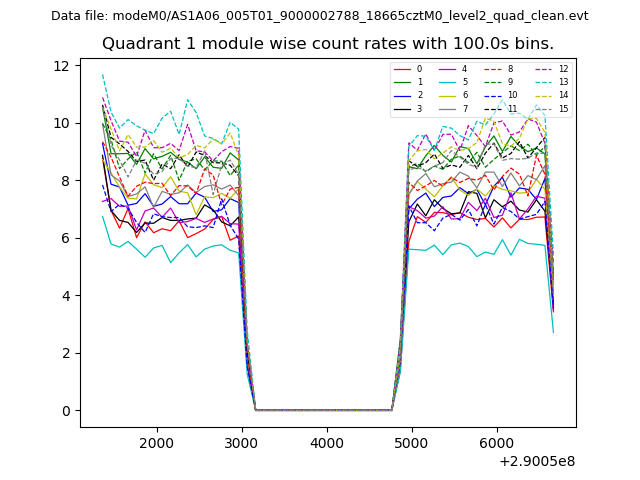 |
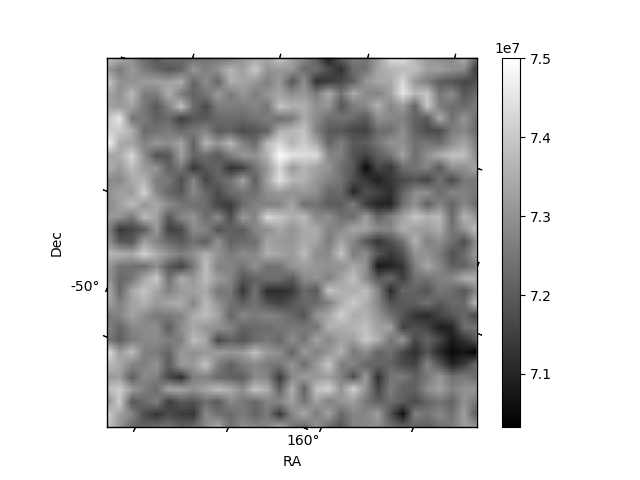 |
| Module-wise count rates for Quadrant C Data is divided into 100 sec bins |
 |
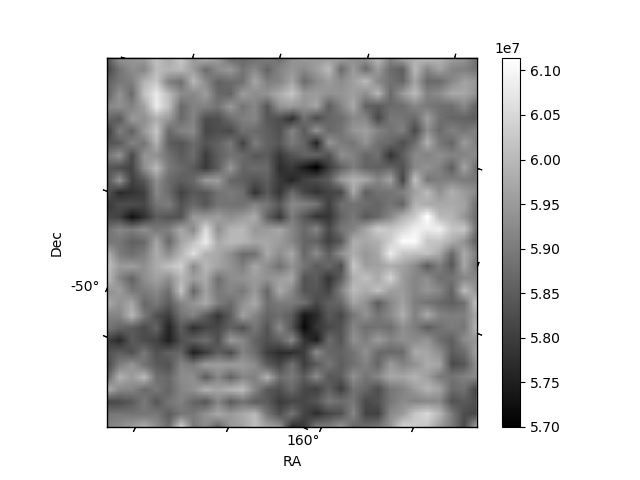 |
| Module-wise count rates for Quadrant D Data is divided into 100 sec bins |
 |
 |
| Parameter | Plot |
|---|---|
| CZT HV Monitor | 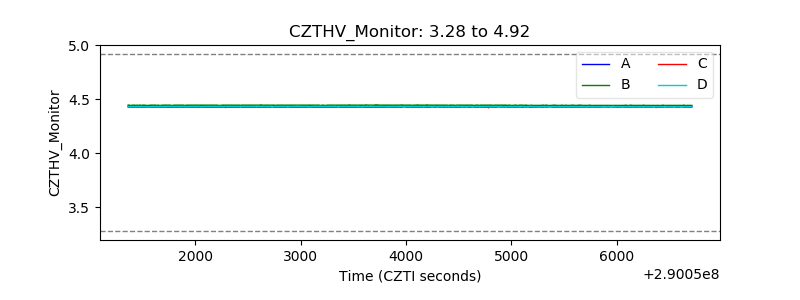 |
| D_VDD | 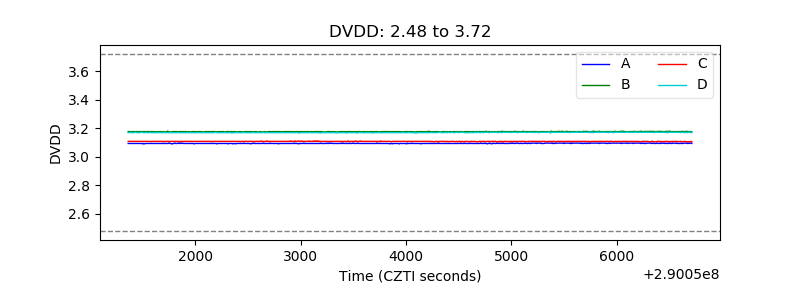 |
| Temperature 1 | 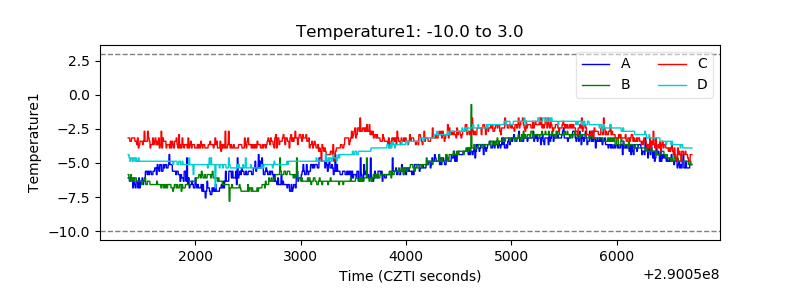 |
| Veto HV Monitor | 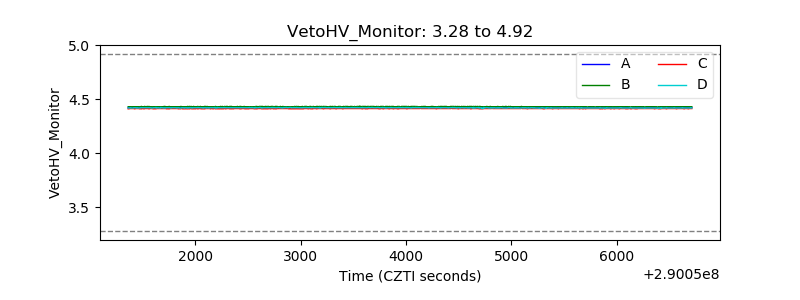 |
| Veto LLD | 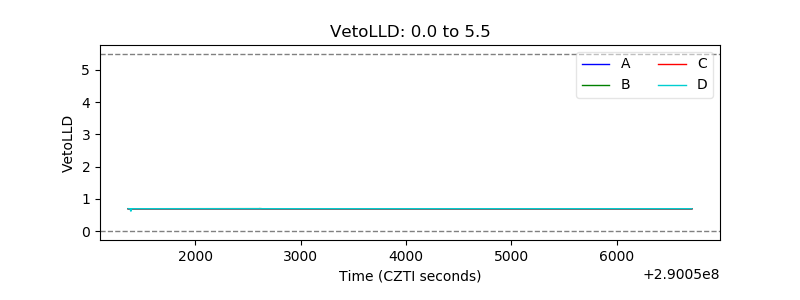 |
| Alpha Counter | 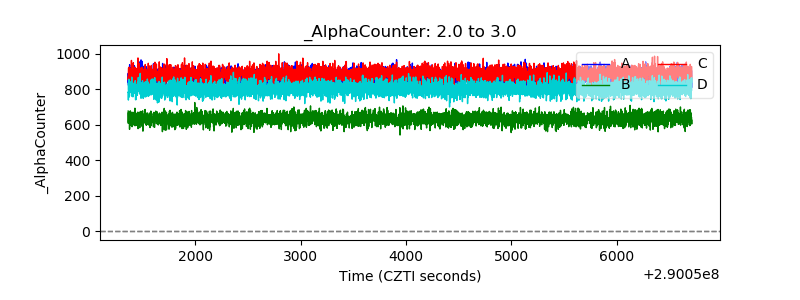 |
| _CPM_Rate |  |
| CZT Counter | 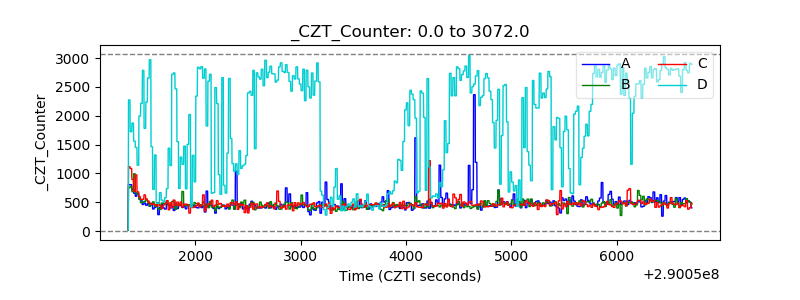 |
| +2.5 Volts monitor |  |
| +5 Volts monitor |  |
| _ROLL_ROT | 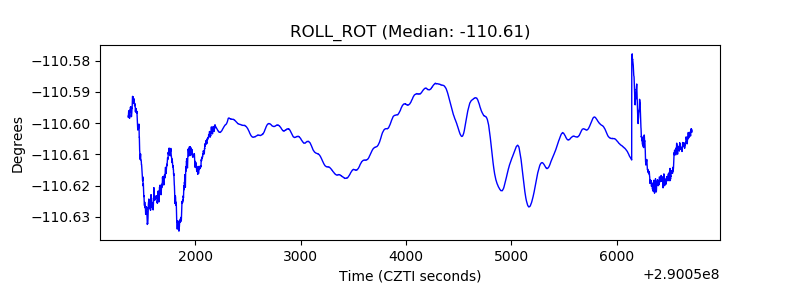 |
| _Roll_DEC | 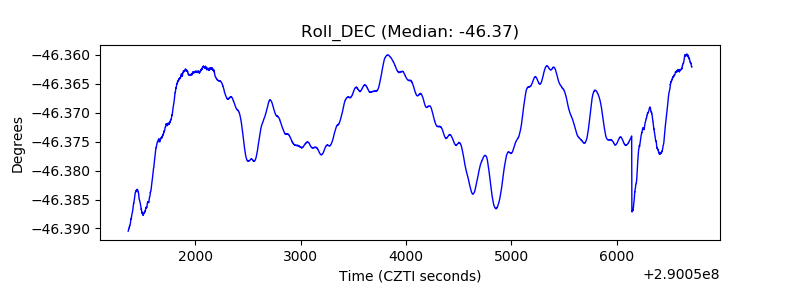 |
| _Roll_RA | 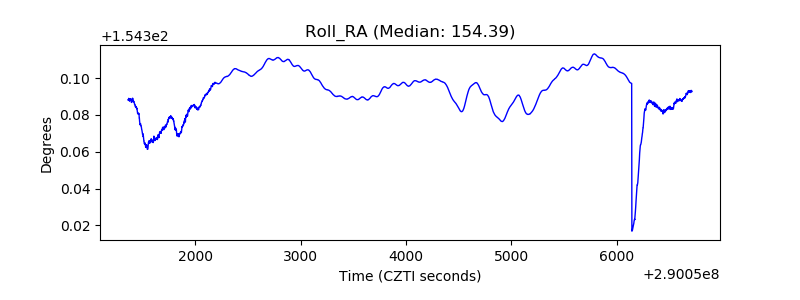 |
| Veto Counter | 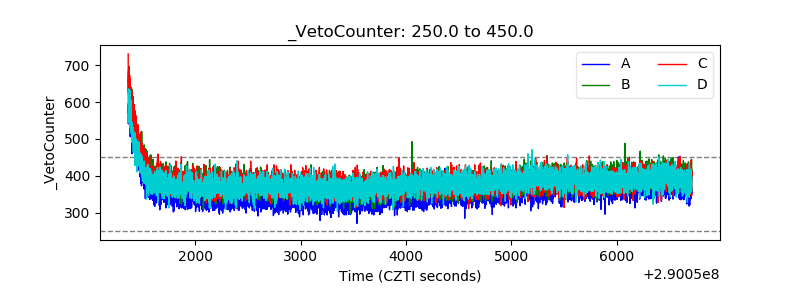 |