| Param | Original file | Final file |
|---|---|---|
| Filename | modeM0/AS1A06_005T01_9000002788_18666cztM0_level2.evt | modeM0/AS1A06_005T01_9000002788_18666cztM0_level2_quad_clean.evt |
| Size (bytes) | 1,414,077,120 | 165,974,400 |
| Size | 1.3 GB | 158.3 MB |
| Events in quadrant A | 6,575,652 | 1,160,512 |
| Events in quadrant B | 6,693,617 | 1,178,727 |
| Events in quadrant C | 6,698,145 | 1,130,354 |
| Events in quadrant D | 21,915,790 | 590,184 |
| Mode SS | |||
|---|---|---|---|
| Quadrant | BADHDUFLAG | Total packets | Discarded packets |
| A | 0 | 282 | 0 |
| B | 0 | 282 | 0 |
| C | 0 | 282 | 0 |
| D | 0 | 282 | 0 |
| Mode M9 | |||
|---|---|---|---|
| Quadrant | BADHDUFLAG | Total packets | Discarded packets |
| A | 0 | 22 | 0 |
| B | 0 | 22 | 0 |
| C | 0 | 22 | 0 |
| D | 0 | 22 | 0 |
| Mode M0 | |||
|---|---|---|---|
| Quadrant | BADHDUFLAG | Total packets | Discarded packets |
| A | 0 | 28663 | 4 |
| B | 0 | 28748 | 3 |
| C | 0 | 28863 | 3 |
| D | 0 | 74455 | 3 |
| Quadrant | Total seconds | Saturated seconds | Saturation percentage |
|---|---|---|---|
| A | 13974 | 91 | 0.651209% |
| B | 13975 | 152 | 1.087657% |
| C | 13975 | 195 | 1.395349% |
| D | 13975 | 5865 | 41.967800% |
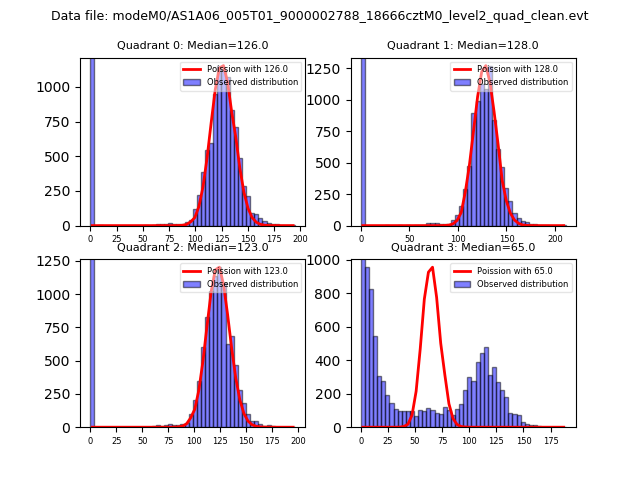
Noise dominated data is calculated using 1-second bins in cleaned event files. If a bin has >2000 counts, and if more than 50% of those come from <1% of pixels, then it is considered to be noise-dominated and hence unusable.
| Quadrant | # 1 sec bins | Bins with >0 counts | Bins with >2000 counts | High rate bins dominated by noise | Noise dominated (total time) | Noise dominated (detector-on time) | Marked lightcurve |
|---|---|---|---|---|---|---|---|
| A | 15989 | 13977 | 5 | 5 | 0.03% | 0.04% | 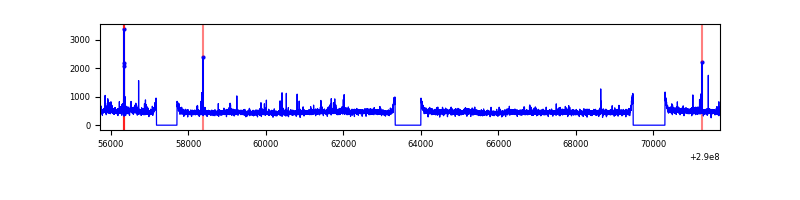 |
| B | 15990 | 13976 | 14 | 14 | 0.09% | 0.10% | 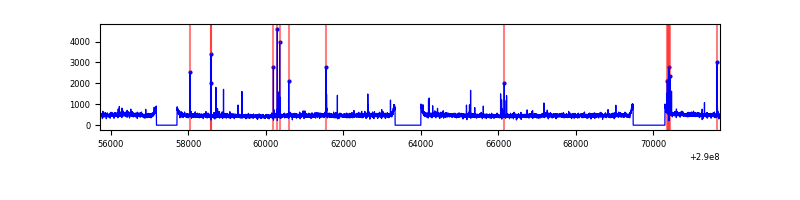 |
| C | 15990 | 13976 | 19 | 19 | 0.12% | 0.14% | 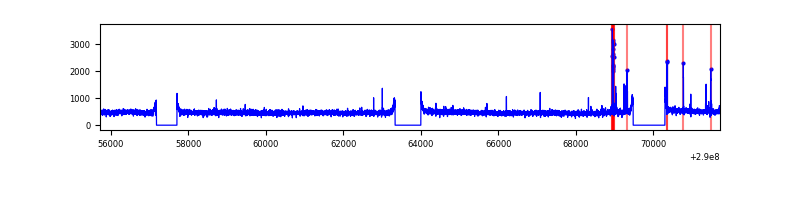 |
| D | 15990 | 13976 | 5693 | 5693 | 35.60% | 40.73% |  |
Top three noisy pixels from each quadrant. If the there are fewer than three noisy pixels in the level2.evt file, extra rows are filled as -1
| Pixel properties | Quadrant properties | ||||||
|---|---|---|---|---|---|---|---|
| Quadrant | DetID | PixID | Counts | Sigma | Mean | Median | Sigma |
| A | 6 | 16 | 108244 | 319.87 | 1663 | 1628 | 333.3 |
| A | 15 | 192 | 36164 | 103.62 | 1663 | 1628 | 333.3 |
| A | 11 | 29 | 22428 | 62.4 | 1663 | 1628 | 333.3 |
| B | 4 | 80 | 60413 | 186.69 | 1666 | 1625 | 314.9 |
| B | 12 | 111 | 39234 | 119.43 | 1666 | 1625 | 314.9 |
| B | 11 | 111 | 34441 | 104.21 | 1666 | 1625 | 314.9 |
| C | 14 | 238 | 248404 | 659.23 | 1603 | 1615 | 374.4 |
| C | 9 | 54 | 103361 | 271.79 | 1603 | 1615 | 374.4 |
| C | 3 | 233 | 73007 | 190.7 | 1603 | 1615 | 374.4 |
| D | 7 | 238 | 17224639 | 61203.3 | 1165 | 1131 | 281.4 |
| D | 1 | 52 | 259241 | 917.19 | 1165 | 1131 | 281.4 |
| D | 2 | 234 | 39963 | 137.99 | 1165 | 1131 | 281.4 |
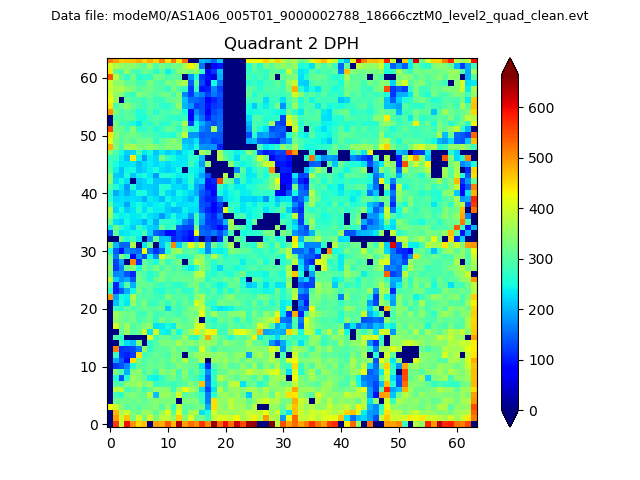
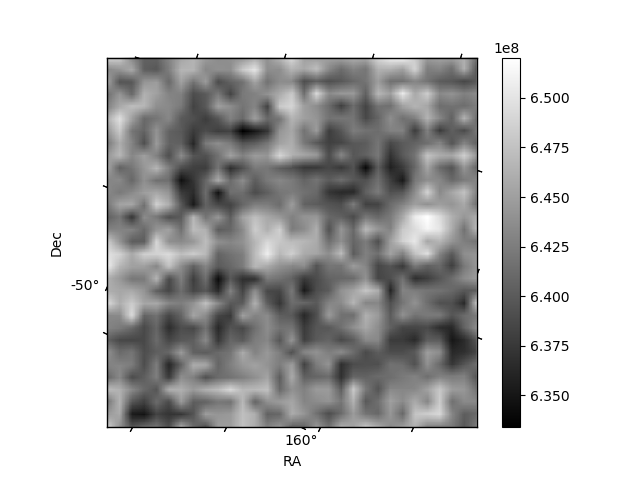
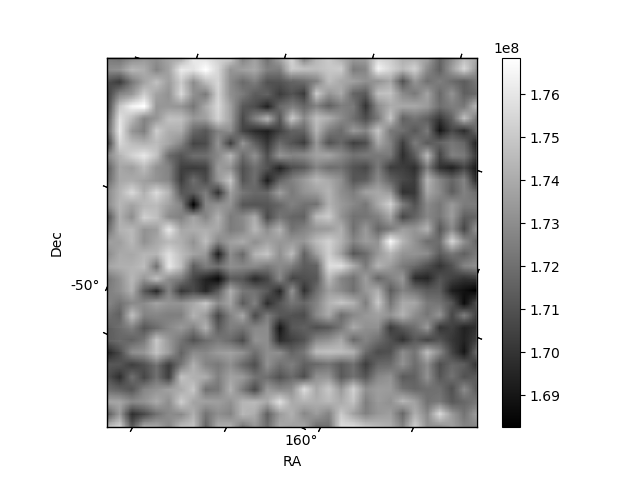
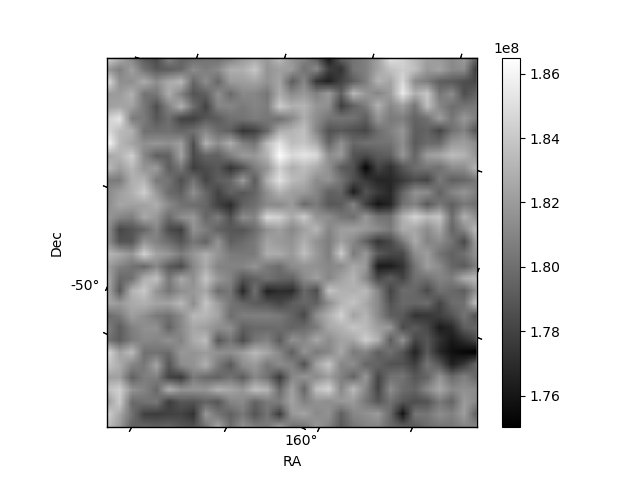
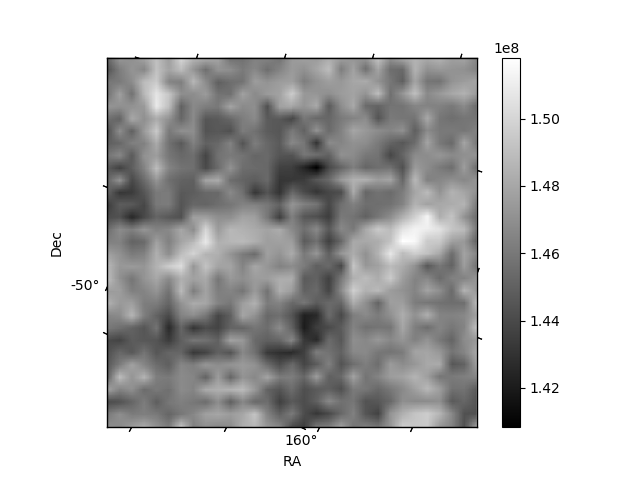
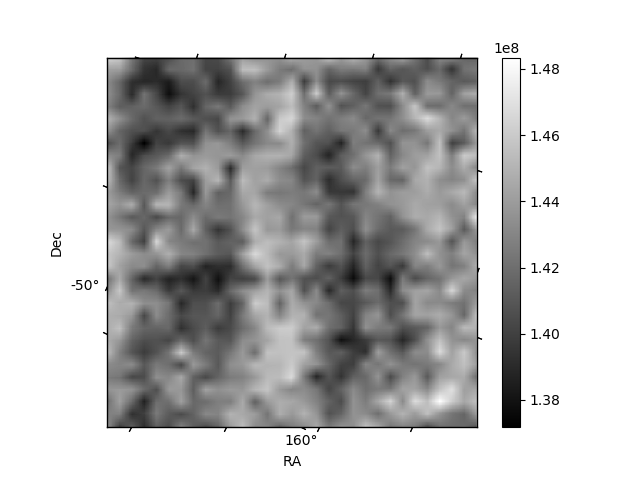
Histogram calculated using DETX and DETY for each event in the final _common_clean file
| Quadrant A | 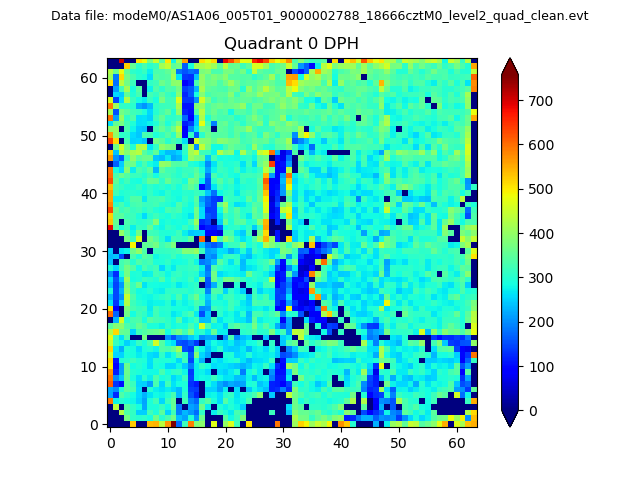 |
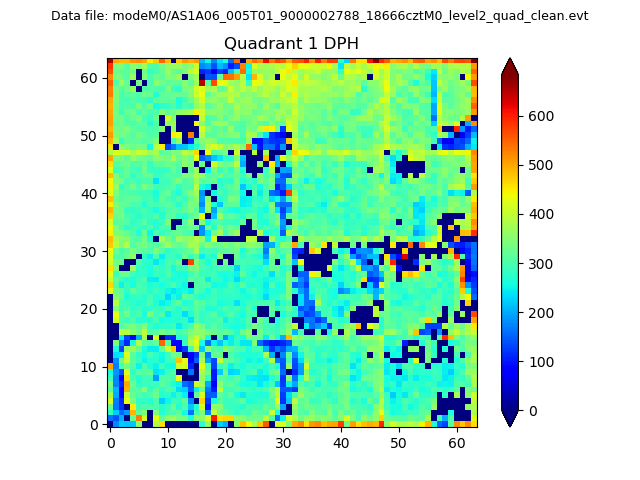 |
Quadrant B |
|---|---|---|---|
| Quadrant D | 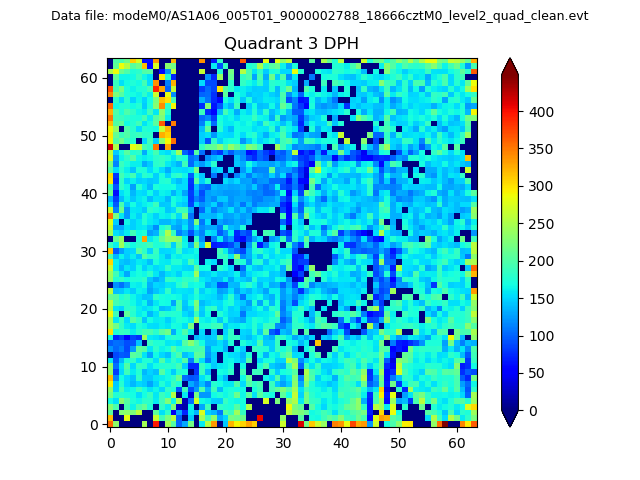 |
 |
Quadrant C |
| Plot type | Count rate plots | Images |
|---|---|---|
| Comparison with Poisson distribution Blue bars denote a histogram of data divided into 1 sec bins. Red curve is a Poisson curve with rate = median count rate of data. |
 |
 |
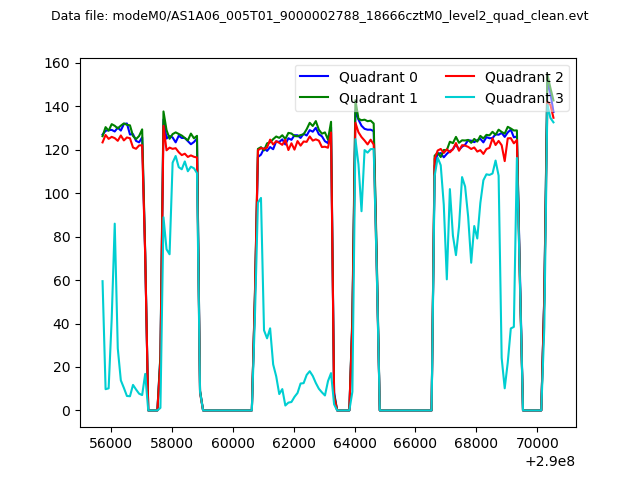
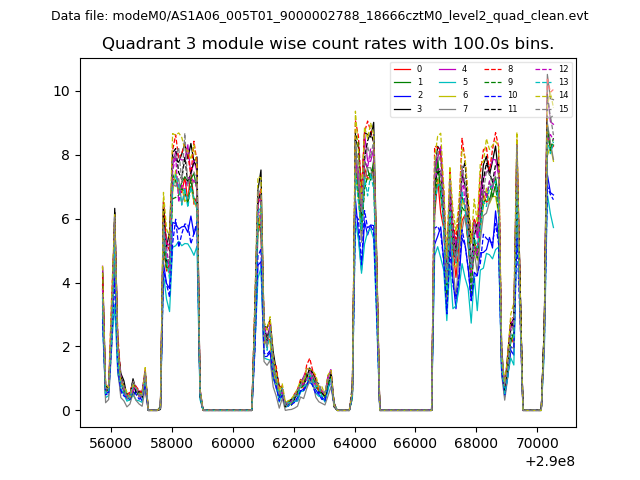
| Quadrant-wise count rates Data is divided into 100 sec bins |
 |
|
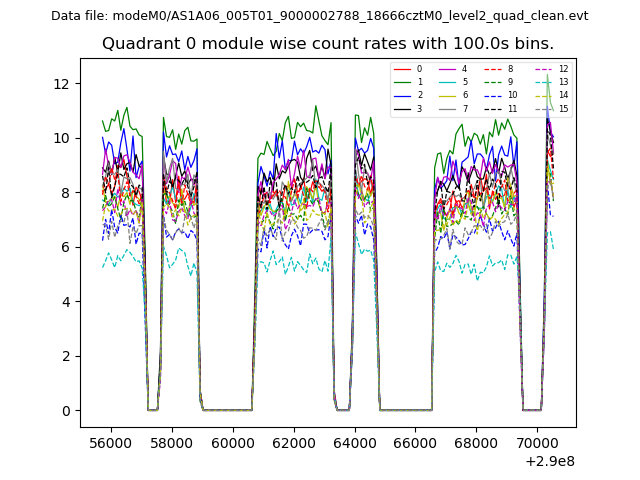
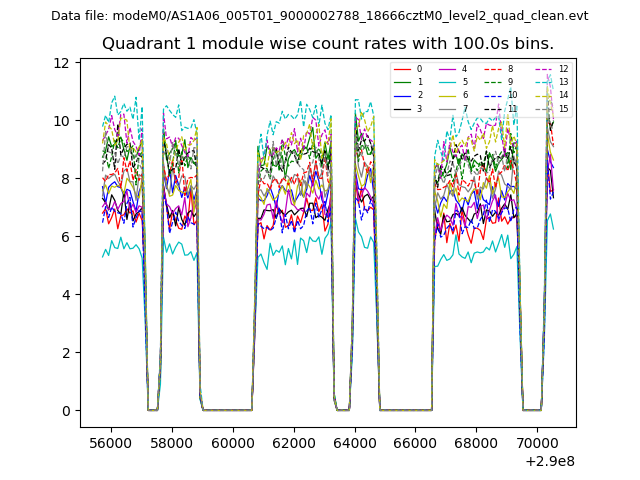
| Module-wise count rates for Quadrant A Data is divided into 100 sec bins |
 |
 |
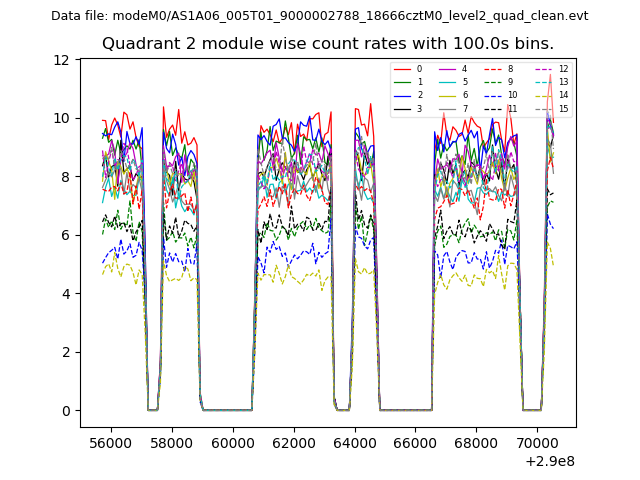
| Module-wise count rates for Quadrant B Data is divided into 100 sec bins |
 |
 |
| Module-wise count rates for Quadrant C Data is divided into 100 sec bins |
 |
 |
| Module-wise count rates for Quadrant D Data is divided into 100 sec bins |
 |
 |
| Parameter | Plot |
|---|---|
| CZT HV Monitor | 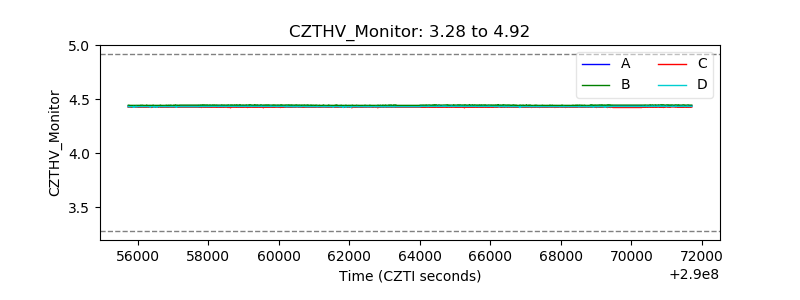 |
| D_VDD | 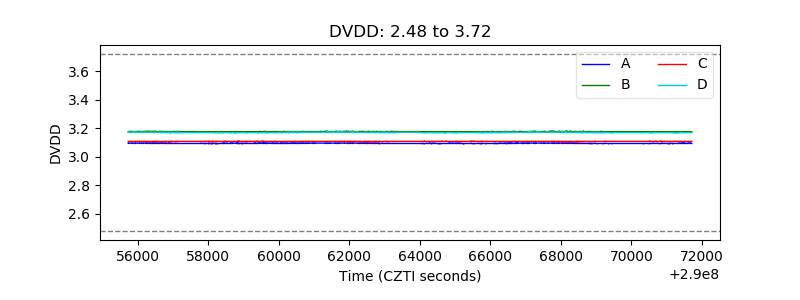 |
| Temperature 1 | 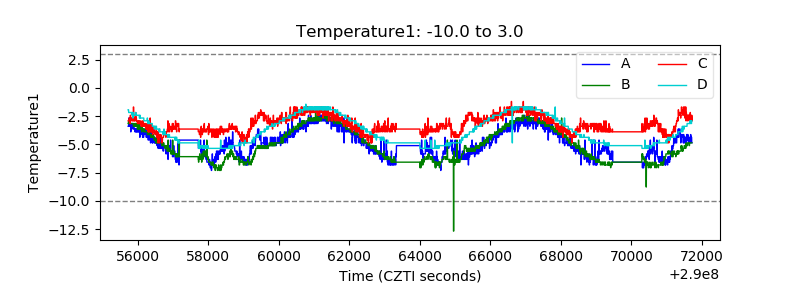 |
| Veto HV Monitor | 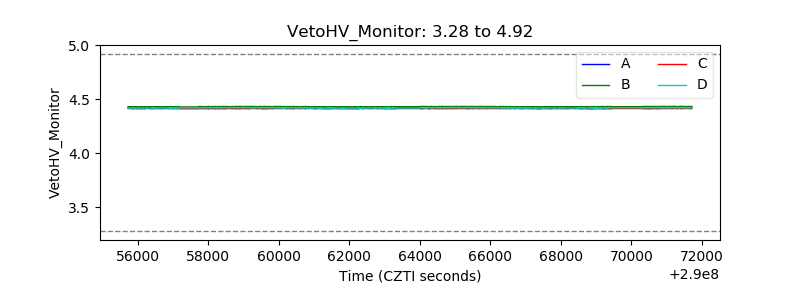 |
| Veto LLD | 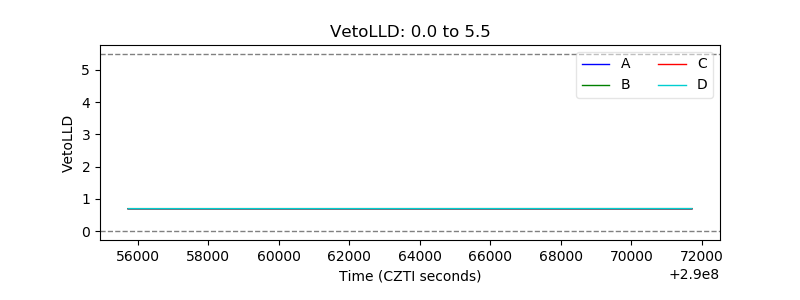 |
| Alpha Counter | 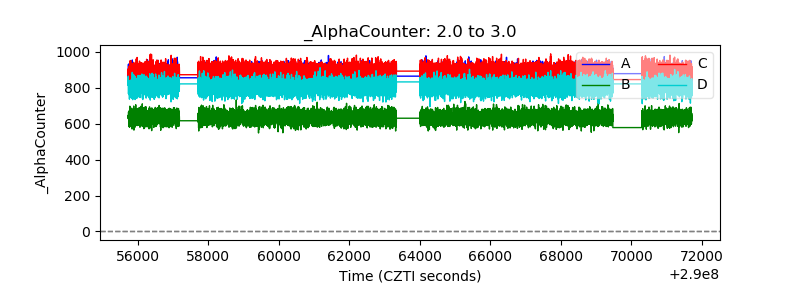 |
| _CPM_Rate | 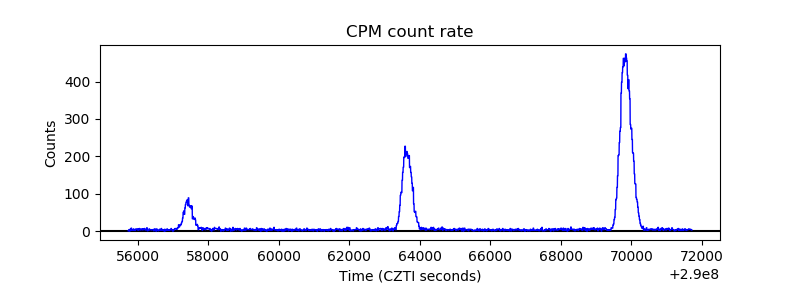 |
| CZT Counter | 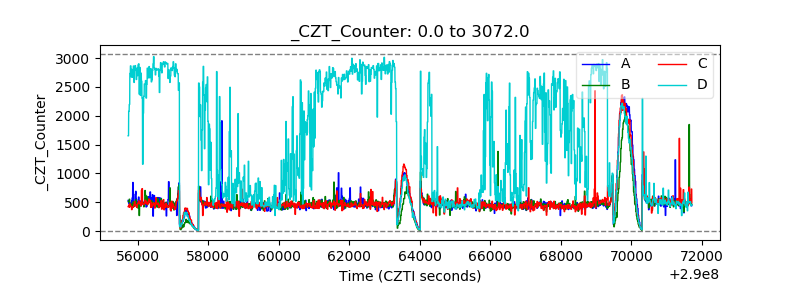 |
| +2.5 Volts monitor |  |
| +5 Volts monitor |  |
| _ROLL_ROT | 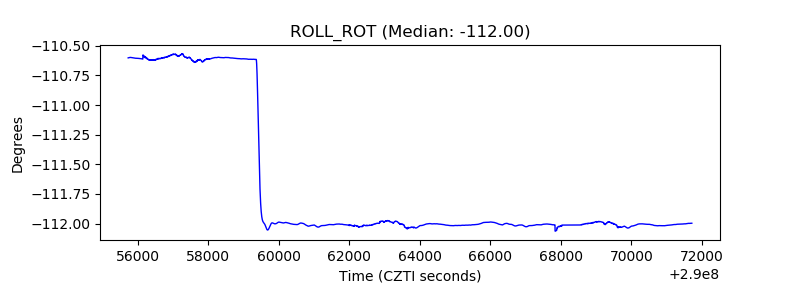 |
| _Roll_DEC | 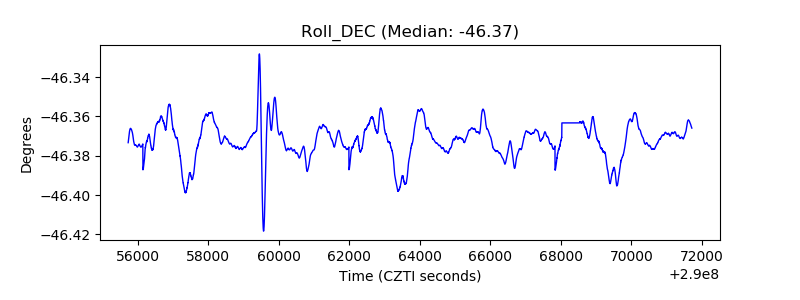 |
| _Roll_RA | 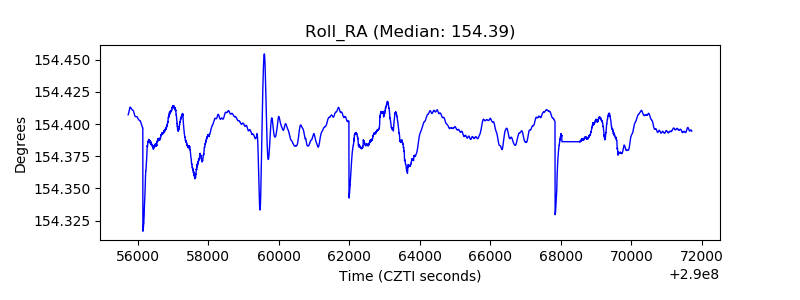 |
| Veto Counter | 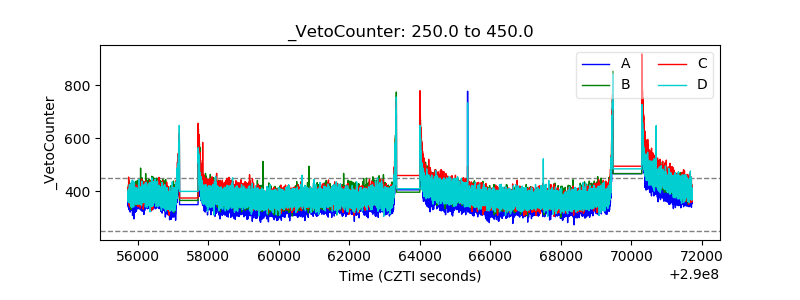 |