| Param | Original file | Final file |
|---|---|---|
| Filename | modeM0/AS1A06_005T01_9000002788_18669cztM0_level2.evt | modeM0/AS1A06_005T01_9000002788_18669cztM0_level2_quad_clean.evt |
| Size (bytes) | 500,143,680 | 77,071,680 |
| Size | 477.0 MB | 73.5 MB |
| Events in quadrant A | 3,378,184 | 476,847 |
| Events in quadrant B | 3,499,025 | 483,612 |
| Events in quadrant C | 3,421,483 | 466,044 |
| Events in quadrant D | 4,389,411 | 436,126 |
| Mode SS | |||
|---|---|---|---|
| Quadrant | BADHDUFLAG | Total packets | Discarded packets |
| A | 0 | 138 | 0 |
| B | 0 | 138 | 0 |
| C | 0 | 138 | 0 |
| D | 0 | 138 | 0 |
| Mode M9 | |||
|---|---|---|---|
| Quadrant | BADHDUFLAG | Total packets | Discarded packets |
| A | 0 | 21 | 0 |
| B | 0 | 21 | 0 |
| C | 0 | 21 | 0 |
| D | 0 | 21 | 0 |
| Mode M0 | |||
|---|---|---|---|
| Quadrant | BADHDUFLAG | Total packets | Discarded packets |
| A | 0 | 14389 | 2 |
| B | 0 | 14658 | 2 |
| C | 0 | 14609 | 2 |
| D | 0 | 17500 | 2 |
| Quadrant | Total seconds | Saturated seconds | Saturation percentage |
|---|---|---|---|
| A | 6759 | 110 | 1.627460% |
| B | 6760 | 125 | 1.849112% |
| C | 6760 | 148 | 2.189349% |
| D | 6760 | 365 | 5.399408% |
Noise dominated data is calculated using 1-second bins in cleaned event files. If a bin has >2000 counts, and if more than 50% of those come from <1% of pixels, then it is considered to be noise-dominated and hence unusable.
| Quadrant | # 1 sec bins | Bins with >0 counts | Bins with >2000 counts | High rate bins dominated by noise | Noise dominated (total time) | Noise dominated (detector-on time) | Marked lightcurve |
|---|---|---|---|---|---|---|---|
| A | 8824 | 6759 | 0 | 0 | 0.00% | 0.00% | 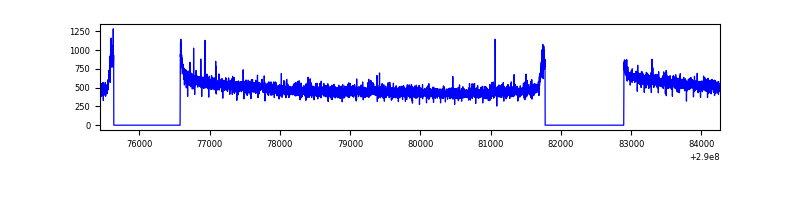 |
| B | 8825 | 6760 | 1 | 1 | 0.01% | 0.01% | 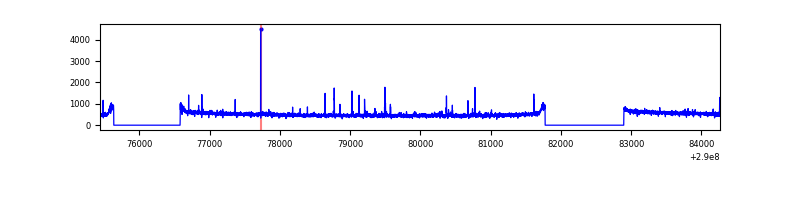 |
| C | 8825 | 6760 | 0 | 0 | 0.00% | 0.00% | 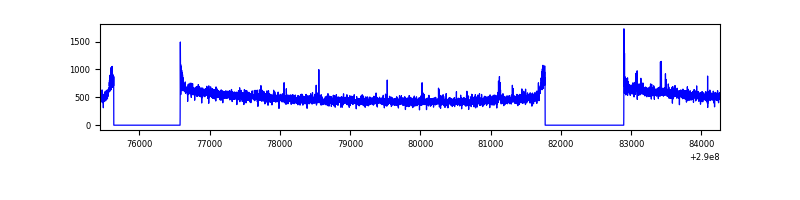 |
| D | 8825 | 6760 | 263 | 263 | 2.98% | 3.89% | 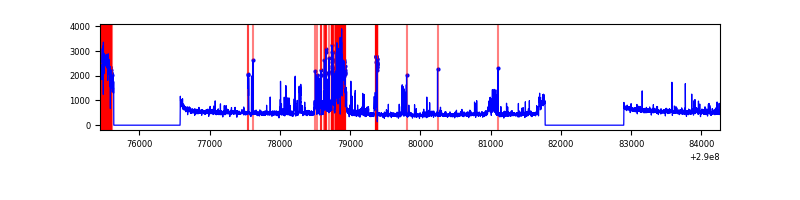 |
Top three noisy pixels from each quadrant. If the there are fewer than three noisy pixels in the level2.evt file, extra rows are filled as -1
| Pixel properties | Quadrant properties | ||||||
|---|---|---|---|---|---|---|---|
| Quadrant | DetID | PixID | Counts | Sigma | Mean | Median | Sigma |
| A | 15 | 192 | 14940 | 81.33 | 869 | 849 | 173.3 |
| A | 13 | 254 | 10783 | 57.34 | 869 | 849 | 173.3 |
| A | 11 | 29 | 9426 | 49.5 | 869 | 849 | 173.3 |
| B | 10 | 245 | 27327 | 162.01 | 865 | 844 | 163.5 |
| B | 3 | 64 | 22094 | 129.99 | 865 | 844 | 163.5 |
| B | 12 | 111 | 19513 | 114.21 | 865 | 844 | 163.5 |
| C | 14 | 238 | 130061 | 665.4 | 834 | 840 | 194.2 |
| C | 3 | 233 | 21985 | 108.88 | 834 | 840 | 194.2 |
| C | 9 | 54 | 18362 | 90.22 | 834 | 840 | 194.2 |
| D | 7 | 238 | 906560 | 4503.89 | 830 | 807 | 201.1 |
| D | 1 | 52 | 316931 | 1571.94 | 830 | 807 | 201.1 |
| D | 2 | 234 | 27301 | 131.74 | 830 | 807 | 201.1 |
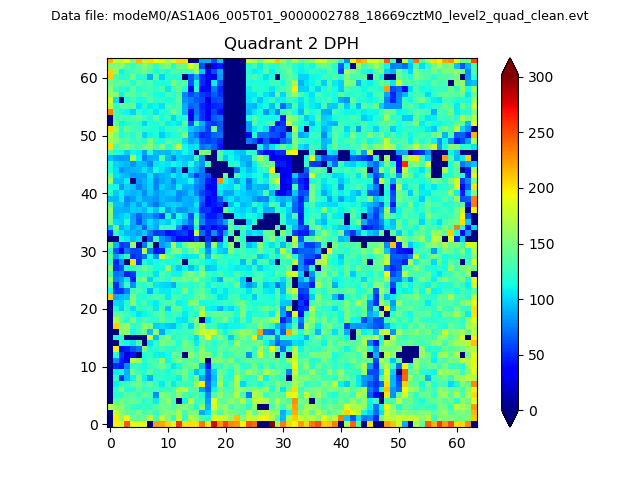
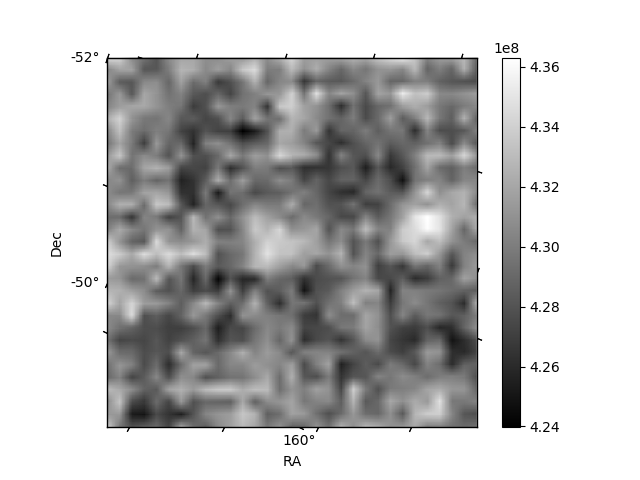
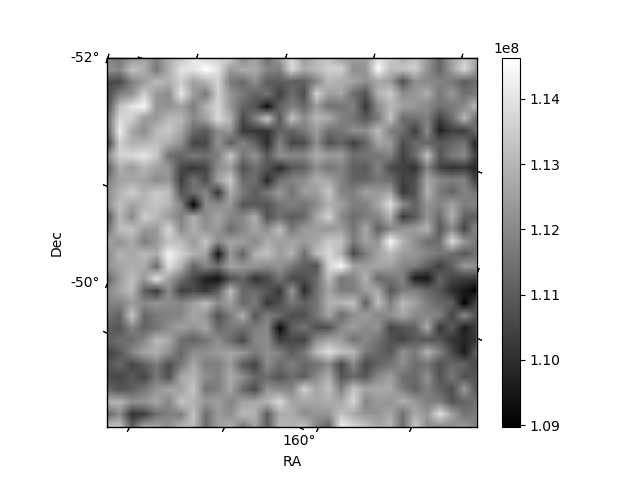
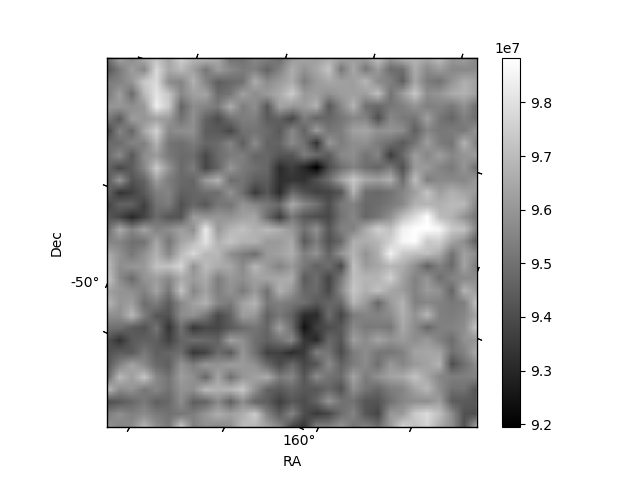
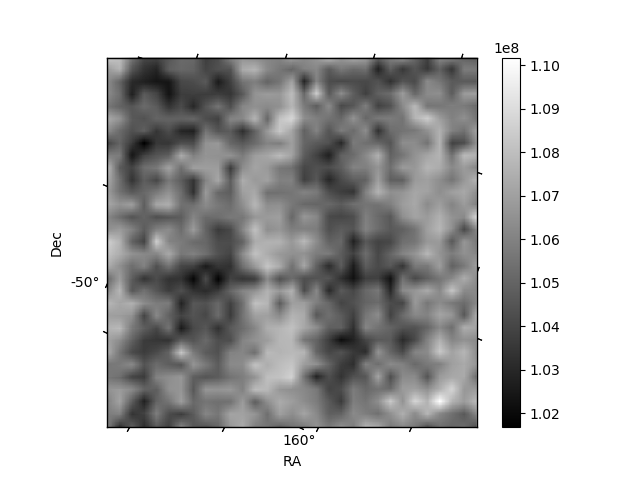
Histogram calculated using DETX and DETY for each event in the final _common_clean file
| Quadrant A | 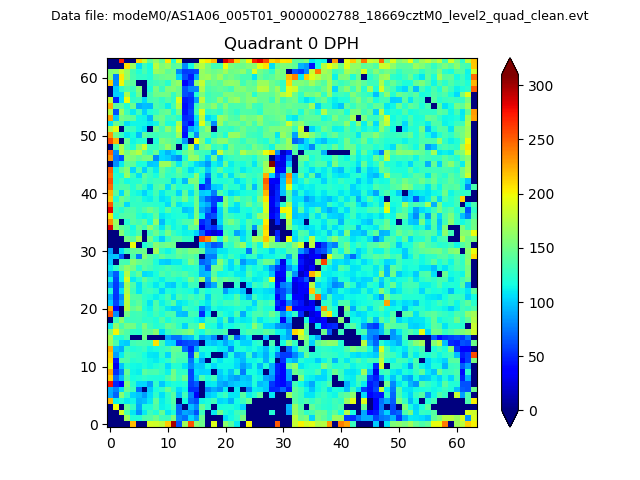 |
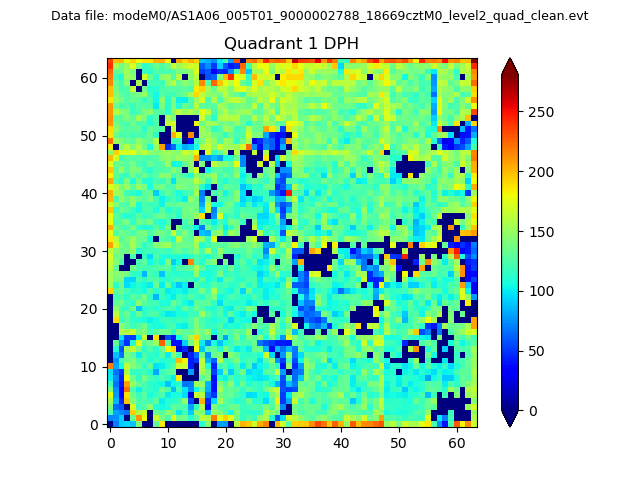 |
Quadrant B |
|---|---|---|---|
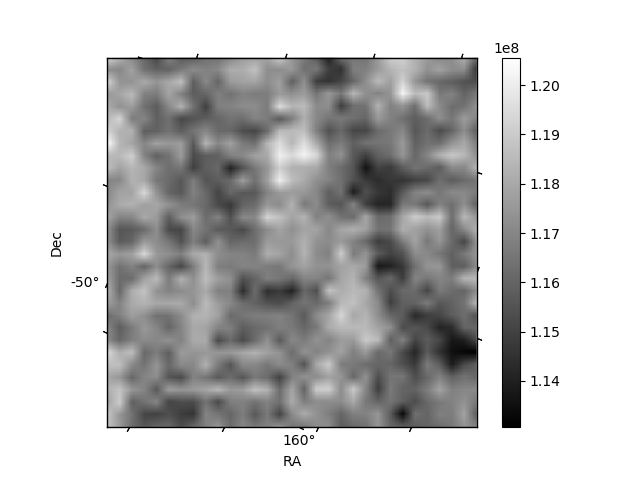
| Quadrant D | 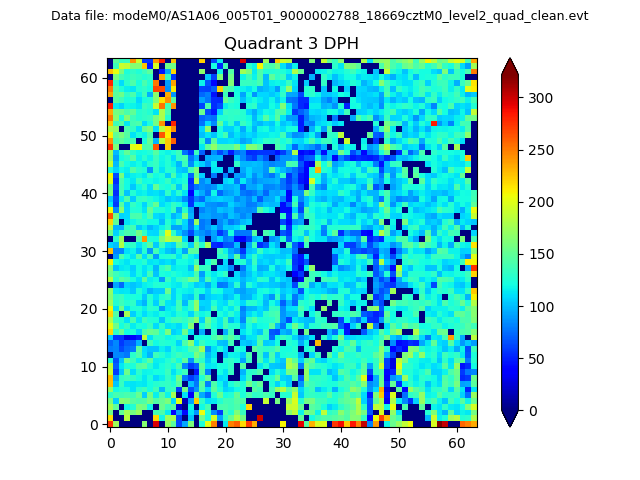 |
 |
Quadrant C |
| Plot type | Count rate plots | Images |
|---|---|---|
| Comparison with Poisson distribution Blue bars denote a histogram of data divided into 1 sec bins. Red curve is a Poisson curve with rate = median count rate of data. |
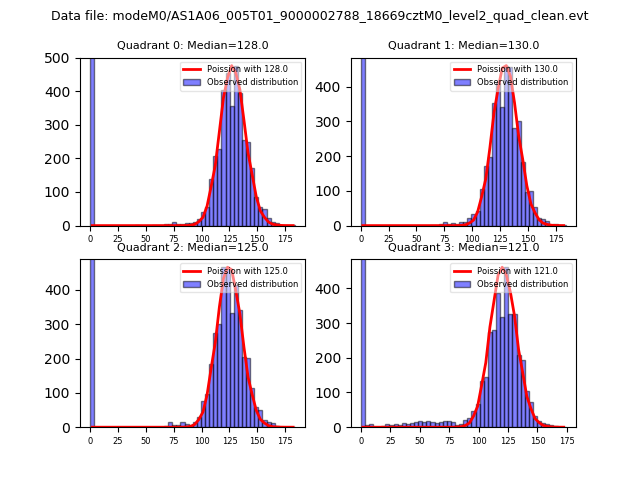 |
 |
| Quadrant-wise count rates Data is divided into 100 sec bins |
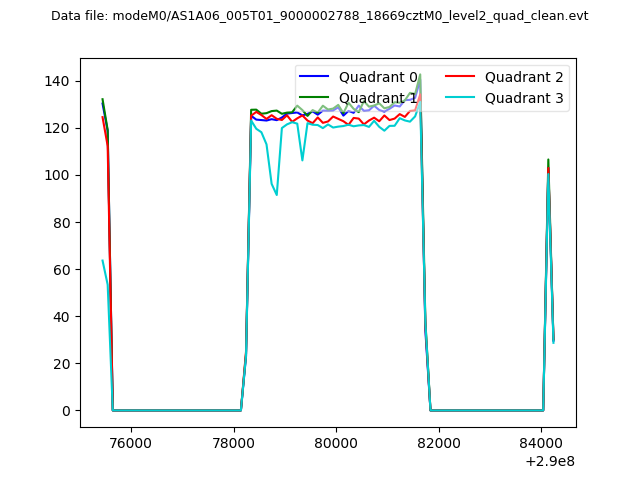 |
|
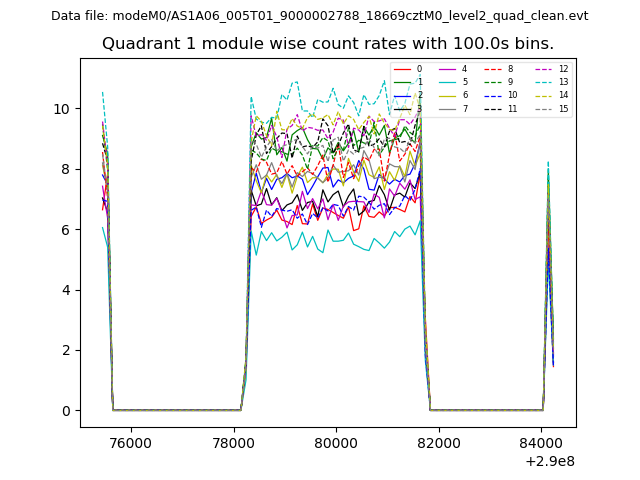
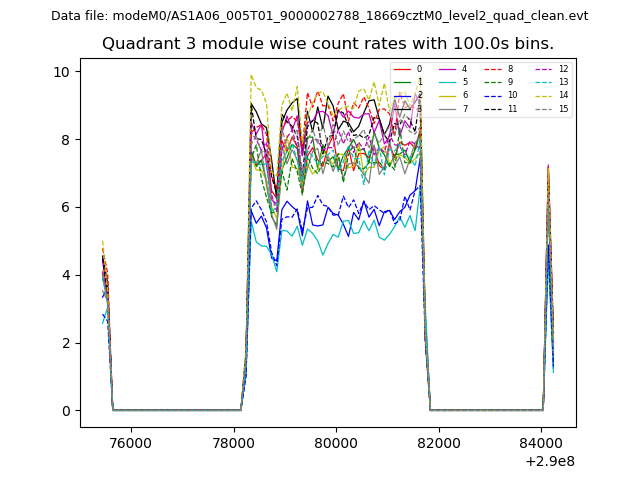
| Module-wise count rates for Quadrant A Data is divided into 100 sec bins |
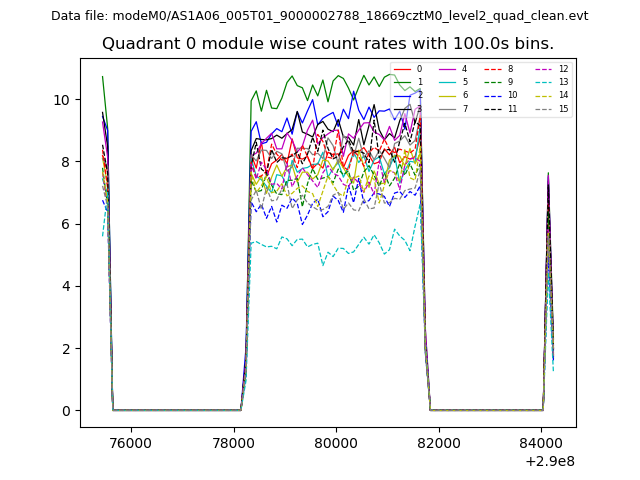 |
 |
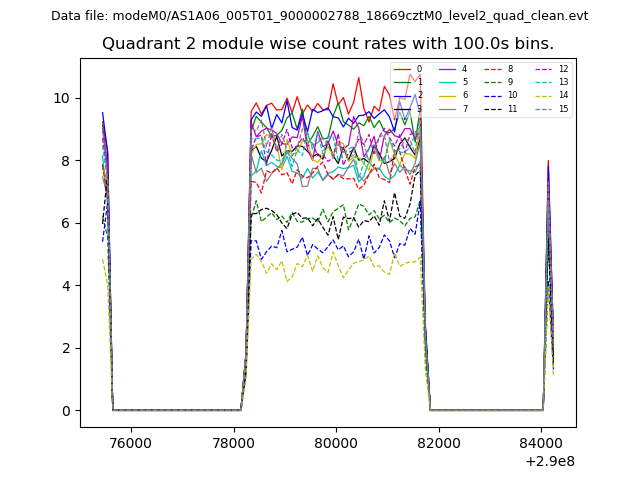
| Module-wise count rates for Quadrant B Data is divided into 100 sec bins |
 |
 |
| Module-wise count rates for Quadrant C Data is divided into 100 sec bins |
 |
 |
| Module-wise count rates for Quadrant D Data is divided into 100 sec bins |
 |
 |
| Parameter | Plot |
|---|---|
| CZT HV Monitor | 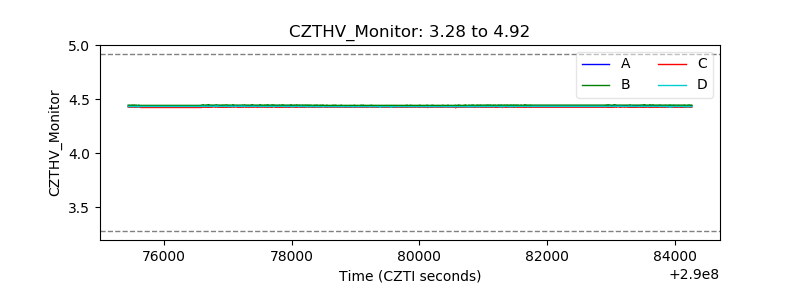 |
| D_VDD | 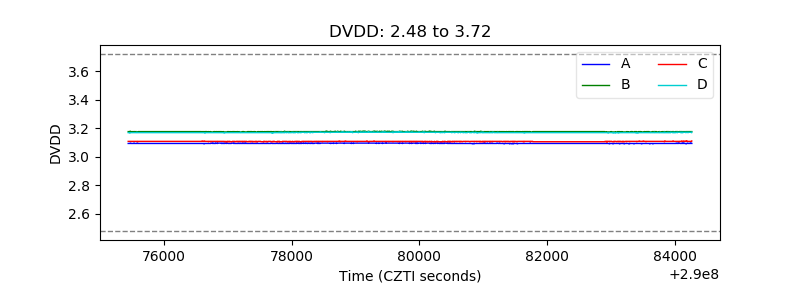 |
| Temperature 1 | 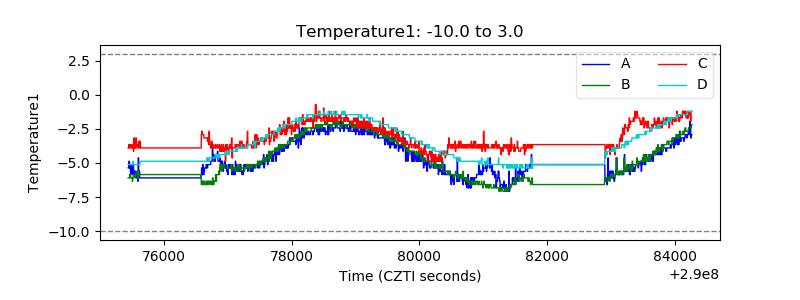 |
| Veto HV Monitor | 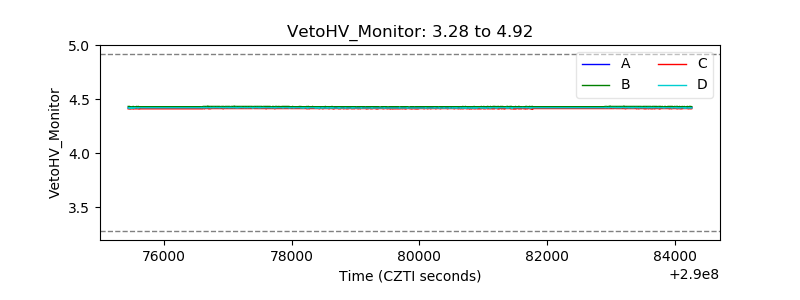 |
| Veto LLD | 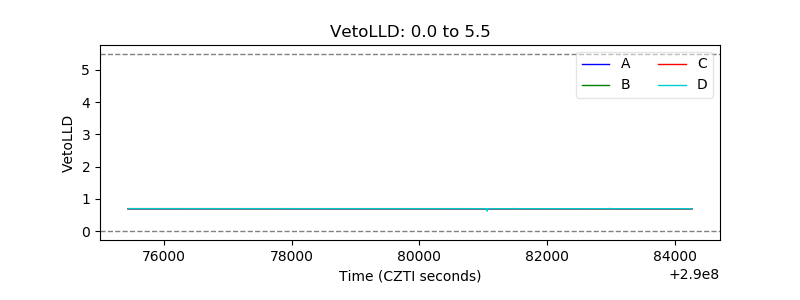 |
| Alpha Counter | 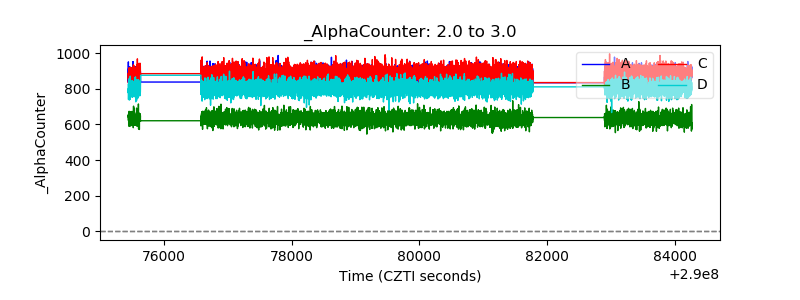 |
| _CPM_Rate | 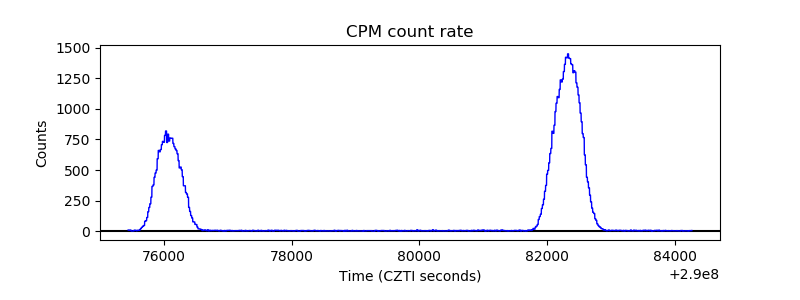 |
| CZT Counter |  |
| +2.5 Volts monitor |  |
| +5 Volts monitor | 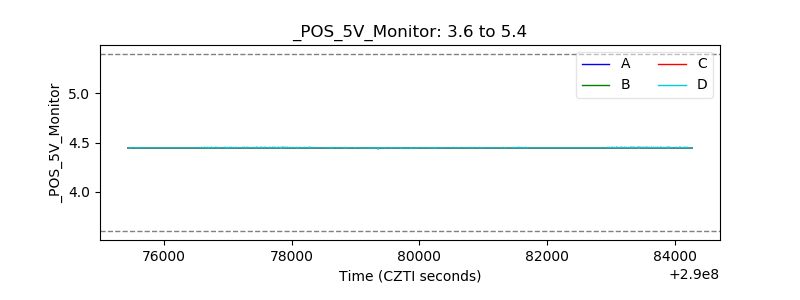 |
| _ROLL_ROT | 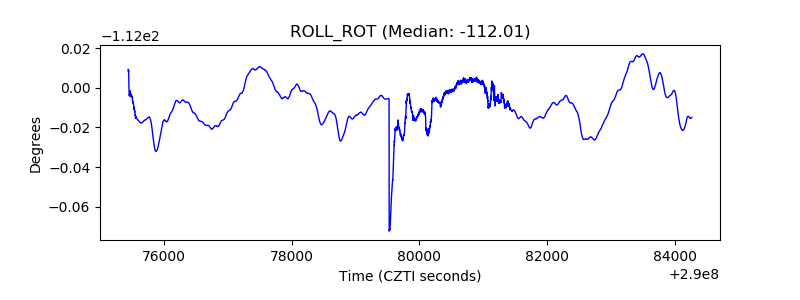 |
| _Roll_DEC |  |
| _Roll_RA | 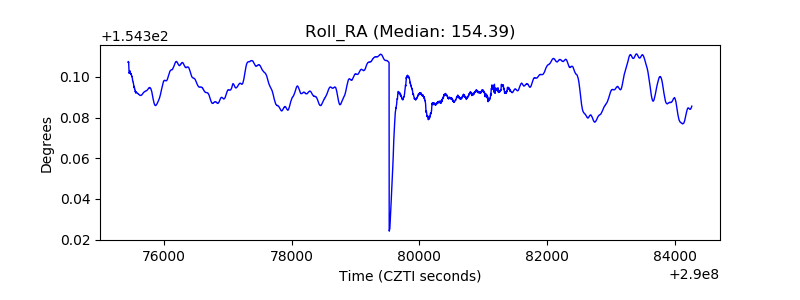 |
| Veto Counter | 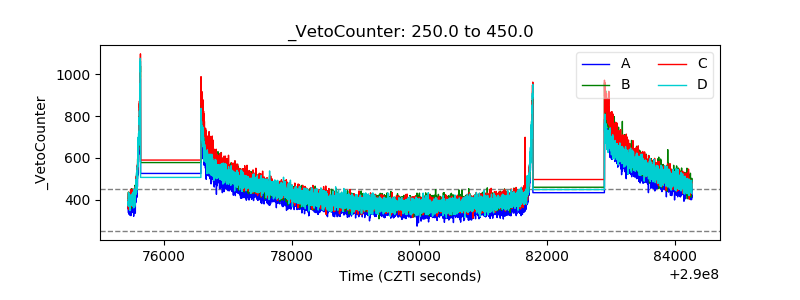 |