| Param | Original file | Final file |
|---|---|---|
| Filename | modeM0/AS1T03_091T01_9000002790cztM0_level2.fits | modeM0/AS1T03_091T01_9000002790cztM0_level2_quad_clean.evt |
| Size (bytes) | 423,216,000 | 422,896,320 |
| Size | 403.6 MB | 403.3 MB |
| Events in quadrant A | 2,573,634 | 2,560,429 |
| Events in quadrant B | 2,494,596 | 2,587,112 |
| Events in quadrant C | 2,511,602 | 2,423,227 |
| Events in quadrant D | 2,168,686 | 2,168,256 |
| Mode SS | |||
|---|---|---|---|
| Quadrant | BADHDUFLAG | Total packets | Discarded packets |
| A | 0 | 910 | 0 |
| B | 0 | 910 | 0 |
| C | 0 | 910 | 0 |
| D | 0 | 910 | 0 |
| Mode M9 | |||
|---|---|---|---|
| Quadrant | BADHDUFLAG | Total packets | Discarded packets |
| A | 0 | 55 | 0 |
| B | 0 | 55 | 0 |
| C | 0 | 55 | 0 |
| D | 0 | 55 | 0 |
| Mode M0 | |||
|---|---|---|---|
| Quadrant | BADHDUFLAG | Total packets | Discarded packets |
| A | 0 | 91833 | 0 |
| B | 0 | 94722 | 0 |
| C | 0 | 94411 | 0 |
| D | 0 | 115152 | 0 |
| Quadrant | Total seconds | Saturated seconds | Saturation percentage |
|---|---|---|---|
| A | 44700 | 299 | 0.668904% |
| B | 44700 | 537 | 1.201342% |
| C | 44700 | 668 | 1.494407% |
| D | 44700 | 1504 | 3.364653% |
Noise dominated data is calculated using 1-second bins in cleaned event files. If a bin has >2000 counts, and if more than 50% of those come from <1% of pixels, then it is considered to be noise-dominated and hence unusable.
| Quadrant | # 1 sec bins | Bins with >0 counts | Bins with >2000 counts | High rate bins dominated by noise | Noise dominated (total time) | Noise dominated (detector-on time) | Marked lightcurve |
|---|---|---|---|---|---|---|---|
| A | 50185 | 44699 | 0 | 0 | 0.00% | 0.00% |  |
| B | 50185 | 44699 | 0 | 0 | 0.00% | 0.00% |  |
| C | 50185 | 44697 | 0 | 0 | 0.00% | 0.00% |  |
| D | 50185 | 44686 | 0 | 0 | 0.00% | 0.00% |  |
Top three noisy pixels from each quadrant. If the there are fewer than three noisy pixels in the level2.evt file, extra rows are filled as -1
| Pixel properties | Quadrant properties | ||||||
|---|---|---|---|---|---|---|---|
| Quadrant | DetID | PixID | Counts | Sigma | Mean | Median | Sigma |
| A | 0 | 29 | 2144 | 9.0 | 670 | 629 | 168.4 |
| A | 7 | 110 | 2137 | 8.96 | 670 | 629 | 168.4 |
| A | 9 | 19 | 1904 | 7.57 | 670 | 629 | 168.4 |
| B | 2 | 9 | 2025 | 10.72 | 658 | 627 | 130.4 |
| B | 2 | 8 | 1749 | 8.6 | 658 | 627 | 130.4 |
| B | 5 | 128 | 1616 | 7.58 | 658 | 627 | 130.4 |
| C | 1 | 80 | 1917 | 7.64 | 662 | 616 | 170.3 |
| C | 1 | 81 | 1854 | 7.27 | 662 | 616 | 170.3 |
| C | 12 | 241 | 1799 | 6.95 | 662 | 616 | 170.3 |
| D | 3 | 14 | 1586 | 6.27 | 616 | 560 | 163.6 |
| D | 10 | 190 | 1577 | 6.22 | 616 | 560 | 163.6 |
| D | 6 | 231 | 1524 | 5.89 | 616 | 560 | 163.6 |
Histogram calculated using DETX and DETY for each event in the final _common_clean file
| Quadrant A | 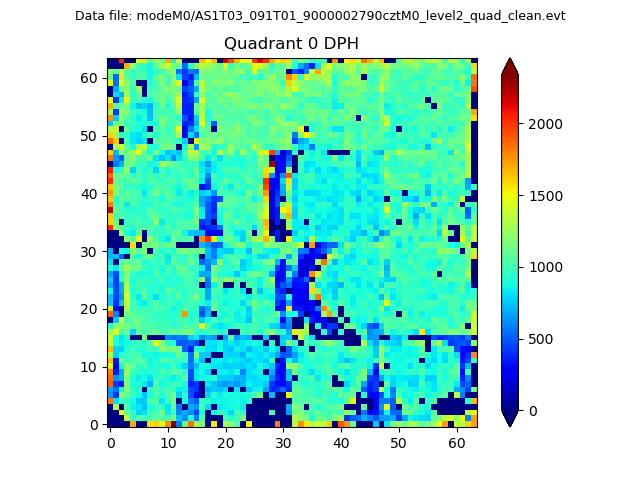 |
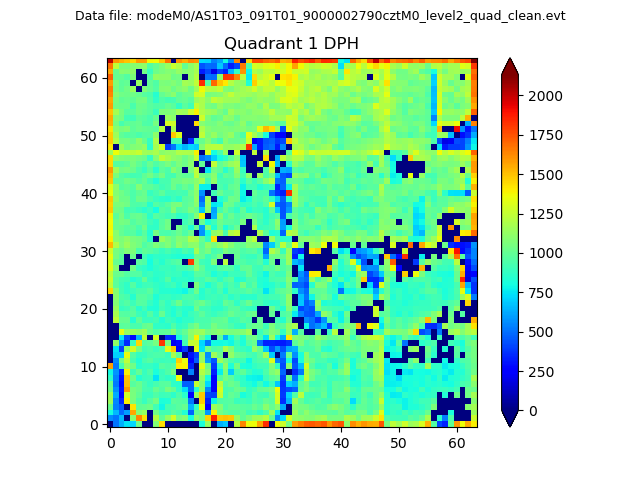 |
Quadrant B |
|---|---|---|---|
| Quadrant D |  |
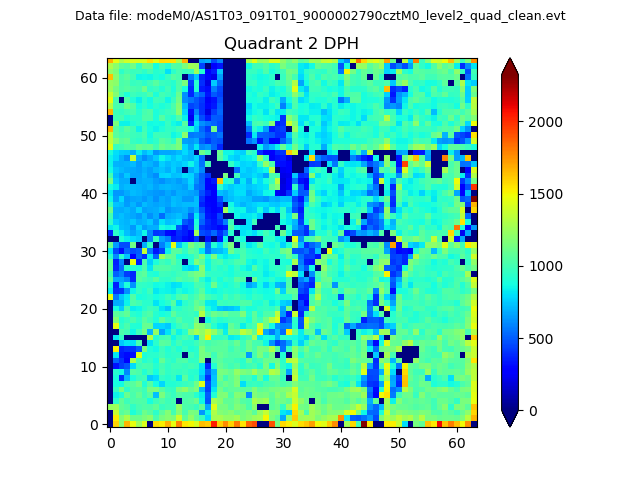 |
Quadrant C |
| Plot type | Count rate plots | Images |
|---|---|---|
| Comparison with Poisson distribution Blue bars denote a histogram of data divided into 1 sec bins. Red curve is a Poisson curve with rate = median count rate of data. |
 |
 |
| Quadrant-wise count rates Data is divided into 100 sec bins |
 |
|
| Module-wise count rates for Quadrant A Data is divided into 100 sec bins |
 |
 |
| Module-wise count rates for Quadrant B Data is divided into 100 sec bins |
 |
 |
| Module-wise count rates for Quadrant C Data is divided into 100 sec bins |
 |
 |
| Module-wise count rates for Quadrant D Data is divided into 100 sec bins |
 |
 |
| Parameter | Plot |
|---|---|
| CZT HV Monitor |  |
| D_VDD |  |
| Temperature 1 |  |
| Veto HV Monitor |  |
| Veto LLD |  |
| Alpha Counter |  |
| _CPM_Rate |  |
| CZT Counter |  |
| +2.5 Volts monitor |  |
| +5 Volts monitor |  |
| _ROLL_ROT |  |
| _Roll_DEC |  |
| _Roll_RA |  |
| Veto Counter |  |