| Param | Original file | Final file |
|---|---|---|
| Filename | modeM0/AS1T03_091T01_9000002790_18673cztM0_level2.evt | modeM0/AS1T03_091T01_9000002790_18673cztM0_level2_quad_clean.evt |
| Size (bytes) | 275,328,000 | 56,433,600 |
| Size | 262.6 MB | 53.8 MB |
| Events in quadrant A | 1,929,334 | 369,284 |
| Events in quadrant B | 1,971,469 | 377,813 |
| Events in quadrant C | 1,935,133 | 350,188 |
| Events in quadrant D | 2,240,207 | 340,257 |
| Mode SS | |||
|---|---|---|---|
| Quadrant | BADHDUFLAG | Total packets | Discarded packets |
| A | 0 | 78 | 0 |
| B | 0 | 78 | 0 |
| C | 0 | 78 | 0 |
| D | 0 | 78 | 0 |
| Mode M9 | |||
|---|---|---|---|
| Quadrant | BADHDUFLAG | Total packets | Discarded packets |
| A | 0 | 13 | 0 |
| B | 0 | 13 | 0 |
| C | 0 | 13 | 0 |
| D | 0 | 13 | 0 |
| Mode M0 | |||
|---|---|---|---|
| Quadrant | BADHDUFLAG | Total packets | Discarded packets |
| A | 0 | 8156 | 1 |
| B | 0 | 8189 | 1 |
| C | 0 | 8167 | 1 |
| D | 0 | 9175 | 1 |
| Quadrant | Total seconds | Saturated seconds | Saturation percentage |
|---|---|---|---|
| A | 3840 | 49 | 1.276042% |
| B | 3840 | 53 | 1.380208% |
| C | 3840 | 65 | 1.692708% |
| D | 3840 | 41 | 1.067708% |
Noise dominated data is calculated using 1-second bins in cleaned event files. If a bin has >2000 counts, and if more than 50% of those come from <1% of pixels, then it is considered to be noise-dominated and hence unusable.
| Quadrant | # 1 sec bins | Bins with >0 counts | Bins with >2000 counts | High rate bins dominated by noise | Noise dominated (total time) | Noise dominated (detector-on time) | Marked lightcurve |
|---|---|---|---|---|---|---|---|
| A | 5150 | 3841 | 2 | 2 | 0.04% | 0.05% | 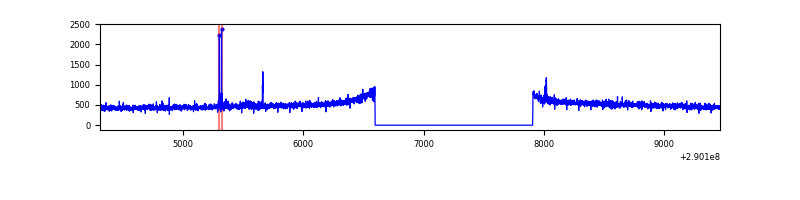 |
| B | 5150 | 3841 | 3 | 3 | 0.06% | 0.08% | 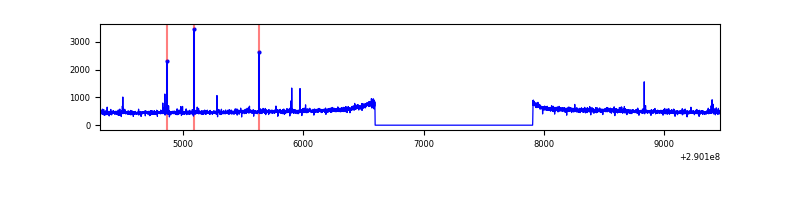 |
| C | 5150 | 3841 | 0 | 0 | 0.00% | 0.00% | 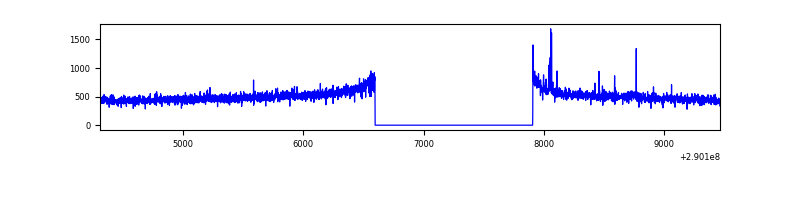 |
| D | 5150 | 3841 | 22 | 22 | 0.43% | 0.57% | 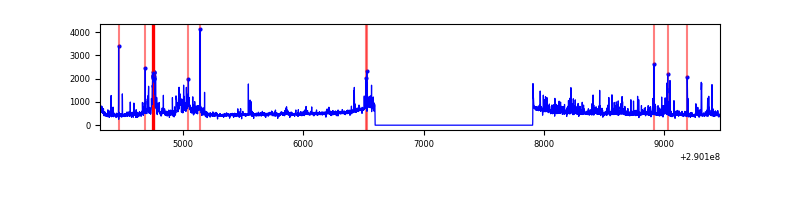 |
Top three noisy pixels from each quadrant. If the there are fewer than three noisy pixels in the level2.evt file, extra rows are filled as -1
| Pixel properties | Quadrant properties | ||||||
|---|---|---|---|---|---|---|---|
| Quadrant | DetID | PixID | Counts | Sigma | Mean | Median | Sigma |
| A | 4 | 2 | 13103 | 125.82 | 494 | 483 | 100.3 |
| A | 6 | 16 | 7774 | 72.69 | 494 | 483 | 100.3 |
| A | 13 | 254 | 6445 | 59.44 | 494 | 483 | 100.3 |
| B | 4 | 80 | 15446 | 158.36 | 496 | 485 | 94.5 |
| B | 12 | 111 | 10863 | 109.85 | 496 | 485 | 94.5 |
| B | 11 | 111 | 9535 | 95.79 | 496 | 485 | 94.5 |
| C | 14 | 238 | 73601 | 669.5 | 467 | 471 | 109.2 |
| C | 3 | 233 | 36550 | 330.3 | 467 | 471 | 109.2 |
| C | 13 | 61 | 3273 | 25.65 | 467 | 471 | 109.2 |
| D | 1 | 52 | 314658 | 2746.48 | 473 | 458 | 114.4 |
| D | 7 | 238 | 118620 | 1032.88 | 473 | 458 | 114.4 |
| D | 2 | 234 | 17203 | 146.37 | 473 | 458 | 114.4 |
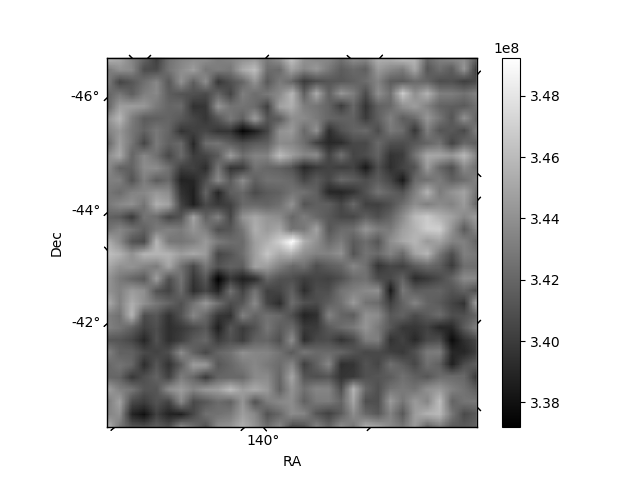
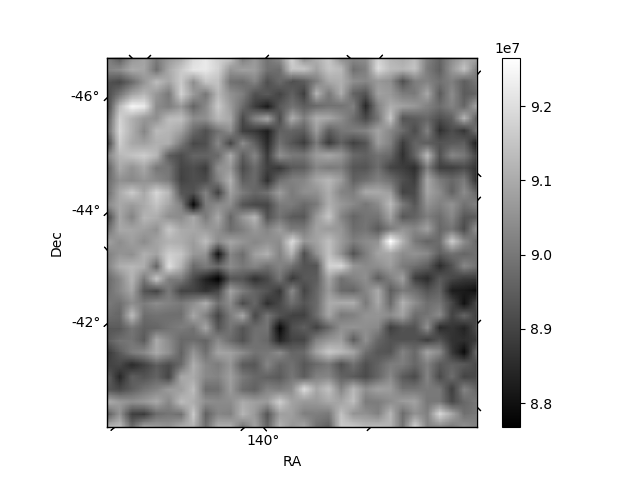
Histogram calculated using DETX and DETY for each event in the final _common_clean file
| Quadrant A | 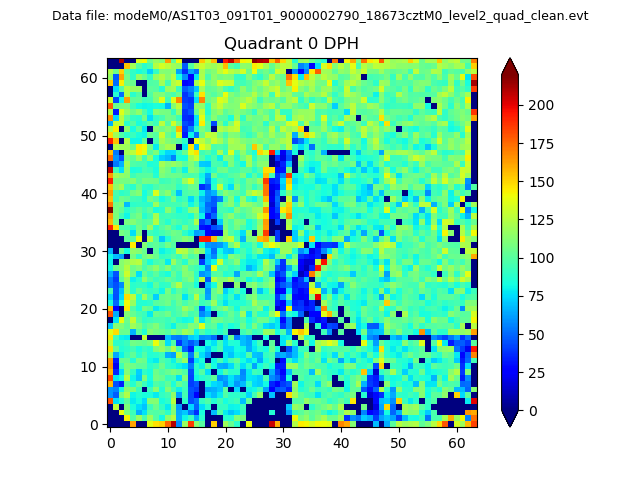 |
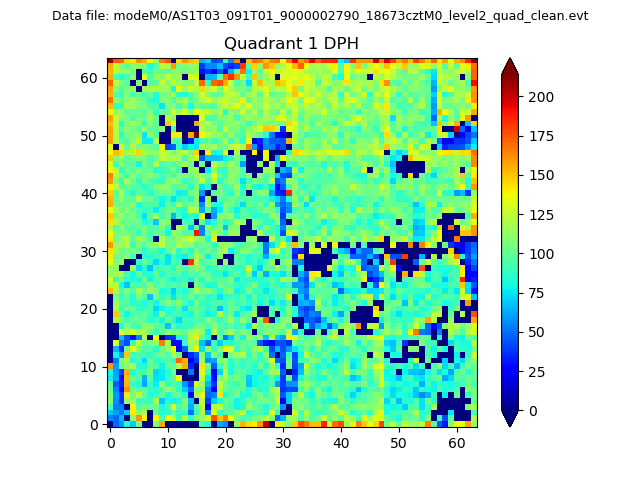 |
Quadrant B |
|---|---|---|---|
| Quadrant D | 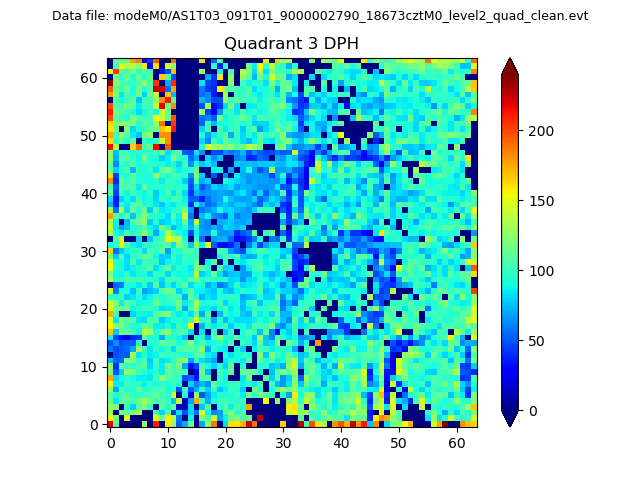 |
 |
Quadrant C |
| Plot type | Count rate plots | Images |
|---|---|---|
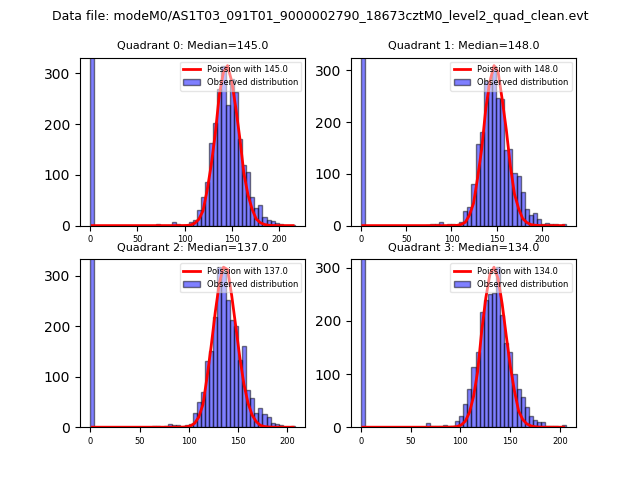
| Comparison with Poisson distribution Blue bars denote a histogram of data divided into 1 sec bins. Red curve is a Poisson curve with rate = median count rate of data. |
 |
 |
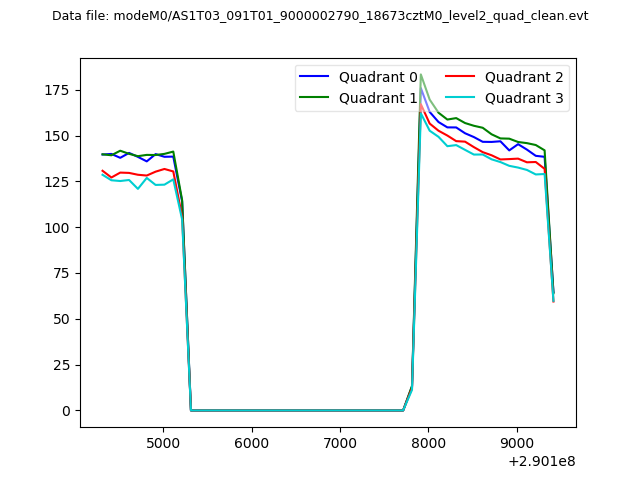
| Quadrant-wise count rates Data is divided into 100 sec bins |
 |
|
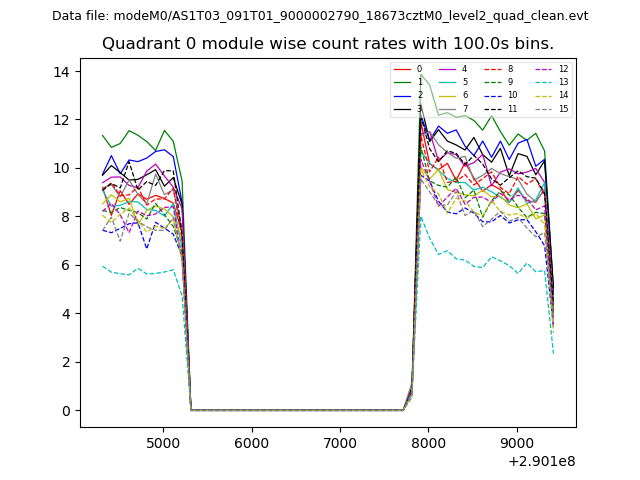
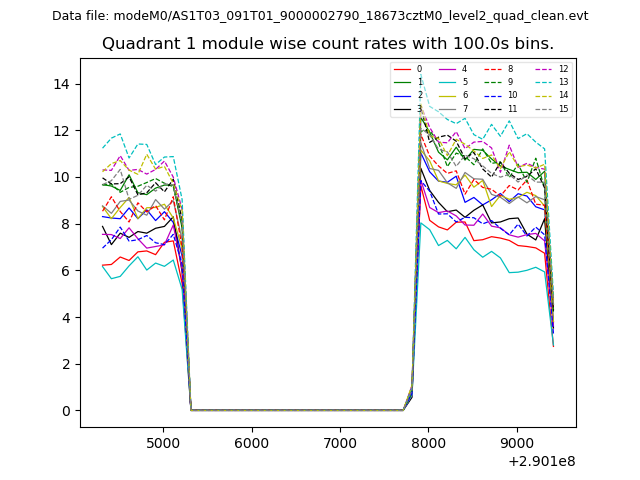
| Module-wise count rates for Quadrant A Data is divided into 100 sec bins |
 |
 |
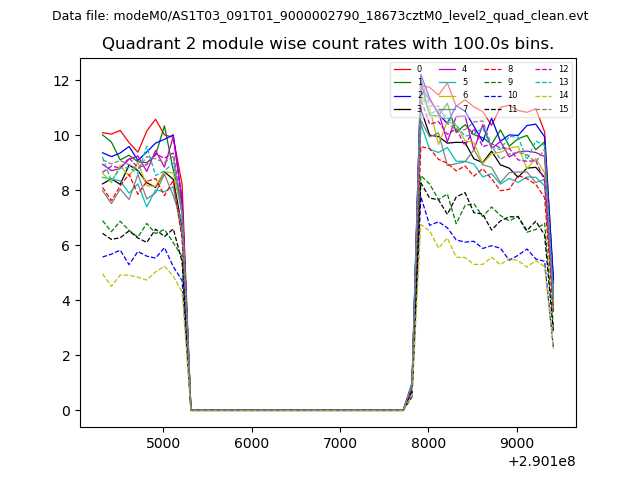
| Module-wise count rates for Quadrant B Data is divided into 100 sec bins |
 |
 |
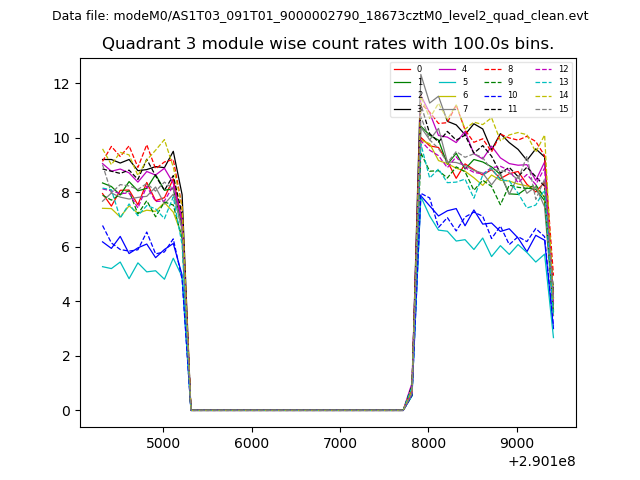
| Module-wise count rates for Quadrant C Data is divided into 100 sec bins |
 |
 |
| Module-wise count rates for Quadrant D Data is divided into 100 sec bins |
 |
 |
| Parameter | Plot |
|---|---|
| CZT HV Monitor | 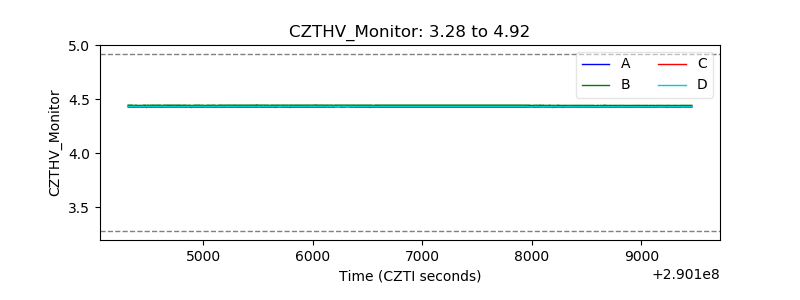 |
| D_VDD | 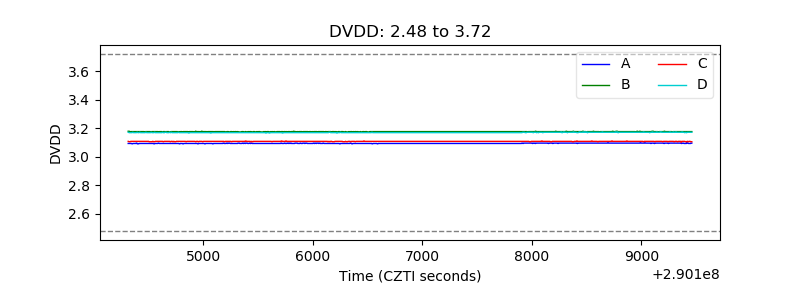 |
| Temperature 1 | 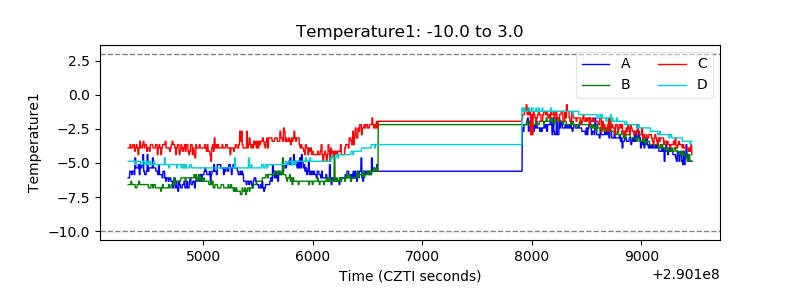 |
| Veto HV Monitor | 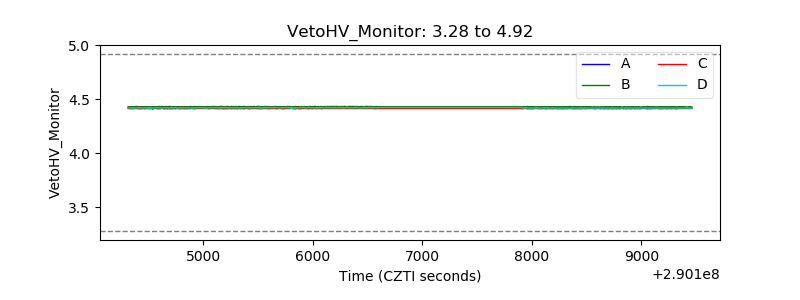 |
| Veto LLD | 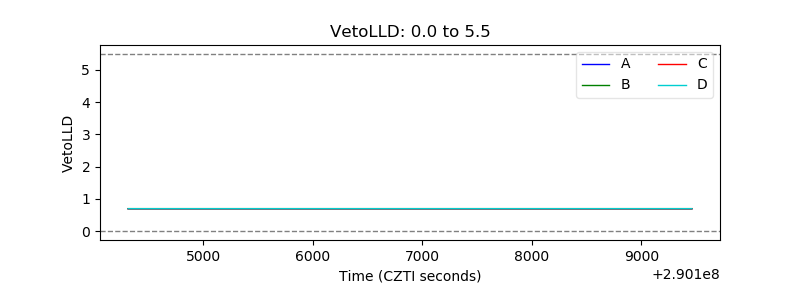 |
| Alpha Counter | 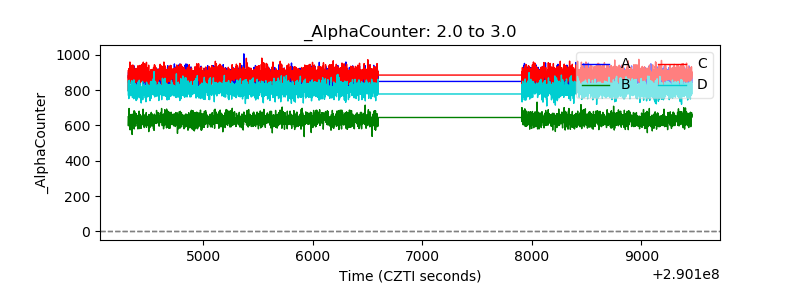 |
| _CPM_Rate | 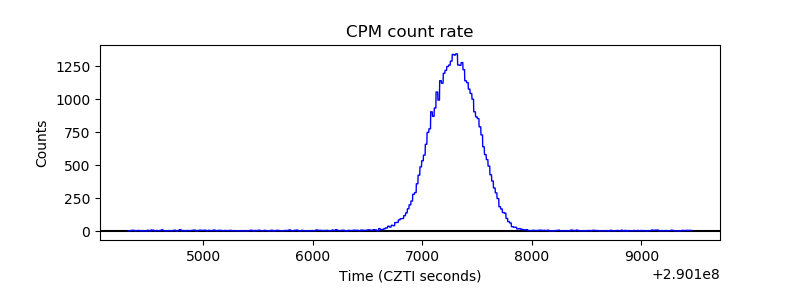 |
| CZT Counter | 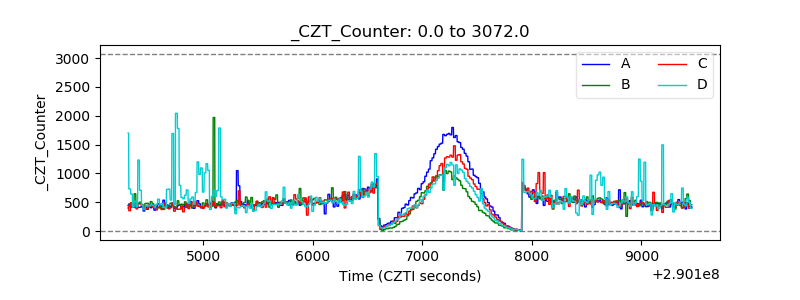 |
| +2.5 Volts monitor |  |
| +5 Volts monitor | 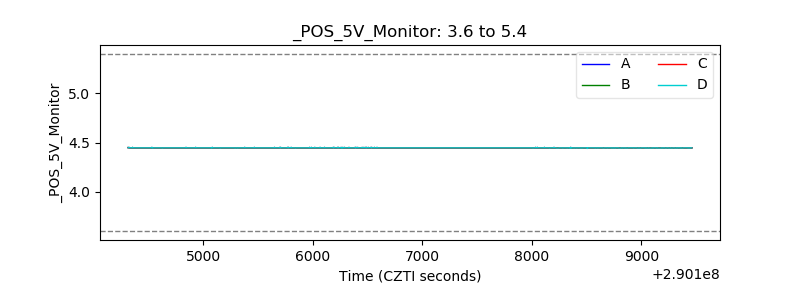 |
| _ROLL_ROT | 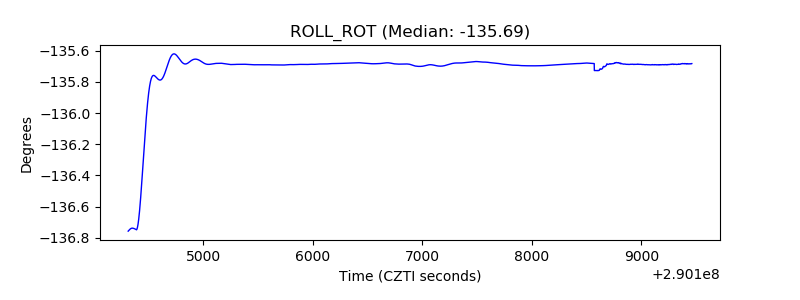 |
| _Roll_DEC |  |
| _Roll_RA | 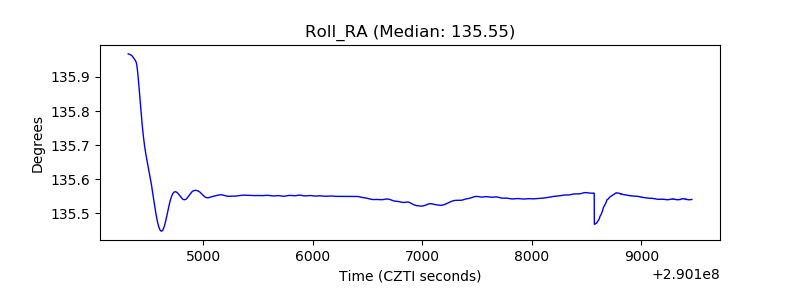 |
| Veto Counter | 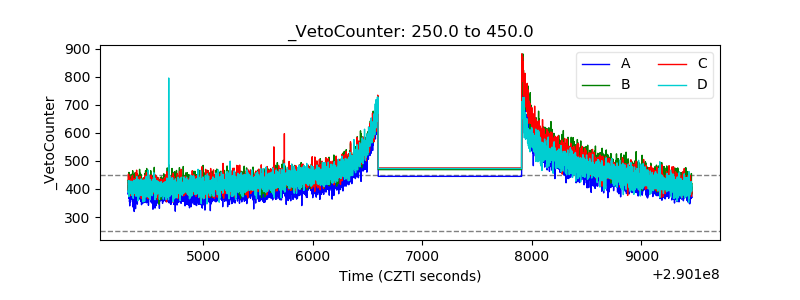 |