| Param | Original file | Final file |
|---|---|---|
| Filename | modeM0/AS1T03_091T01_9000002790_18675cztM0_level2.evt | modeM0/AS1T03_091T01_9000002790_18675cztM0_level2_quad_clean.evt |
| Size (bytes) | 479,759,040 | 102,104,640 |
| Size | 457.5 MB | 97.4 MB |
| Events in quadrant A | 3,231,905 | 668,599 |
| Events in quadrant B | 3,644,578 | 678,942 |
| Events in quadrant C | 3,583,373 | 641,984 |
| Events in quadrant D | 3,602,379 | 623,222 |
| Mode SS | |||
|---|---|---|---|
| Quadrant | BADHDUFLAG | Total packets | Discarded packets |
| A | 0 | 140 | 0 |
| B | 0 | 140 | 0 |
| C | 0 | 140 | 0 |
| D | 0 | 140 | 0 |
| Mode M9 | |||
|---|---|---|---|
| Quadrant | BADHDUFLAG | Total packets | Discarded packets |
| A | 0 | 12 | 0 |
| B | 0 | 13 | 0 |
| C | 0 | 13 | 0 |
| D | 0 | 13 | 0 |
| Mode M0 | |||
|---|---|---|---|
| Quadrant | BADHDUFLAG | Total packets | Discarded packets |
| A | 0 | 14159 | 2 |
| B | 0 | 15267 | 2 |
| C | 0 | 15187 | 2 |
| D | 0 | 15458 | 2 |
| Quadrant | Total seconds | Saturated seconds | Saturation percentage |
|---|---|---|---|
| A | 6880 | 26 | 0.377907% |
| B | 6880 | 84 | 1.220930% |
| C | 6880 | 92 | 1.337209% |
| D | 6880 | 49 | 0.712209% |
Noise dominated data is calculated using 1-second bins in cleaned event files. If a bin has >2000 counts, and if more than 50% of those come from <1% of pixels, then it is considered to be noise-dominated and hence unusable.
| Quadrant | # 1 sec bins | Bins with >0 counts | Bins with >2000 counts | High rate bins dominated by noise | Noise dominated (total time) | Noise dominated (detector-on time) | Marked lightcurve |
|---|---|---|---|---|---|---|---|
| A | 7610 | 6881 | 0 | 0 | 0.00% | 0.00% | 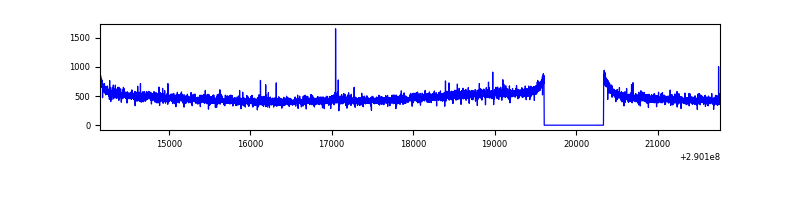 |
| B | 7610 | 6881 | 28 | 28 | 0.37% | 0.41% | 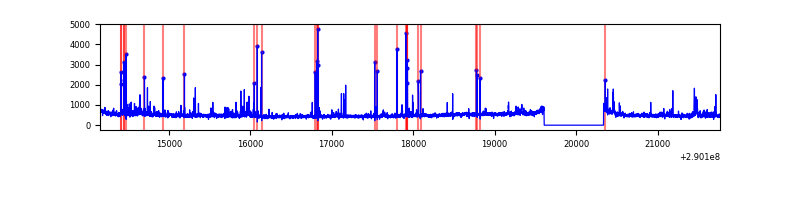 |
| C | 7610 | 6881 | 12 | 12 | 0.16% | 0.17% | 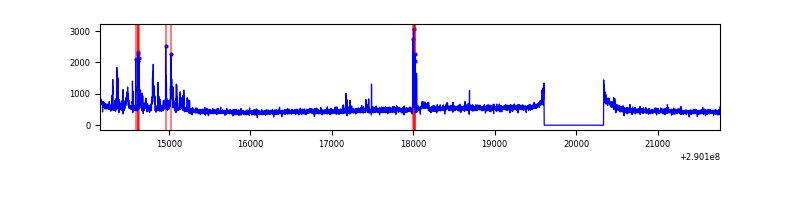 |
| D | 7610 | 6881 | 65 | 65 | 0.85% | 0.94% | 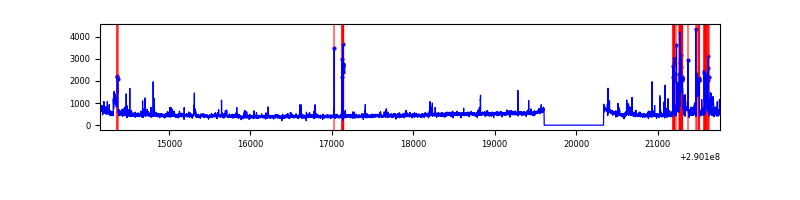 |
Top three noisy pixels from each quadrant. If the there are fewer than three noisy pixels in the level2.evt file, extra rows are filled as -1
| Pixel properties | Quadrant properties | ||||||
|---|---|---|---|---|---|---|---|
| Quadrant | DetID | PixID | Counts | Sigma | Mean | Median | Sigma |
| A | 13 | 254 | 10997 | 60.14 | 834 | 816 | 169.3 |
| A | 11 | 29 | 8468 | 45.2 | 834 | 816 | 169.3 |
| A | 0 | 226 | 7197 | 37.69 | 834 | 816 | 169.3 |
| B | 4 | 80 | 82209 | 512.89 | 836 | 816 | 158.7 |
| B | 0 | 244 | 68478 | 426.36 | 836 | 816 | 158.7 |
| B | 7 | 220 | 63487 | 394.91 | 836 | 816 | 158.7 |
| C | 9 | 54 | 240407 | 1295.39 | 793 | 799 | 185.0 |
| C | 3 | 233 | 130099 | 699.04 | 793 | 799 | 185.0 |
| C | 14 | 238 | 124401 | 668.23 | 793 | 799 | 185.0 |
| D | 1 | 52 | 471167 | 2394.82 | 799 | 776 | 196.4 |
| D | 7 | 238 | 36586 | 182.31 | 799 | 776 | 196.4 |
| D | 7 | 96 | 35085 | 174.67 | 799 | 776 | 196.4 |
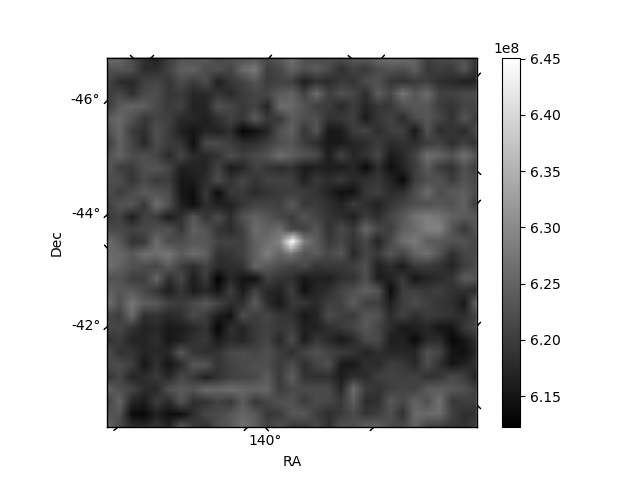
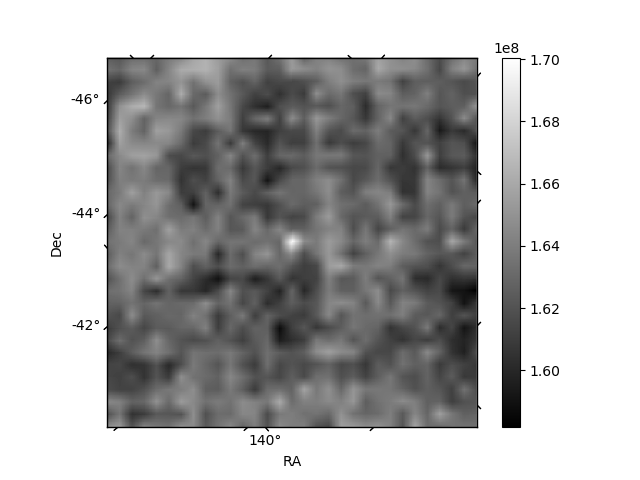
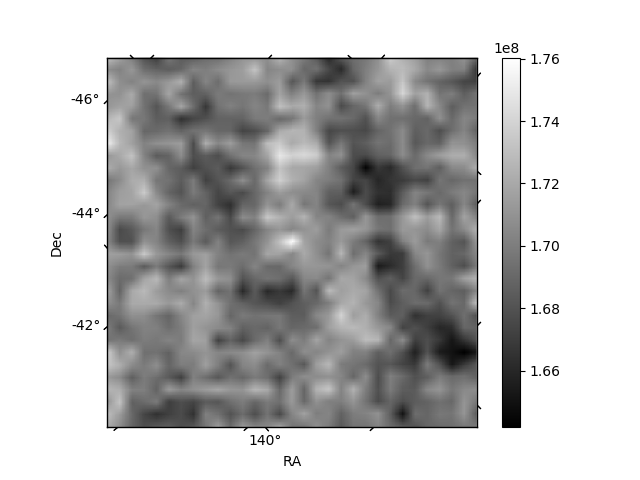
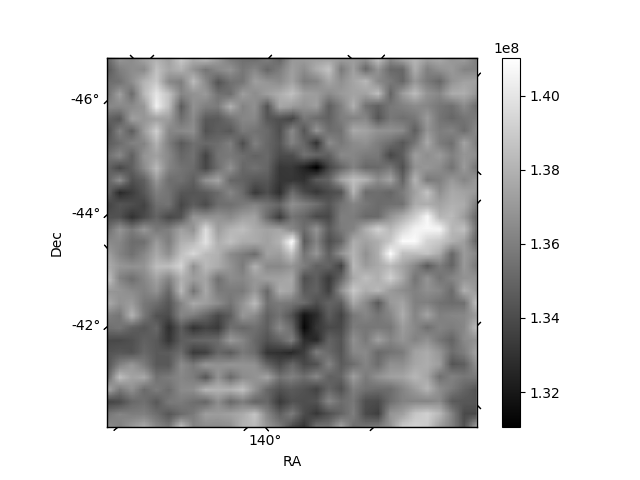
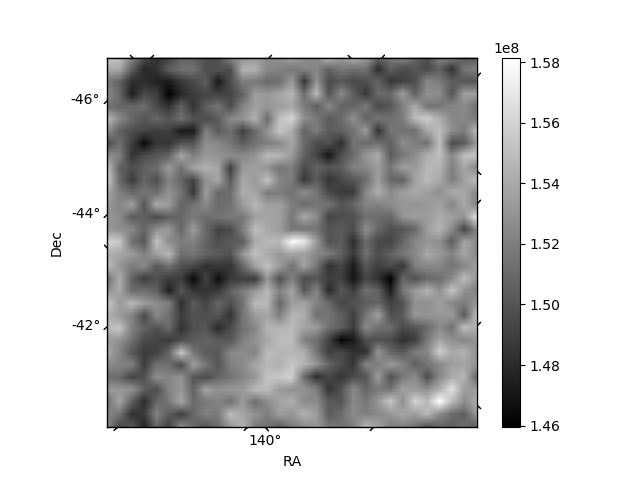
Histogram calculated using DETX and DETY for each event in the final _common_clean file
| Quadrant A | 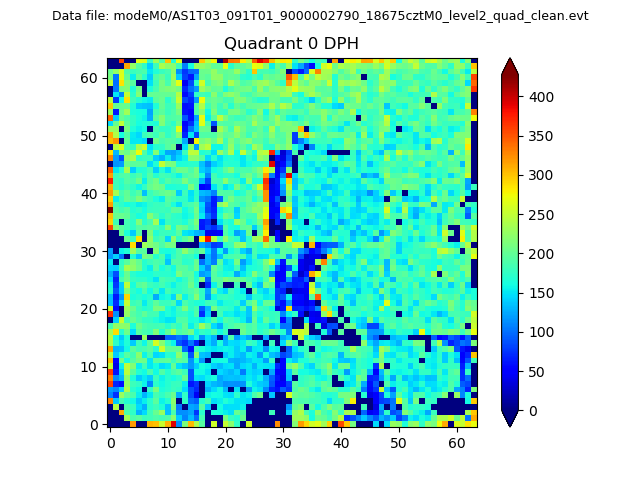 |
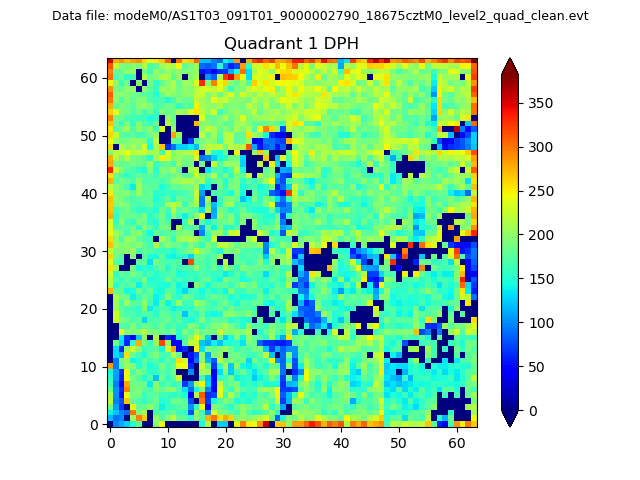 |
Quadrant B |
|---|---|---|---|
| Quadrant D | 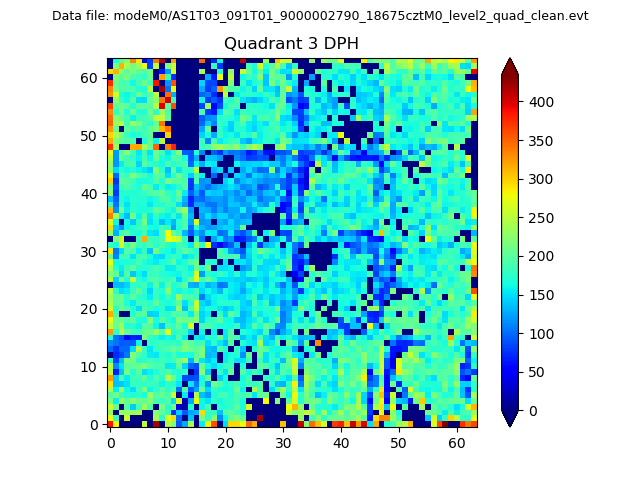 |
 |
Quadrant C |
| Plot type | Count rate plots | Images |
|---|---|---|
| Comparison with Poisson distribution Blue bars denote a histogram of data divided into 1 sec bins. Red curve is a Poisson curve with rate = median count rate of data. |
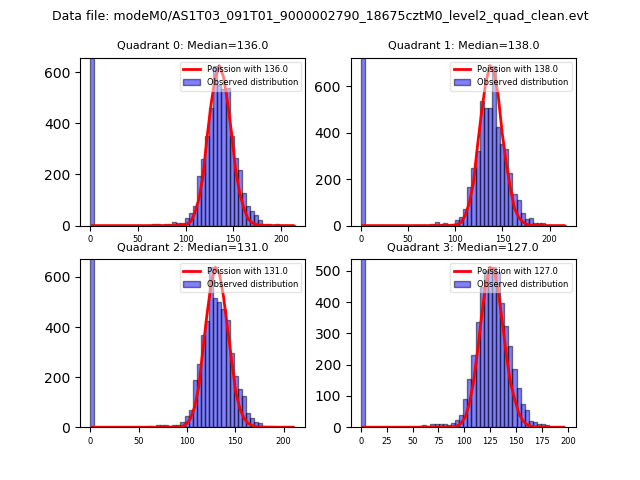 |
 |
| Quadrant-wise count rates Data is divided into 100 sec bins |
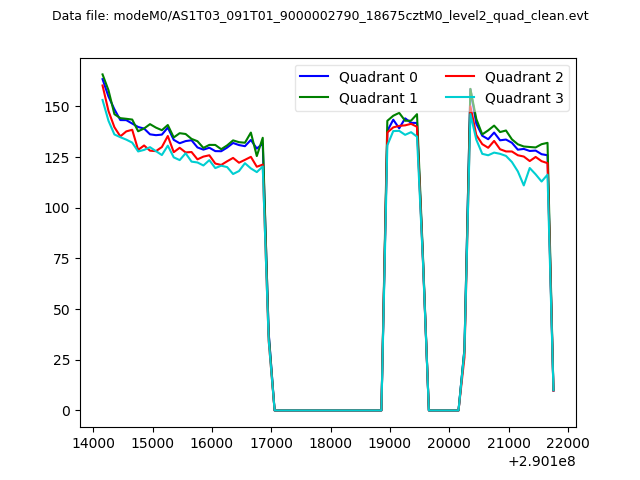 |
|
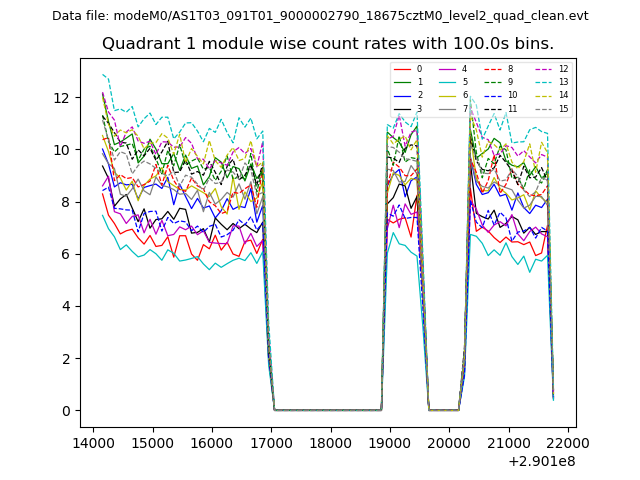
| Module-wise count rates for Quadrant A Data is divided into 100 sec bins |
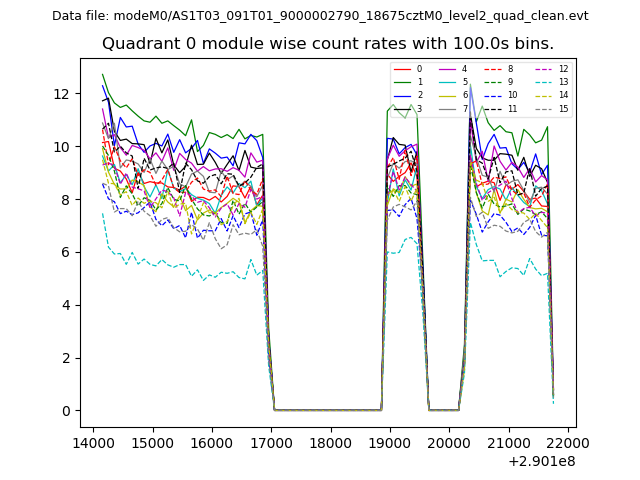 |
 |
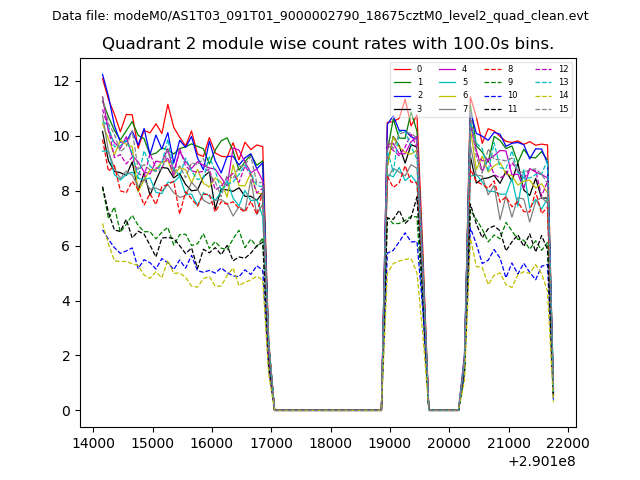
| Module-wise count rates for Quadrant B Data is divided into 100 sec bins |
 |
 |
| Module-wise count rates for Quadrant C Data is divided into 100 sec bins |
 |
 |
| Module-wise count rates for Quadrant D Data is divided into 100 sec bins |
 |
 |
| Parameter | Plot |
|---|---|
| CZT HV Monitor | 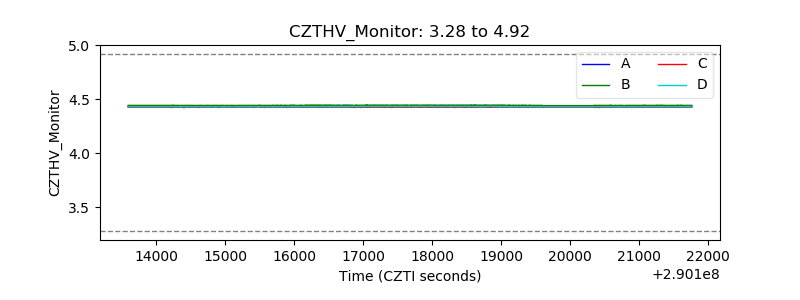 |
| D_VDD | 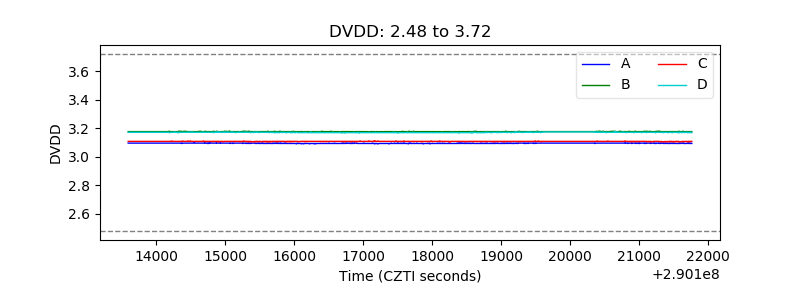 |
| Temperature 1 |  |
| Veto HV Monitor |  |
| Veto LLD | 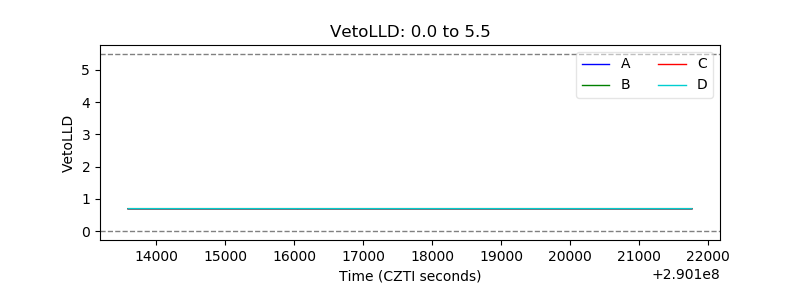 |
| Alpha Counter | 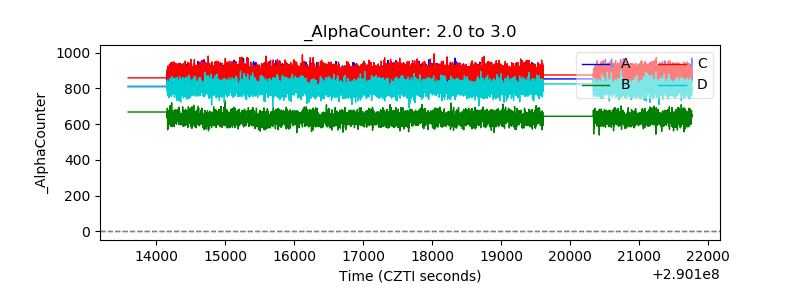 |
| _CPM_Rate | 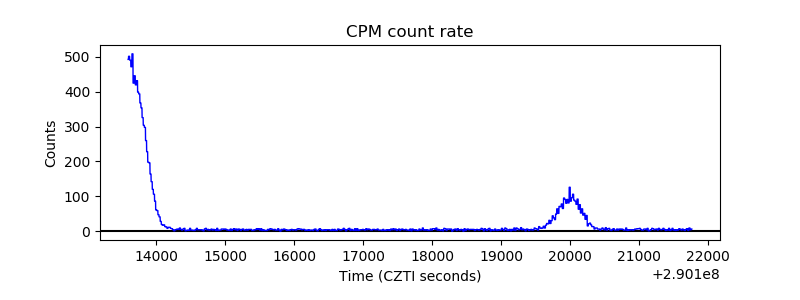 |
| CZT Counter | 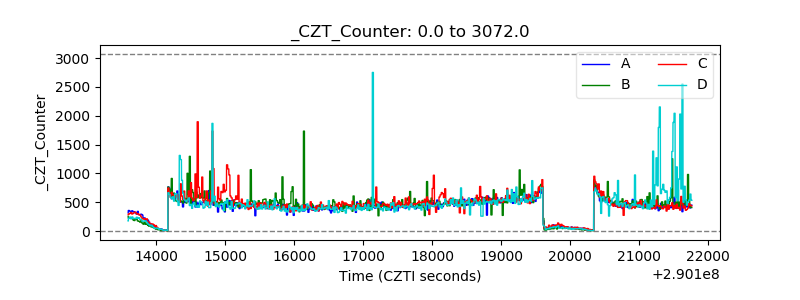 |
| +2.5 Volts monitor |  |
| +5 Volts monitor |  |
| _ROLL_ROT |  |
| _Roll_DEC | 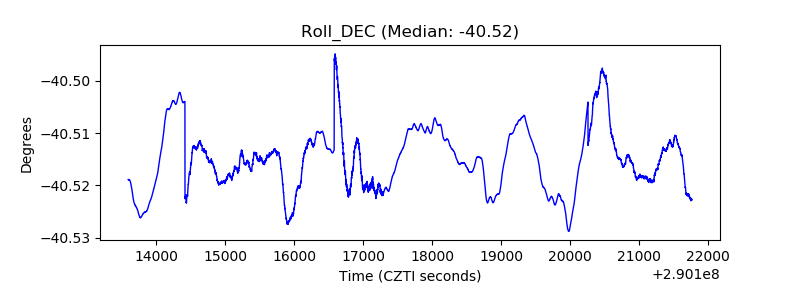 |
| _Roll_RA | 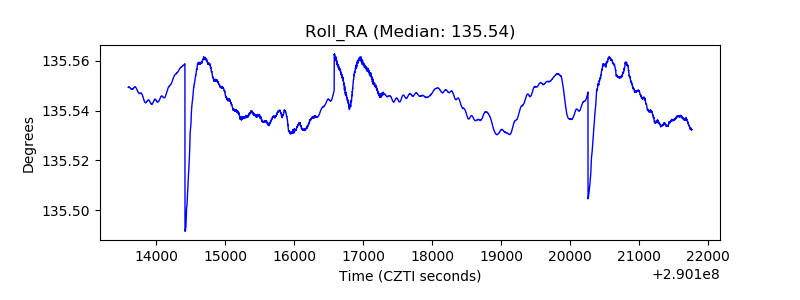 |
| Veto Counter |  |