| Param | Original file | Final file |
|---|---|---|
| Filename | modeM0/AS1T03_091T01_9000002790_18677cztM0_level2.evt | modeM0/AS1T03_091T01_9000002790_18677cztM0_level2_quad_clean.evt |
| Size (bytes) | 638,928,000 | 115,963,200 |
| Size | 609.3 MB | 110.6 MB |
| Events in quadrant A | 3,623,743 | 766,616 |
| Events in quadrant B | 3,965,208 | 780,718 |
| Events in quadrant C | 3,847,037 | 732,549 |
| Events in quadrant D | 7,387,196 | 690,903 |
| Mode SS | |||
|---|---|---|---|
| Quadrant | BADHDUFLAG | Total packets | Discarded packets |
| A | 0 | 158 | 0 |
| B | 0 | 158 | 0 |
| C | 0 | 158 | 0 |
| D | 0 | 158 | 0 |
| Mode M9 | |||
|---|---|---|---|
| Quadrant | BADHDUFLAG | Total packets | Discarded packets |
| A | 0 | 7 | 0 |
| B | 0 | 7 | 0 |
| C | 0 | 7 | 0 |
| D | 0 | 7 | 0 |
| Mode M0 | |||
|---|---|---|---|
| Quadrant | BADHDUFLAG | Total packets | Discarded packets |
| A | 0 | 16017 | 2 |
| B | 0 | 16857 | 2 |
| C | 0 | 16551 | 2 |
| D | 0 | 27408 | 2 |
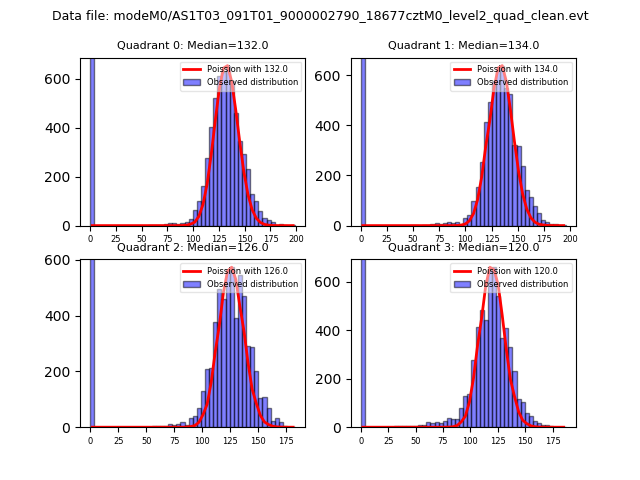
| Quadrant | Total seconds | Saturated seconds | Saturation percentage |
|---|---|---|---|
| A | 7782 | 55 | 0.706759% |
| B | 7783 | 152 | 1.952974% |
| C | 7783 | 159 | 2.042914% |
| D | 7783 | 797 | 10.240267% |
Noise dominated data is calculated using 1-second bins in cleaned event files. If a bin has >2000 counts, and if more than 50% of those come from <1% of pixels, then it is considered to be noise-dominated and hence unusable.
| Quadrant | # 1 sec bins | Bins with >0 counts | Bins with >2000 counts | High rate bins dominated by noise | Noise dominated (total time) | Noise dominated (detector-on time) | Marked lightcurve |
|---|---|---|---|---|---|---|---|
| A | 8392 | 7784 | 0 | 0 | 0.00% | 0.00% | 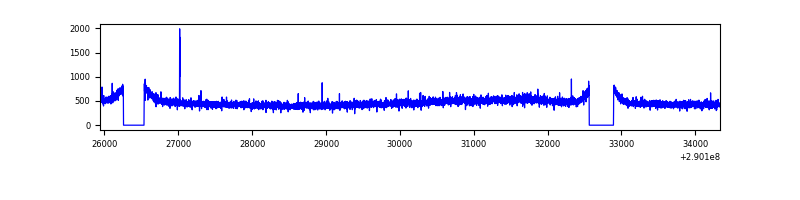 |
| B | 8393 | 7785 | 26 | 26 | 0.31% | 0.33% | 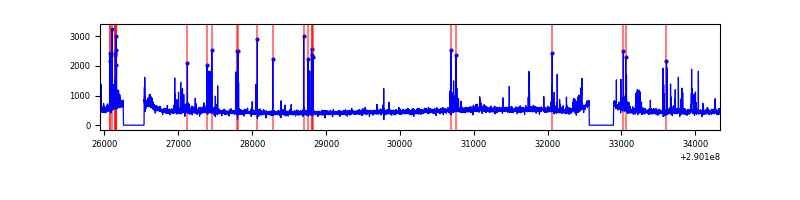 |
| C | 8393 | 7785 | 19 | 19 | 0.23% | 0.24% | 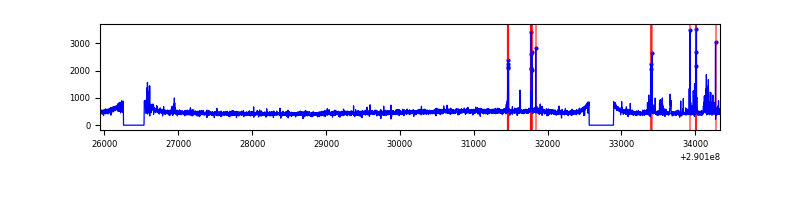 |
| D | 8393 | 7785 | 589 | 589 | 7.02% | 7.57% | 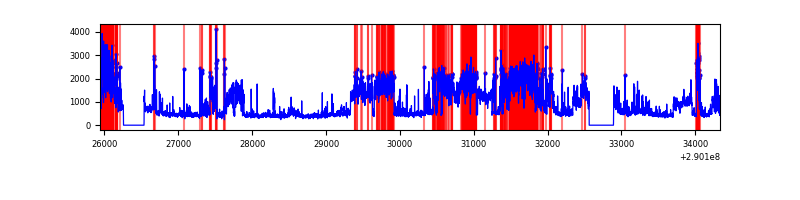 |
Top three noisy pixels from each quadrant. If the there are fewer than three noisy pixels in the level2.evt file, extra rows are filled as -1
| Pixel properties | Quadrant properties | ||||||
|---|---|---|---|---|---|---|---|
| Quadrant | DetID | PixID | Counts | Sigma | Mean | Median | Sigma |
| A | 13 | 254 | 12638 | 61.53 | 936 | 917 | 190.5 |
| A | 0 | 226 | 8143 | 37.93 | 936 | 917 | 190.5 |
| A | 3 | 137 | 7625 | 35.21 | 936 | 917 | 190.5 |
| B | 0 | 197 | 90560 | 494.94 | 939 | 917 | 181.1 |
| B | 7 | 220 | 77687 | 423.86 | 939 | 917 | 181.1 |
| B | 4 | 80 | 48824 | 264.5 | 939 | 917 | 181.1 |
| C | 3 | 233 | 171271 | 813.09 | 892 | 900 | 209.5 |
| C | 14 | 238 | 140283 | 665.2 | 892 | 900 | 209.5 |
| C | 9 | 54 | 52510 | 246.3 | 892 | 900 | 209.5 |
| D | 1 | 52 | 3468483 | 16113.25 | 880 | 854 | 215.2 |
| D | 7 | 238 | 294155 | 1362.9 | 880 | 854 | 215.2 |
| D | 12 | 110 | 255030 | 1181.1 | 880 | 854 | 215.2 |
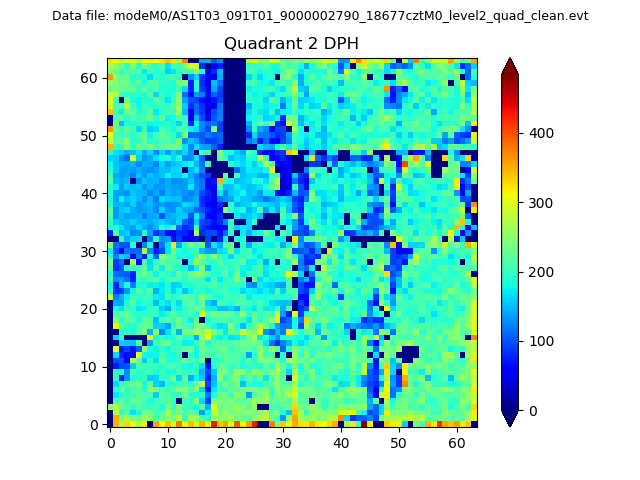
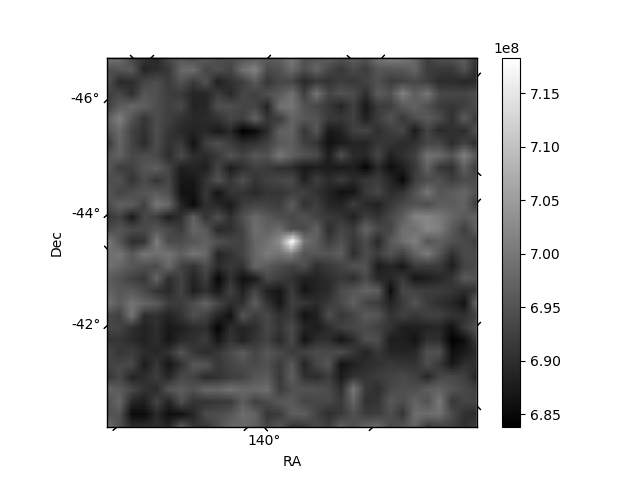
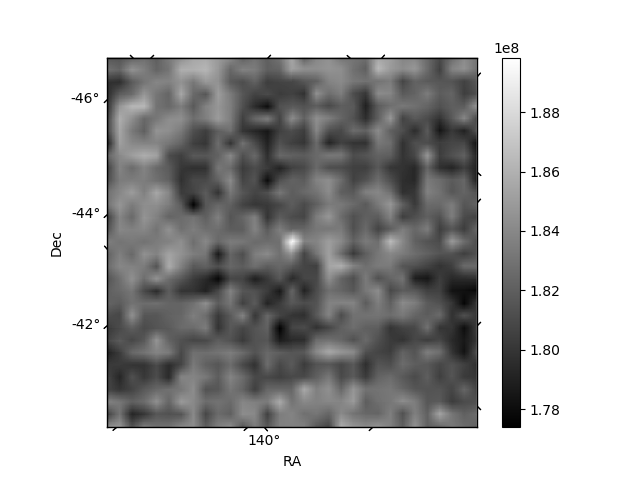
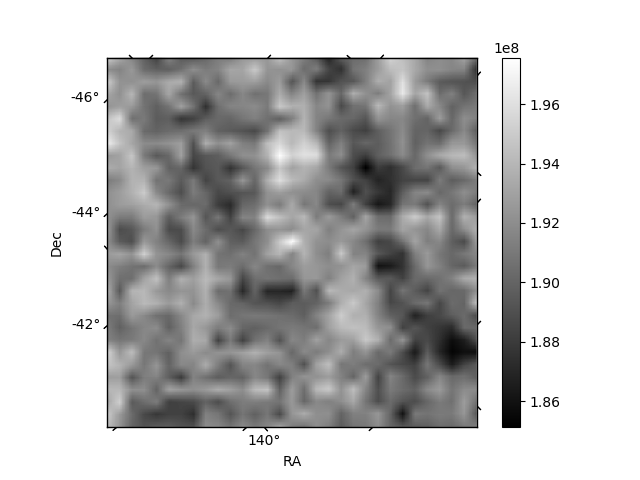
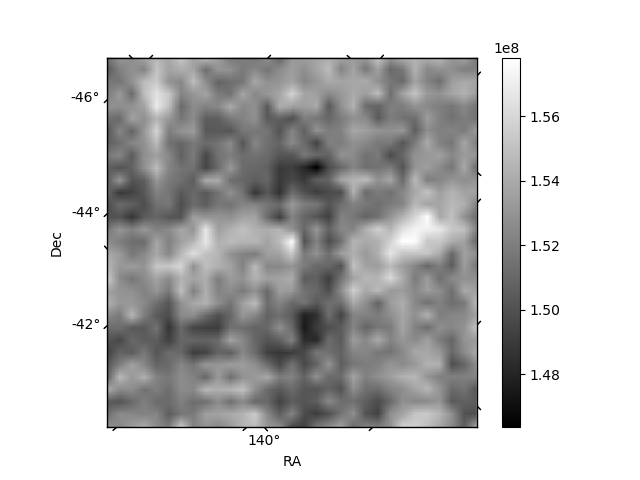
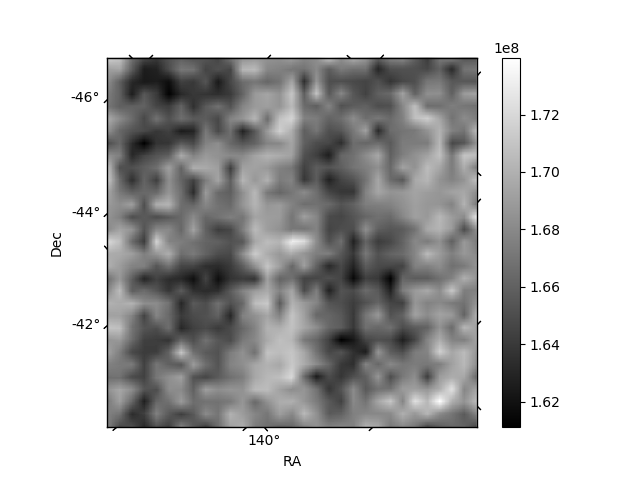
Histogram calculated using DETX and DETY for each event in the final _common_clean file
| Quadrant A | 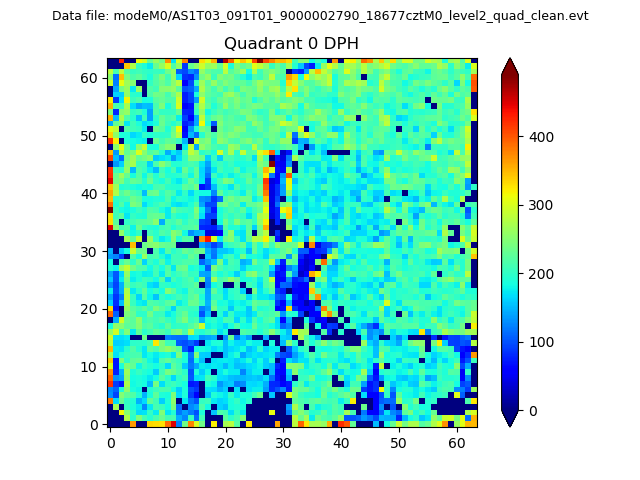 |
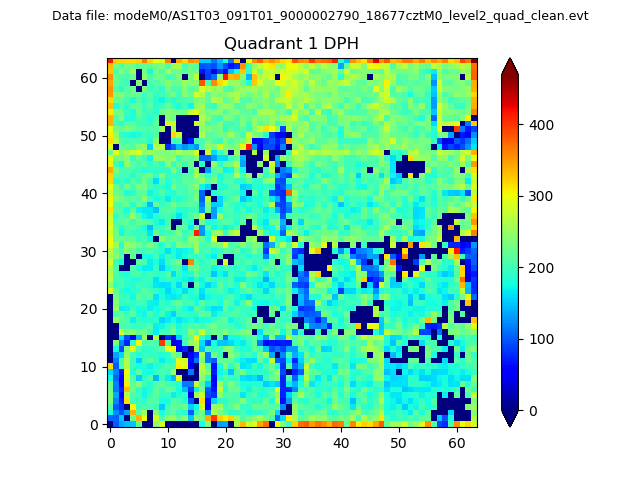 |
Quadrant B |
|---|---|---|---|
| Quadrant D | 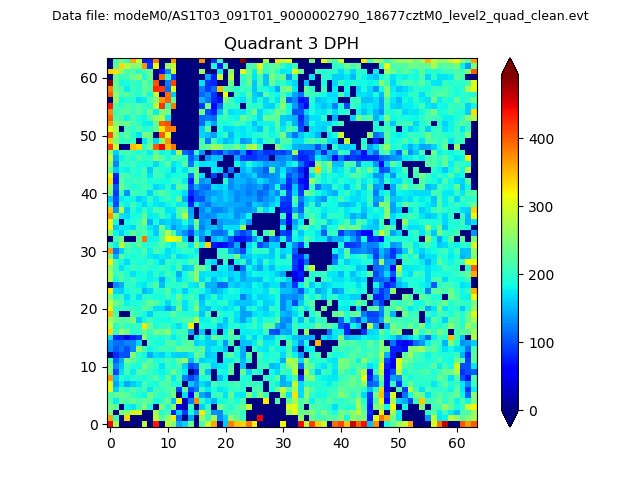 |
 |
Quadrant C |
| Plot type | Count rate plots | Images |
|---|---|---|
| Comparison with Poisson distribution Blue bars denote a histogram of data divided into 1 sec bins. Red curve is a Poisson curve with rate = median count rate of data. |
 |
 |
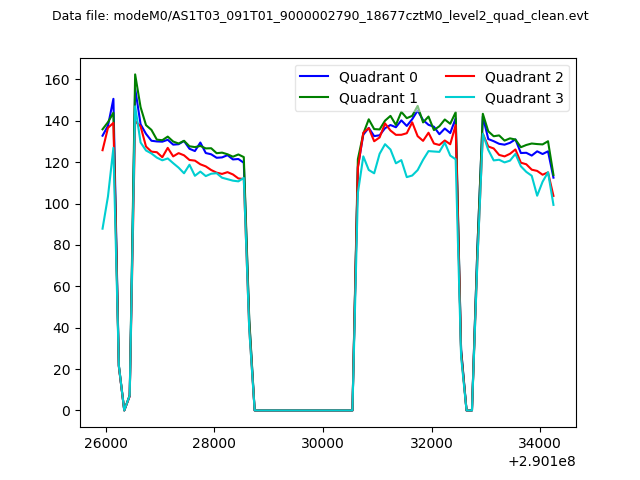
| Quadrant-wise count rates Data is divided into 100 sec bins |
 |
|
| Module-wise count rates for Quadrant A Data is divided into 100 sec bins |
 |
 |
| Module-wise count rates for Quadrant B Data is divided into 100 sec bins |
 |
 |
| Module-wise count rates for Quadrant C Data is divided into 100 sec bins |
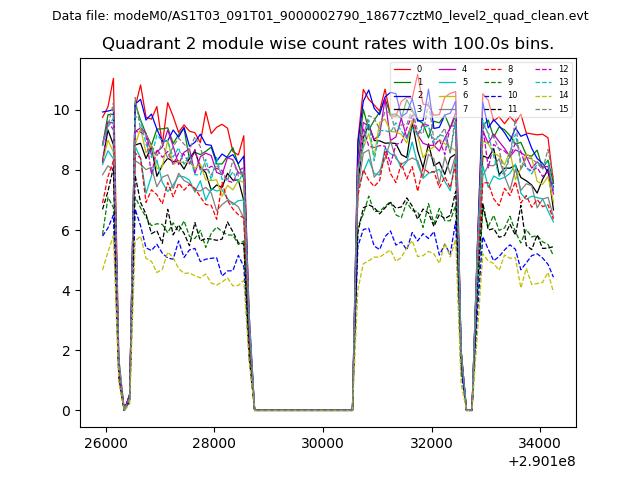 |
 |
| Module-wise count rates for Quadrant D Data is divided into 100 sec bins |
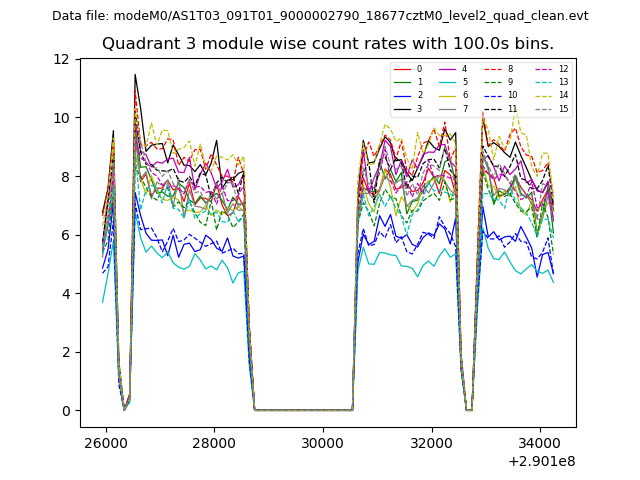 |
 |
| Parameter | Plot |
|---|---|
| CZT HV Monitor | 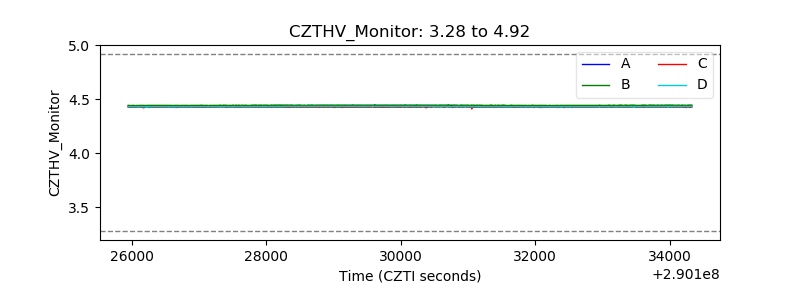 |
| D_VDD | 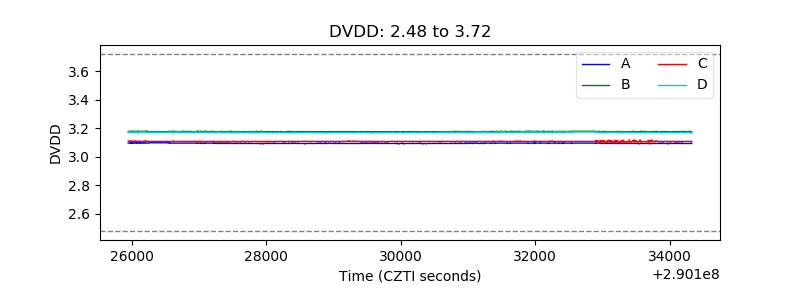 |
| Temperature 1 | 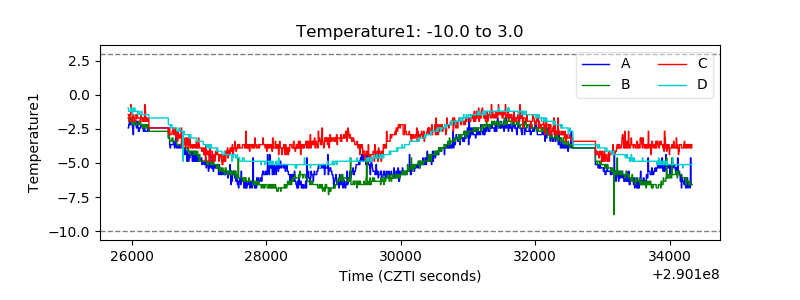 |
| Veto HV Monitor | 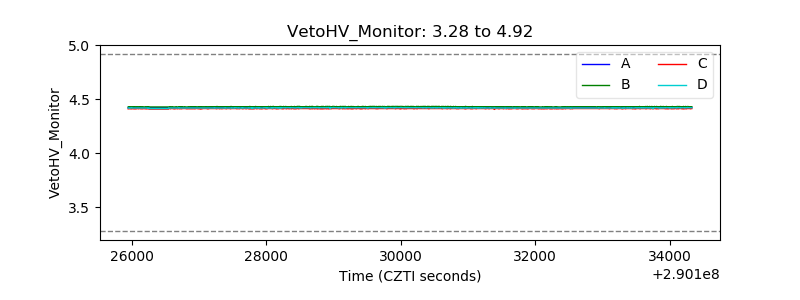 |
| Veto LLD | 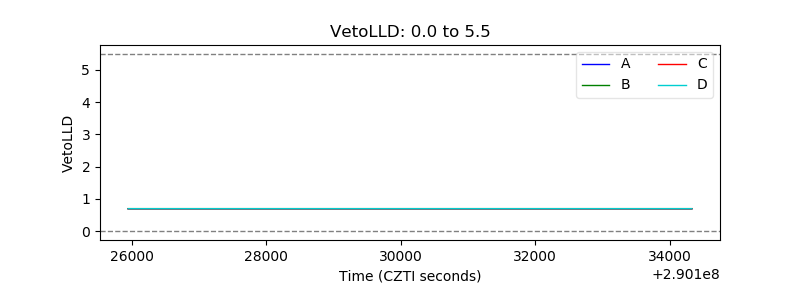 |
| Alpha Counter | 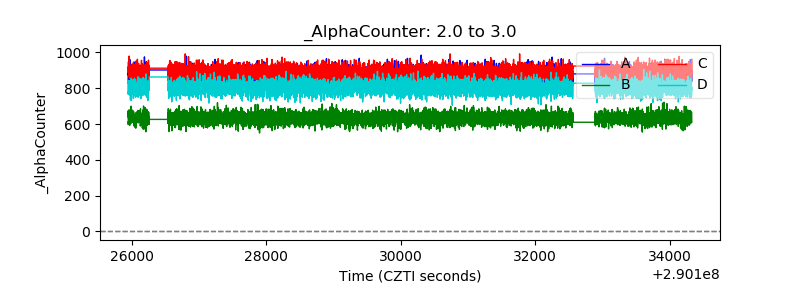 |
| _CPM_Rate | 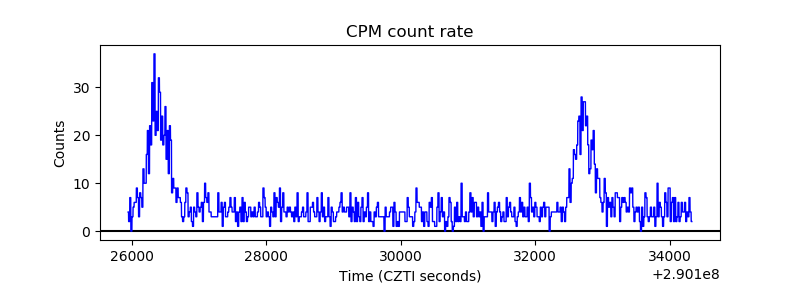 |
| CZT Counter | 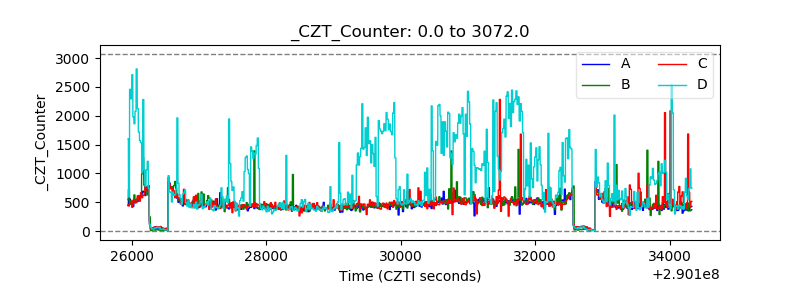 |
| +2.5 Volts monitor |  |
| +5 Volts monitor | 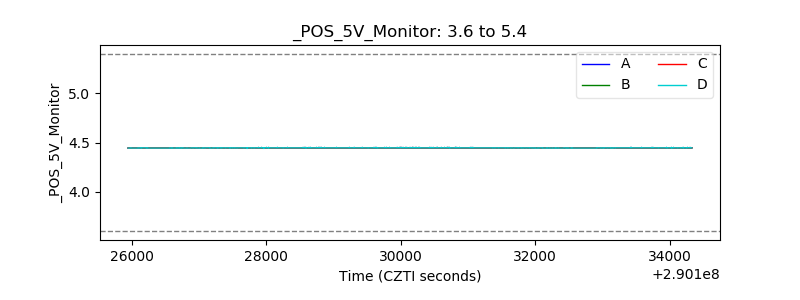 |
| _ROLL_ROT | 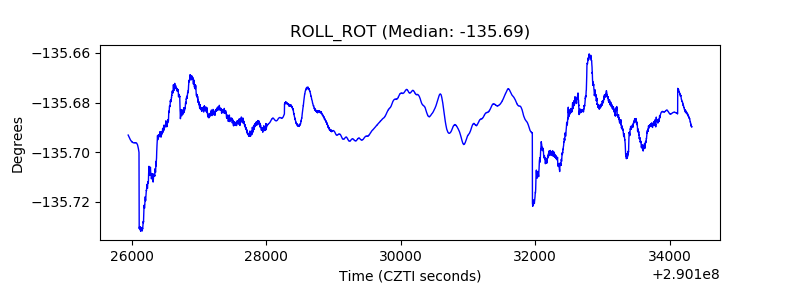 |
| _Roll_DEC | 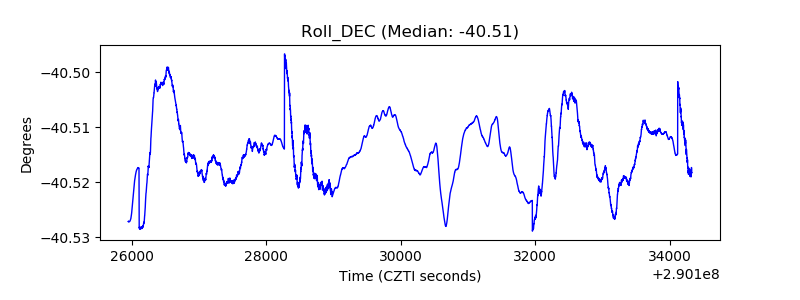 |
| _Roll_RA | 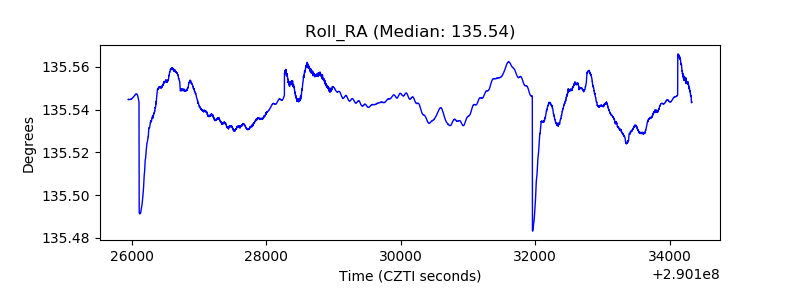 |
| Veto Counter | 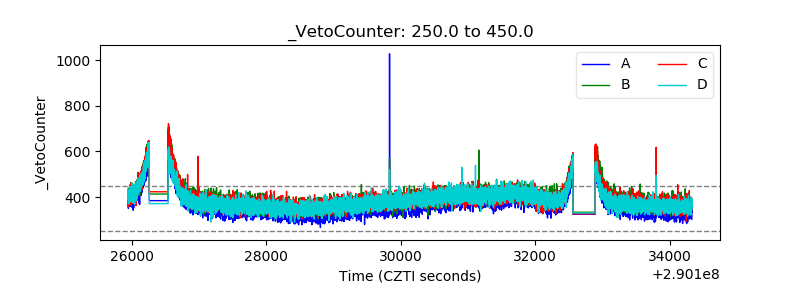 |