| Param | Original file | Final file |
|---|---|---|
| Filename | modeM0/AS1T03_091T01_9000002790_18680cztM0_level2.evt | modeM0/AS1T03_091T01_9000002790_18680cztM0_level2_quad_clean.evt |
| Size (bytes) | 1,322,841,600 | 247,559,040 |
| Size | 1.2 GB | 236.1 MB |
| Events in quadrant A | 8,841,185 | 1,573,413 |
| Events in quadrant B | 9,260,130 | 1,606,943 |
| Events in quadrant C | 9,263,894 | 1,524,609 |
| Events in quadrant D | 11,401,731 | 1,473,029 |
| Mode SS | |||
|---|---|---|---|
| Quadrant | BADHDUFLAG | Total packets | Discarded packets |
| A | 0 | 390 | 0 |
| B | 0 | 390 | 0 |
| C | 0 | 390 | 0 |
| D | 0 | 390 | 0 |
| Mode M9 | |||
|---|---|---|---|
| Quadrant | BADHDUFLAG | Total packets | Discarded packets |
| A | 0 | 22 | 0 |
| B | 0 | 22 | 0 |
| C | 0 | 22 | 0 |
| D | 0 | 22 | 0 |
| Mode M0 | |||
|---|---|---|---|
| Quadrant | BADHDUFLAG | Total packets | Discarded packets |
| A | 0 | 39014 | 4 |
| B | 0 | 39832 | 4 |
| C | 0 | 39831 | 4 |
| D | 0 | 47083 | 4 |
| Quadrant | Total seconds | Saturated seconds | Saturation percentage |
|---|---|---|---|
| A | 19164 | 113 | 0.589647% |
| B | 19164 | 187 | 0.975788% |
| C | 19164 | 250 | 1.304529% |
| D | 19165 | 566 | 2.953300% |
Noise dominated data is calculated using 1-second bins in cleaned event files. If a bin has >2000 counts, and if more than 50% of those come from <1% of pixels, then it is considered to be noise-dominated and hence unusable.
| Quadrant | # 1 sec bins | Bins with >0 counts | Bins with >2000 counts | High rate bins dominated by noise | Noise dominated (total time) | Noise dominated (detector-on time) | Marked lightcurve |
|---|---|---|---|---|---|---|---|
| A | 21264 | 19167 | 1 | 1 | 0.00% | 0.01% | 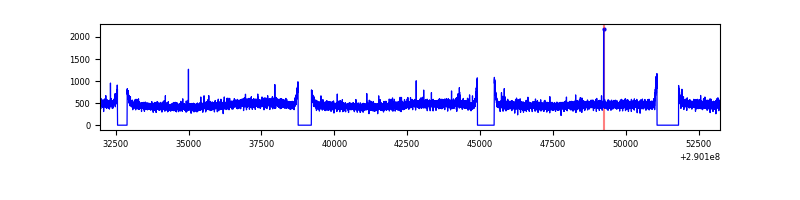 |
| B | 21264 | 19168 | 12 | 12 | 0.06% | 0.06% | 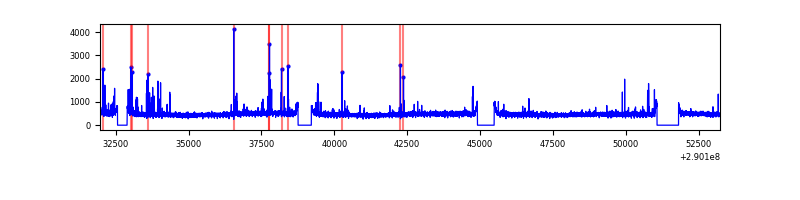 |
| C | 21264 | 19165 | 15 | 15 | 0.07% | 0.08% | 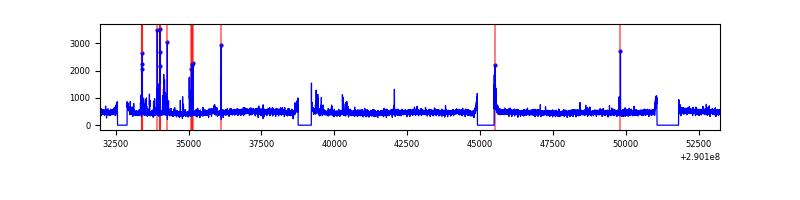 |
| D | 21265 | 19168 | 386 | 386 | 1.82% | 2.01% | 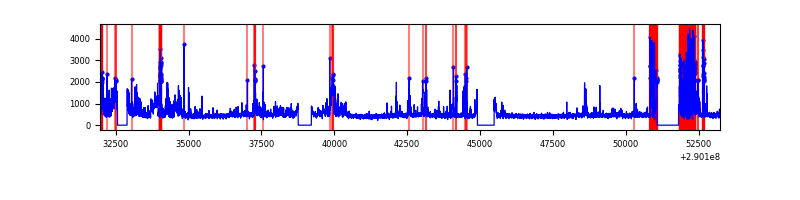 |
Top three noisy pixels from each quadrant. If the there are fewer than three noisy pixels in the level2.evt file, extra rows are filled as -1
| Pixel properties | Quadrant properties | ||||||
|---|---|---|---|---|---|---|---|
| Quadrant | DetID | PixID | Counts | Sigma | Mean | Median | Sigma |
| A | 13 | 254 | 31441 | 63.4 | 2286 | 2233 | 460.7 |
| A | 0 | 226 | 19748 | 38.02 | 2286 | 2233 | 460.7 |
| A | 3 | 137 | 18109 | 34.46 | 2286 | 2233 | 460.7 |
| B | 0 | 197 | 66083 | 146.04 | 2292 | 2235 | 437.2 |
| B | 0 | 189 | 56154 | 123.33 | 2292 | 2235 | 437.2 |
| B | 12 | 111 | 53703 | 117.72 | 2292 | 2235 | 437.2 |
| C | 14 | 238 | 341892 | 662.57 | 2192 | 2205 | 512.7 |
| C | 3 | 233 | 331854 | 642.99 | 2192 | 2205 | 512.7 |
| C | 9 | 54 | 37844 | 69.52 | 2192 | 2205 | 512.7 |
| D | 1 | 52 | 1858404 | 3510.45 | 2182 | 2114 | 528.8 |
| D | 7 | 238 | 1213356 | 2290.59 | 2182 | 2114 | 528.8 |
| D | 2 | 234 | 79804 | 146.92 | 2182 | 2114 | 528.8 |
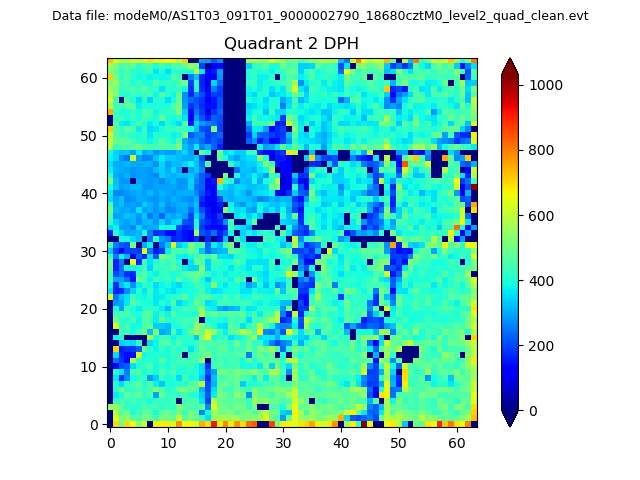
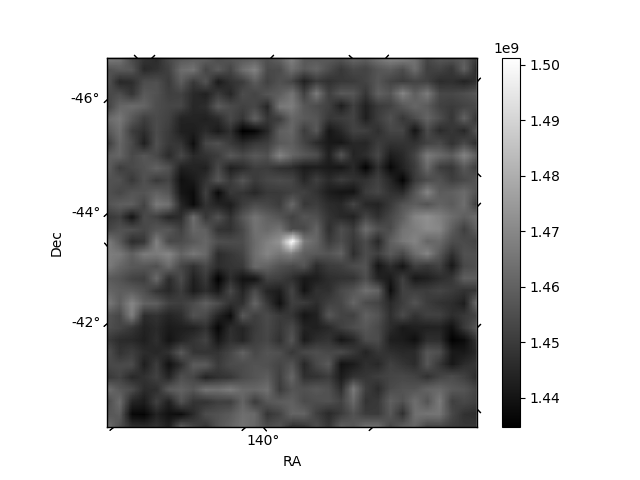
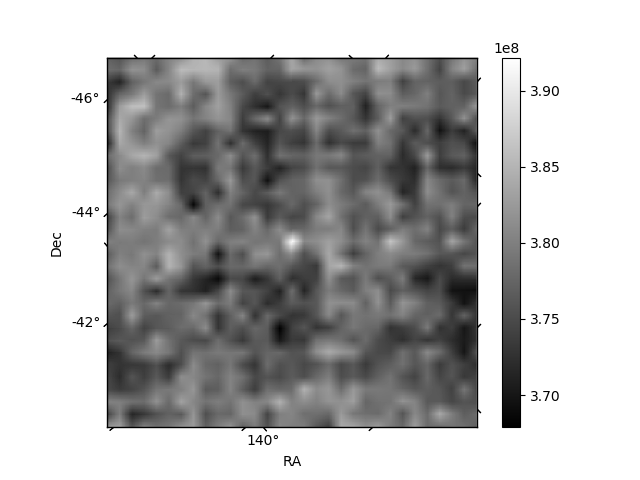
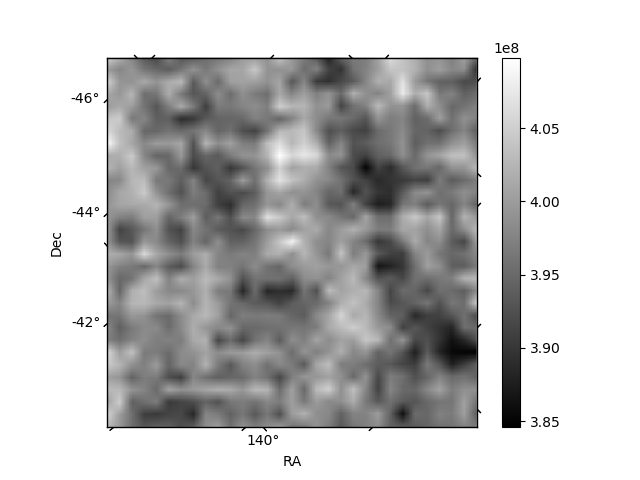
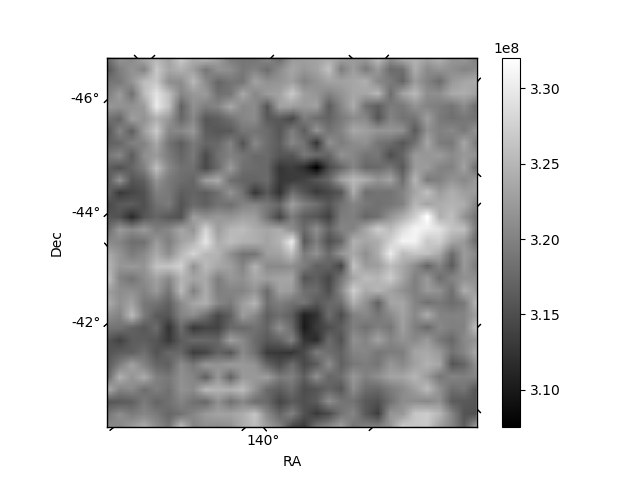
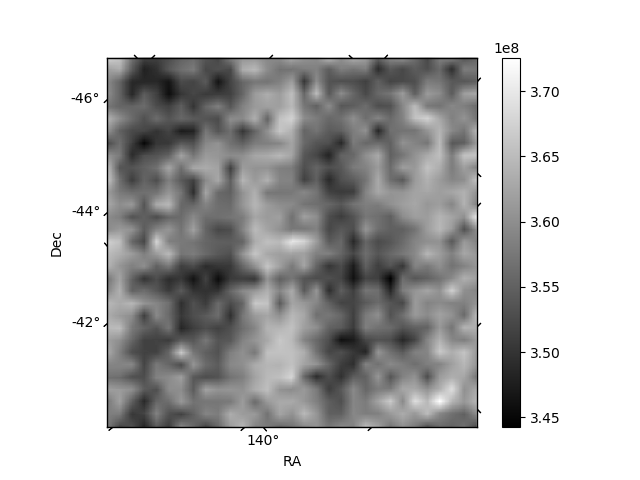
Histogram calculated using DETX and DETY for each event in the final _common_clean file
| Quadrant A | 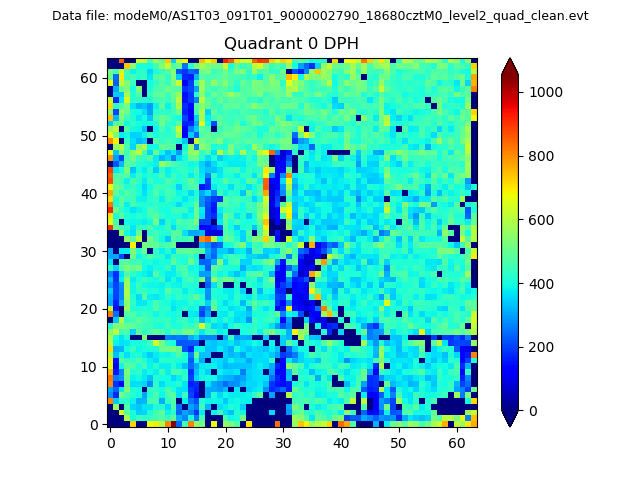 |
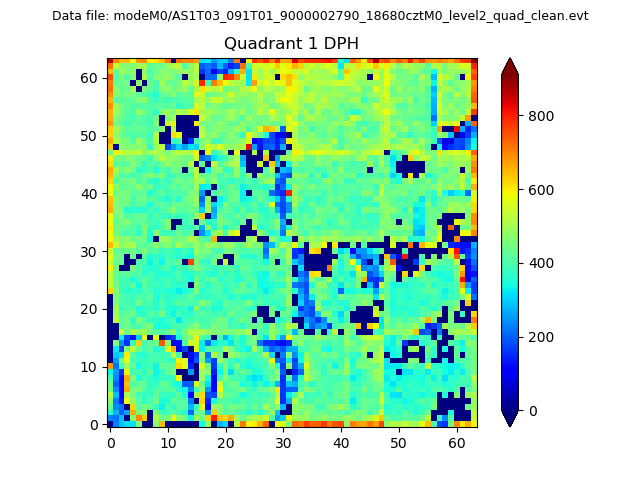 |
Quadrant B |
|---|---|---|---|
| Quadrant D | 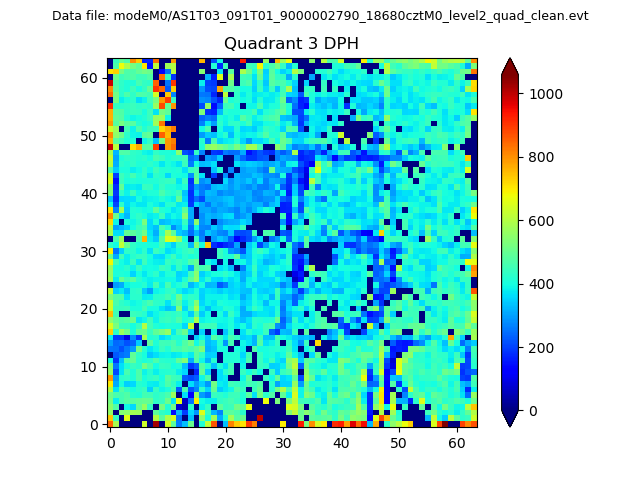 |
 |
Quadrant C |
| Plot type | Count rate plots | Images |
|---|---|---|
| Comparison with Poisson distribution Blue bars denote a histogram of data divided into 1 sec bins. Red curve is a Poisson curve with rate = median count rate of data. |
 |
 |
| Quadrant-wise count rates Data is divided into 100 sec bins |
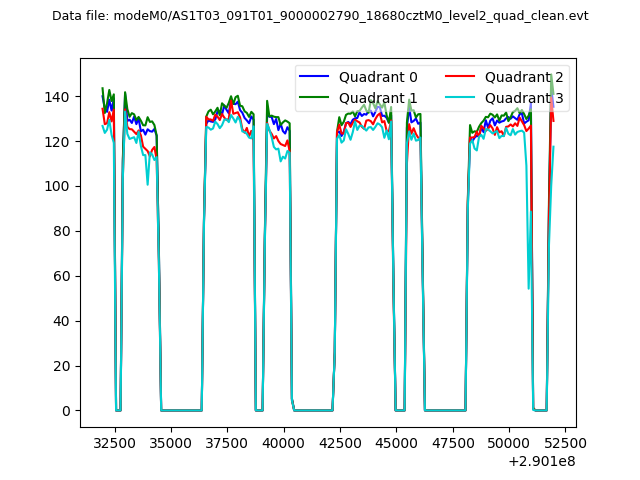 |
|
| Module-wise count rates for Quadrant A Data is divided into 100 sec bins |
 |
 |
| Module-wise count rates for Quadrant B Data is divided into 100 sec bins |
 |
 |
| Module-wise count rates for Quadrant C Data is divided into 100 sec bins |
 |
 |
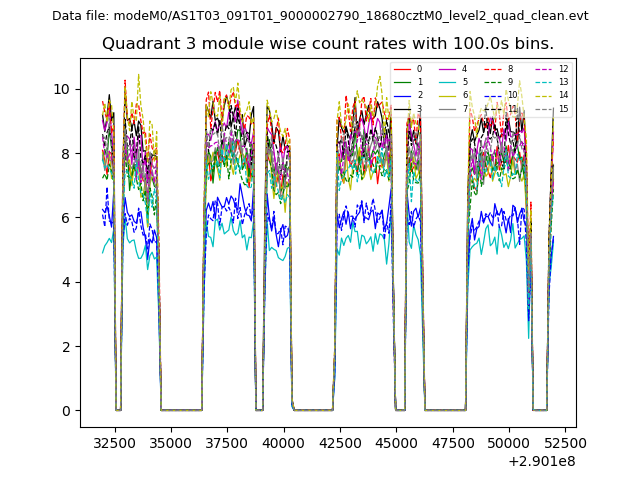
| Module-wise count rates for Quadrant D Data is divided into 100 sec bins |
 |
 |
| Parameter | Plot |
|---|---|
| CZT HV Monitor |  |
| D_VDD | 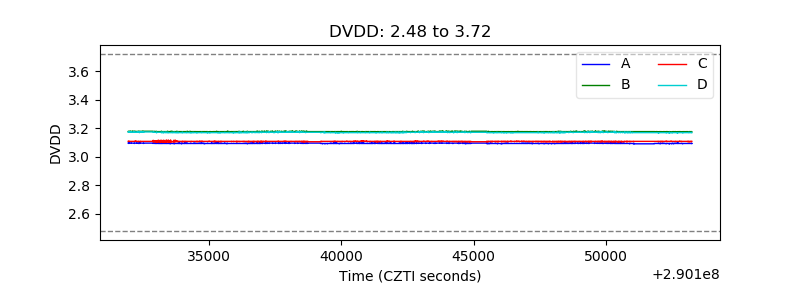 |
| Temperature 1 | 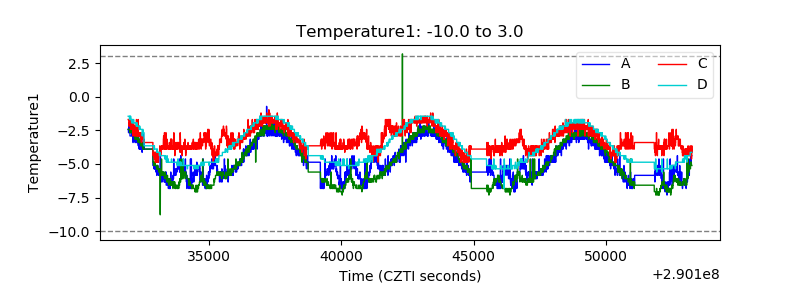 |
| Veto HV Monitor | 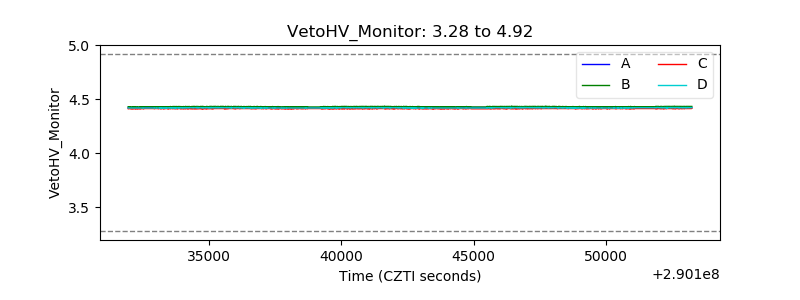 |
| Veto LLD | 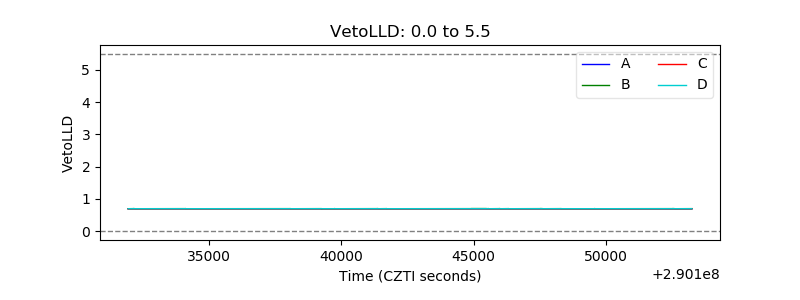 |
| Alpha Counter | 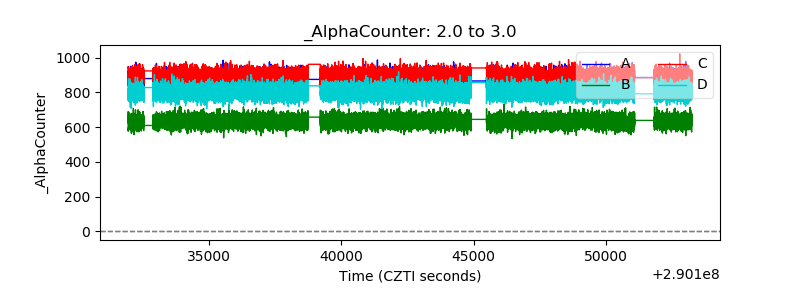 |
| _CPM_Rate | 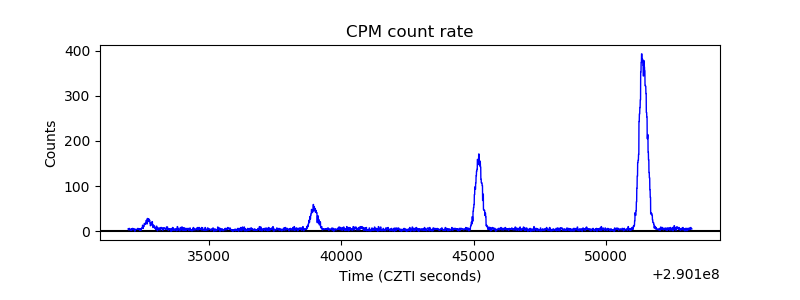 |
| CZT Counter | 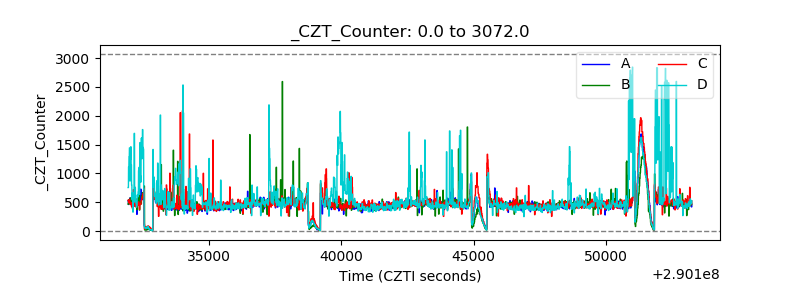 |
| +2.5 Volts monitor | 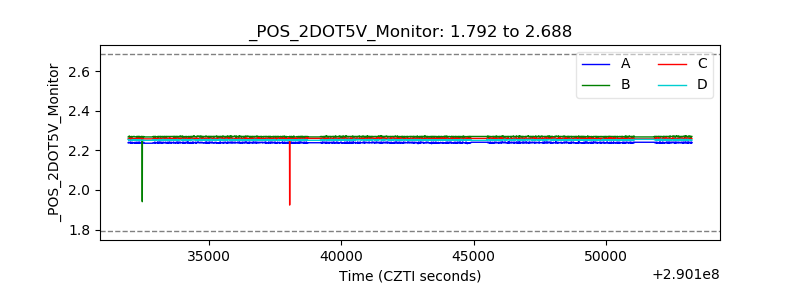 |
| +5 Volts monitor |  |
| _ROLL_ROT | 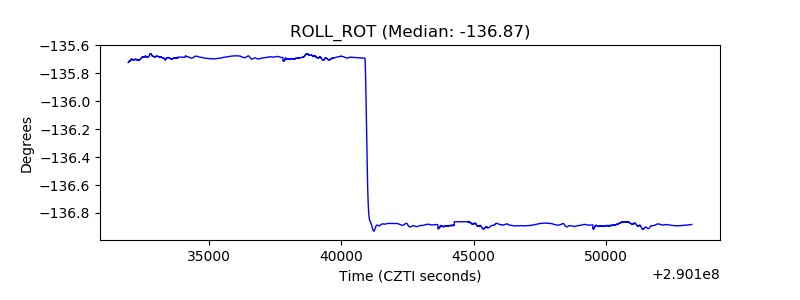 |
| _Roll_DEC | 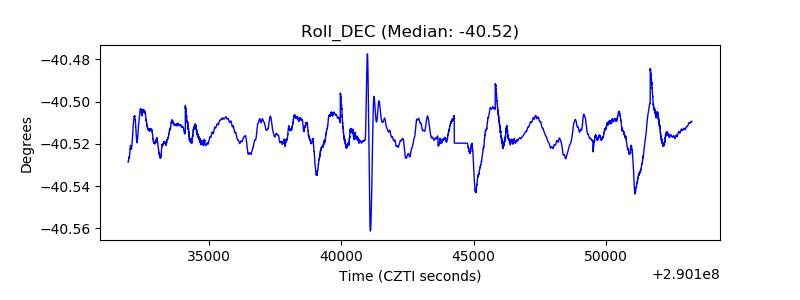 |
| _Roll_RA | 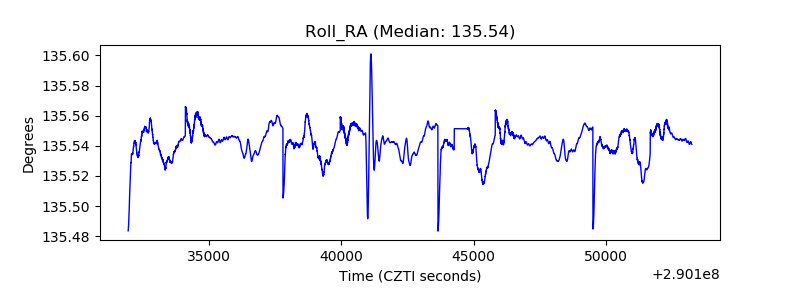 |
| Veto Counter |  |