| Param | Original file | Final file |
|---|---|---|
| Filename | modeM0/AS1T03_091T01_9000002790_18681cztM0_level2.evt | modeM0/AS1T03_091T01_9000002790_18681cztM0_level2_quad_clean.evt |
| Size (bytes) | 190,451,520 | 17,133,120 |
| Size | 181.6 MB | 16.3 MB |
| Events in quadrant A | 1,197,169 | 83,258 |
| Events in quadrant B | 1,227,132 | 86,886 |
| Events in quadrant C | 1,254,369 | 82,987 |
| Events in quadrant D | 1,907,781 | 75,973 |
| Mode SS | |||
|---|---|---|---|
| Quadrant | BADHDUFLAG | Total packets | Discarded packets |
| A | 0 | 54 | 0 |
| B | 0 | 54 | 0 |
| C | 0 | 54 | 0 |
| D | 0 | 54 | 0 |
| Mode M0 | |||
|---|---|---|---|
| Quadrant | BADHDUFLAG | Total packets | Discarded packets |
| A | 0 | 5295 | 1 |
| B | 0 | 5293 | 1 |
| C | 0 | 5305 | 1 |
| D | 0 | 7481 | 1 |
| Quadrant | Total seconds | Saturated seconds | Saturation percentage |
|---|---|---|---|
| A | 2631 | 4 | 0.152033% |
| B | 2631 | 3 | 0.114025% |
| C | 2631 | 10 | 0.380084% |
| D | 2632 | 217 | 8.244681% |
Noise dominated data is calculated using 1-second bins in cleaned event files. If a bin has >2000 counts, and if more than 50% of those come from <1% of pixels, then it is considered to be noise-dominated and hence unusable.
| Quadrant | # 1 sec bins | Bins with >0 counts | Bins with >2000 counts | High rate bins dominated by noise | Noise dominated (total time) | Noise dominated (detector-on time) | Marked lightcurve |
|---|---|---|---|---|---|---|---|
| A | 2631 | 2631 | 0 | 0 | 0.00% | 0.00% |  |
| B | 2631 | 2631 | 0 | 0 | 0.00% | 0.00% |  |
| C | 2631 | 2631 | 0 | 0 | 0.00% | 0.00% |  |
| D | 2632 | 2632 | 188 | 188 | 7.14% | 7.14% | 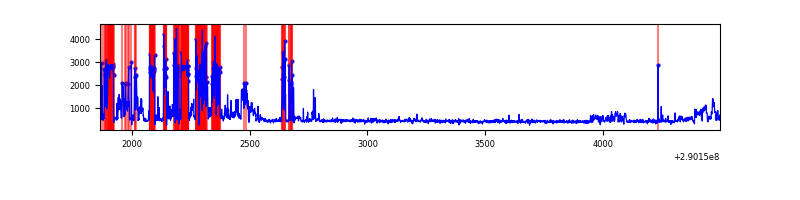 |
Top three noisy pixels from each quadrant. If the there are fewer than three noisy pixels in the level2.evt file, extra rows are filled as -1
| Pixel properties | Quadrant properties | ||||||
|---|---|---|---|---|---|---|---|
| Quadrant | DetID | PixID | Counts | Sigma | Mean | Median | Sigma |
| A | 13 | 254 | 3892 | 55.82 | 308 | 302 | 64.3 |
| A | 3 | 15 | 3517 | 49.99 | 308 | 302 | 64.3 |
| A | 0 | 226 | 2568 | 35.23 | 308 | 302 | 64.3 |
| B | 12 | 111 | 7285 | 115.77 | 311 | 302 | 60.3 |
| B | 11 | 111 | 6257 | 98.73 | 311 | 302 | 60.3 |
| B | 14 | 111 | 5528 | 86.64 | 311 | 302 | 60.3 |
| C | 14 | 238 | 47604 | 648.26 | 305 | 306 | 73.0 |
| C | 3 | 233 | 17543 | 236.25 | 305 | 306 | 73.0 |
| C | 13 | 61 | 2159 | 25.4 | 305 | 306 | 73.0 |
| D | 1 | 52 | 723714 | 10203.72 | 290 | 281 | 70.9 |
| D | 7 | 238 | 66813 | 938.41 | 290 | 281 | 70.9 |
| D | 12 | 110 | 15493 | 214.56 | 290 | 281 | 70.9 |
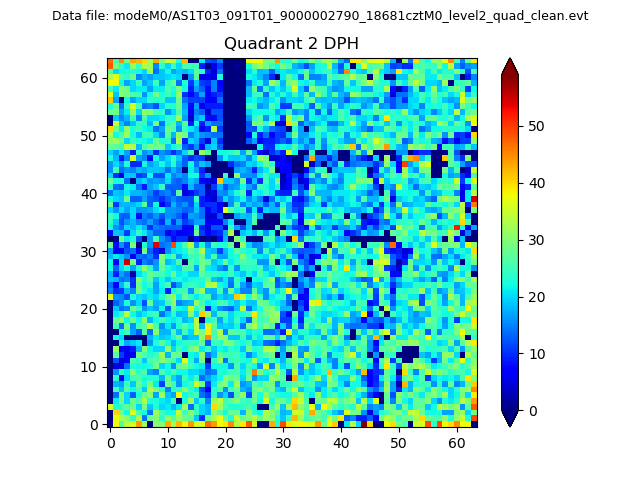
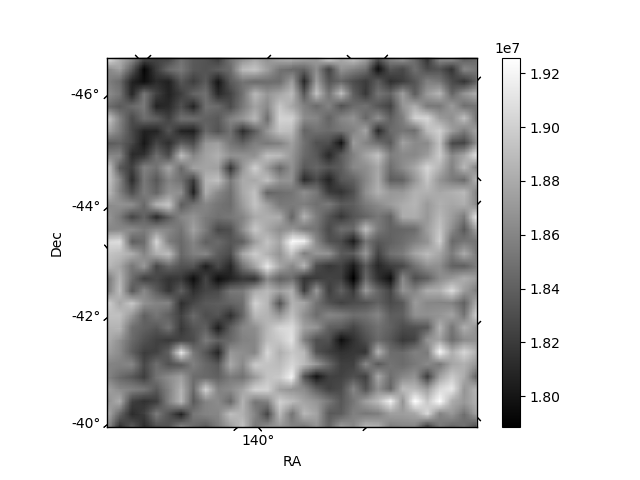
Histogram calculated using DETX and DETY for each event in the final _common_clean file
| Quadrant A | 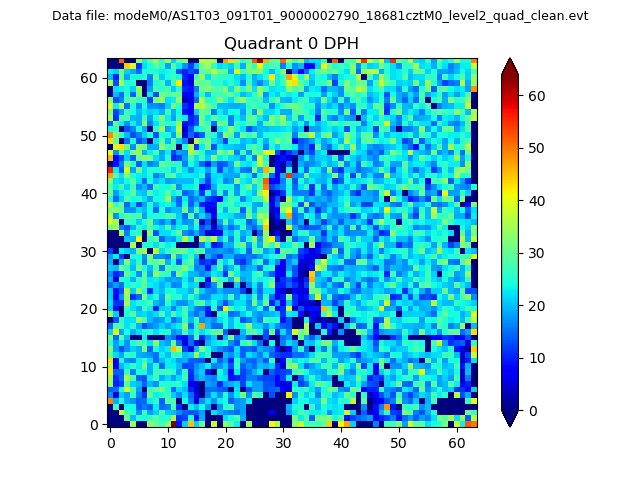 |
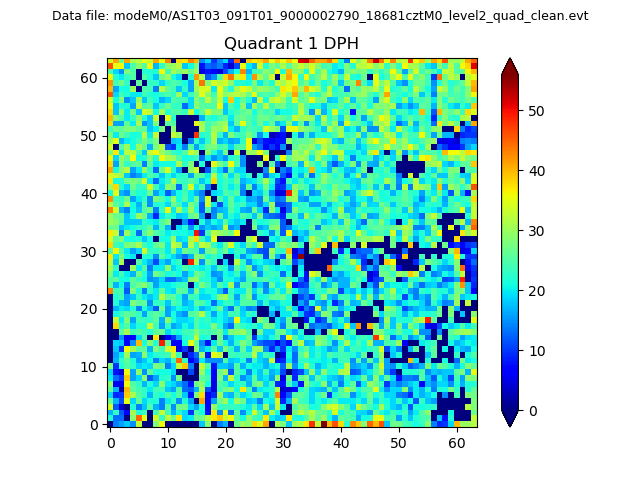 |
Quadrant B |
|---|---|---|---|
| Quadrant D | 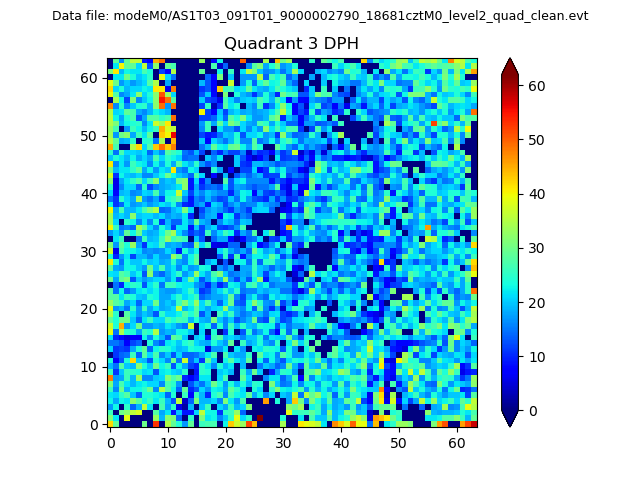 |
 |
Quadrant C |
| Plot type | Count rate plots | Images |
|---|---|---|
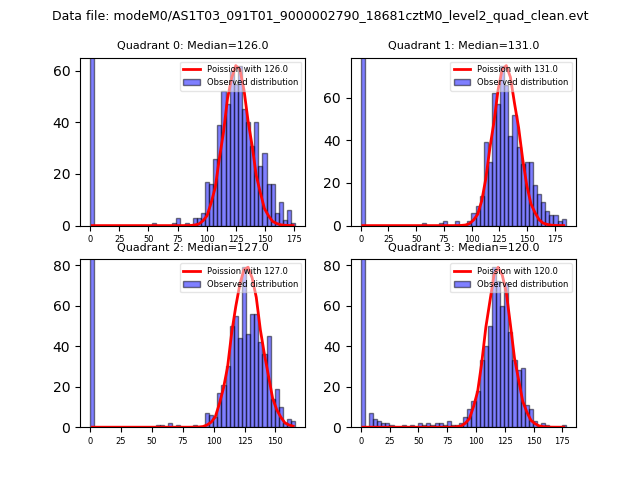
| Comparison with Poisson distribution Blue bars denote a histogram of data divided into 1 sec bins. Red curve is a Poisson curve with rate = median count rate of data. |
 |
 |
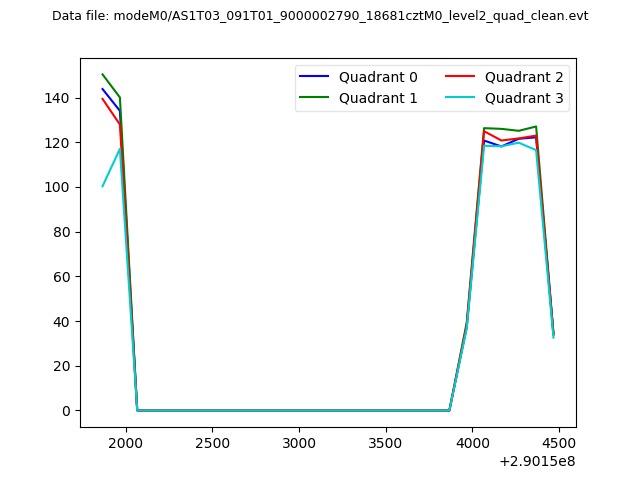
| Quadrant-wise count rates Data is divided into 100 sec bins |
 |
|
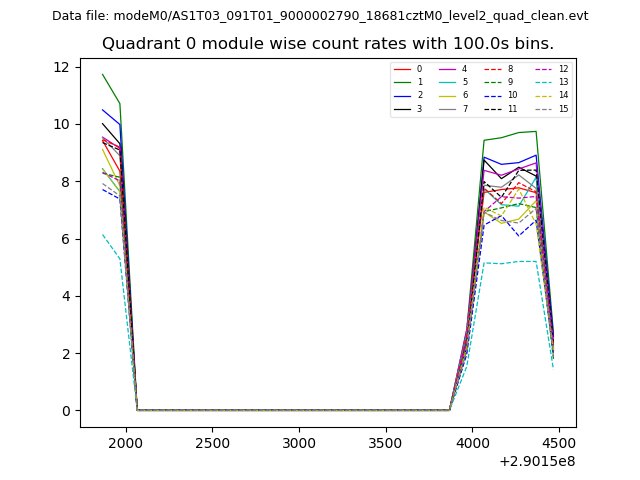
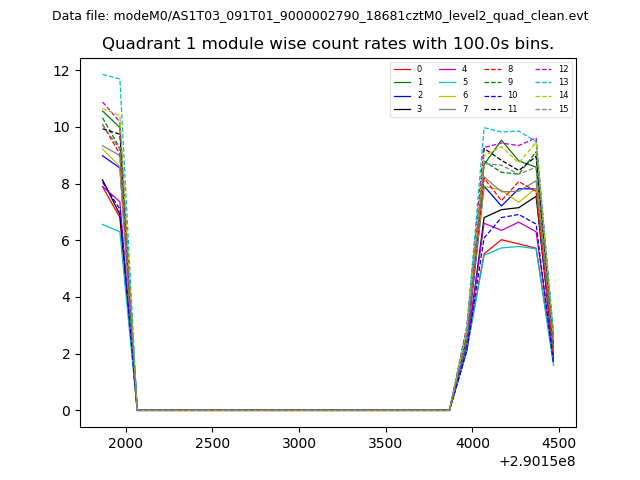
| Module-wise count rates for Quadrant A Data is divided into 100 sec bins |
 |
 |
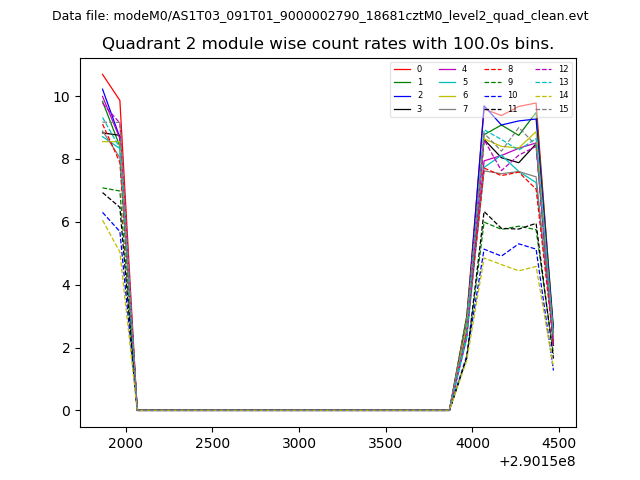
| Module-wise count rates for Quadrant B Data is divided into 100 sec bins |
 |
 |
| Module-wise count rates for Quadrant C Data is divided into 100 sec bins |
 |
 |
| Module-wise count rates for Quadrant D Data is divided into 100 sec bins |
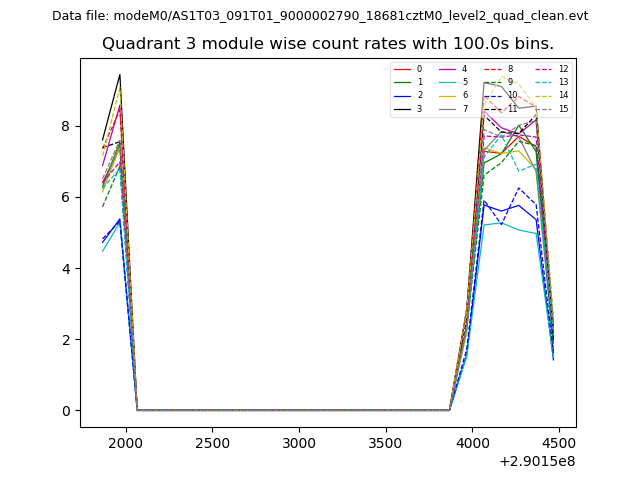 |
 |
| Parameter | Plot |
|---|---|
| CZT HV Monitor | 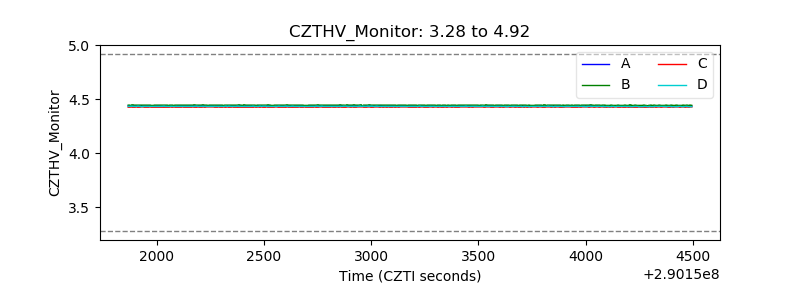 |
| D_VDD |  |
| Temperature 1 | 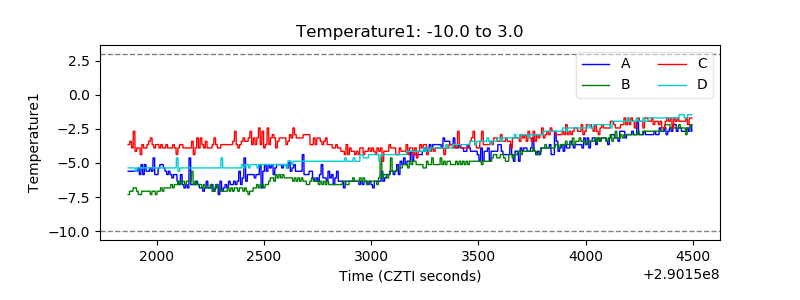 |
| Veto HV Monitor | 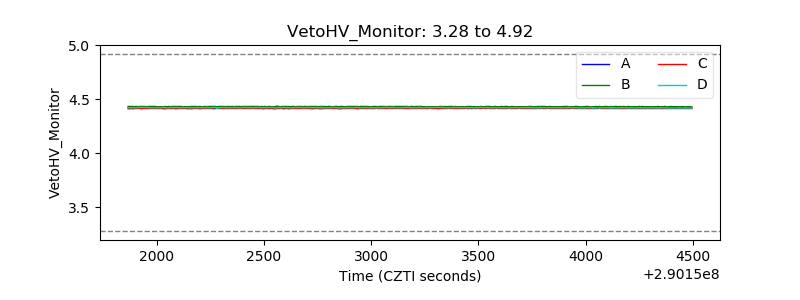 |
| Veto LLD | 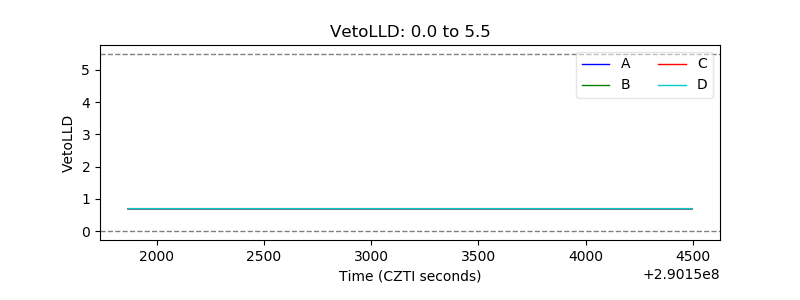 |
| Alpha Counter |  |
| _CPM_Rate |  |
| CZT Counter | 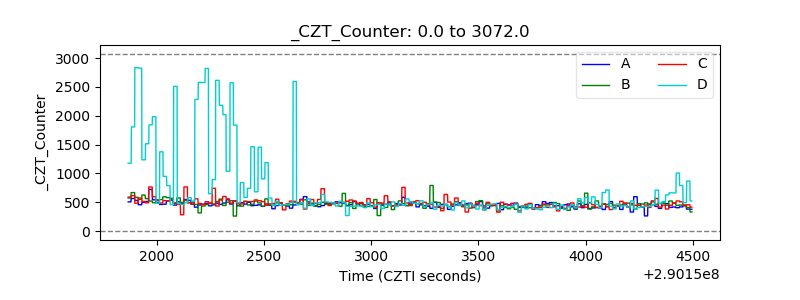 |
| +2.5 Volts monitor |  |
| +5 Volts monitor |  |
| _ROLL_ROT | 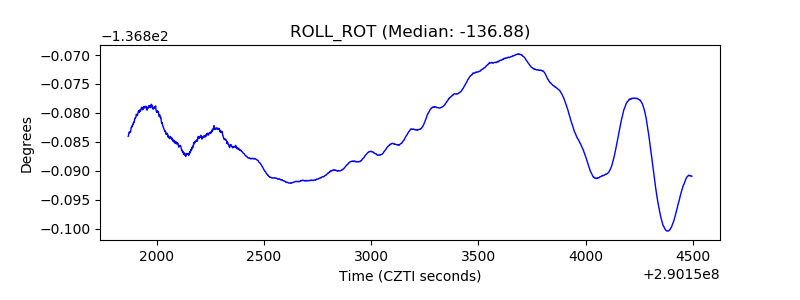 |
| _Roll_DEC | 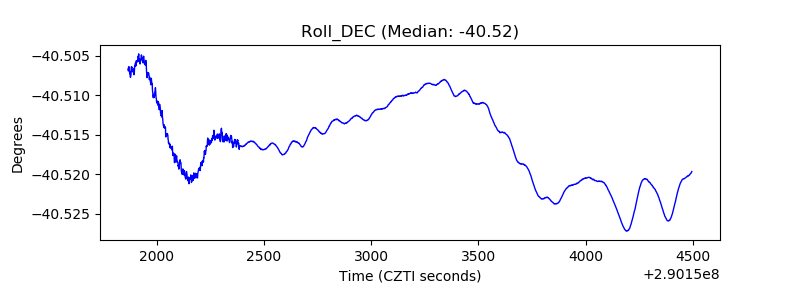 |
| _Roll_RA | 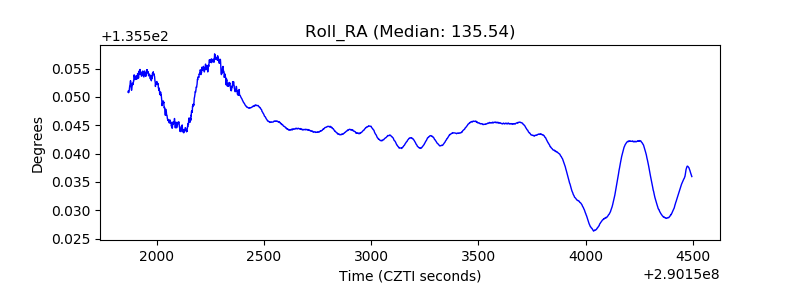 |
| Veto Counter | 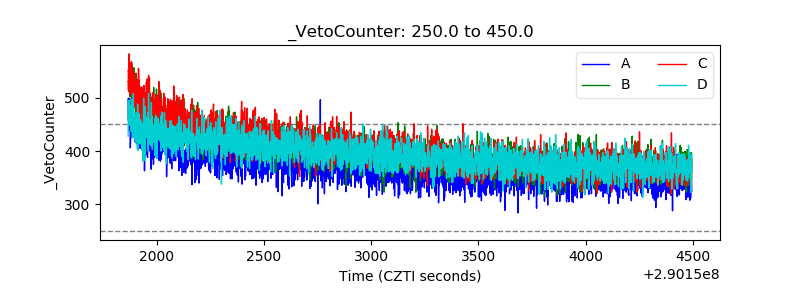 |