| Param | Original file | Final file |
|---|---|---|
| Filename | modeM0/AS1A05_072T04_9000002794_18686cztM0_level2.evt | modeM0/AS1A05_072T04_9000002794_18686cztM0_level2_quad_clean.evt |
| Size (bytes) | 262,765,440 | 37,359,360 |
| Size | 250.6 MB | 35.6 MB |
| Events in quadrant A | 1,719,176 | 232,335 |
| Events in quadrant B | 1,961,337 | 235,189 |
| Events in quadrant C | 1,834,924 | 225,508 |
| Events in quadrant D | 2,227,882 | 214,736 |
| Mode SS | |||
|---|---|---|---|
| Quadrant | BADHDUFLAG | Total packets | Discarded packets |
| A | 0 | 64 | 0 |
| B | 0 | 64 | 0 |
| C | 0 | 64 | 0 |
| D | 0 | 64 | 0 |
| Mode M9 | |||
|---|---|---|---|
| Quadrant | BADHDUFLAG | Total packets | Discarded packets |
| A | 0 | 14 | 0 |
| B | 0 | 14 | 0 |
| C | 0 | 14 | 0 |
| D | 0 | 14 | 0 |
| Mode M0 | |||
|---|---|---|---|
| Quadrant | BADHDUFLAG | Total packets | Discarded packets |
| A | 0 | 7171 | 1 |
| B | 0 | 7874 | 1 |
| C | 0 | 7549 | 1 |
| D | 0 | 8737 | 1 |
| Quadrant | Total seconds | Saturated seconds | Saturation percentage |
|---|---|---|---|
| A | 3138 | 86 | 2.740599% |
| B | 3138 | 171 | 5.449331% |
| C | 3138 | 132 | 4.206501% |
| D | 3138 | 211 | 6.724028% |
Noise dominated data is calculated using 1-second bins in cleaned event files. If a bin has >2000 counts, and if more than 50% of those come from <1% of pixels, then it is considered to be noise-dominated and hence unusable.
| Quadrant | # 1 sec bins | Bins with >0 counts | Bins with >2000 counts | High rate bins dominated by noise | Noise dominated (total time) | Noise dominated (detector-on time) | Marked lightcurve |
|---|---|---|---|---|---|---|---|
| A | 4478 | 3138 | 0 | 0 | 0.00% | 0.00% | 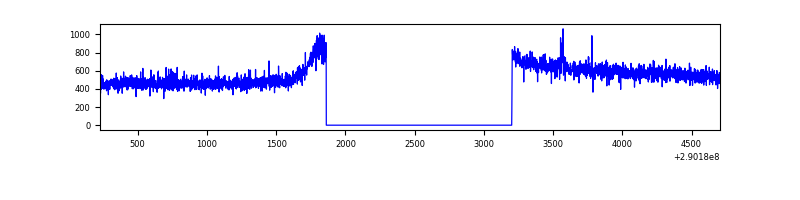 |
| B | 4478 | 3139 | 59 | 59 | 1.32% | 1.88% | 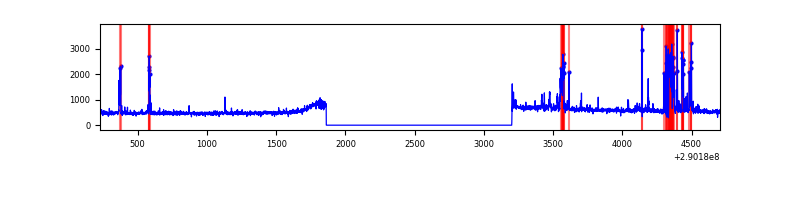 |
| C | 4478 | 3138 | 14 | 14 | 0.31% | 0.45% | 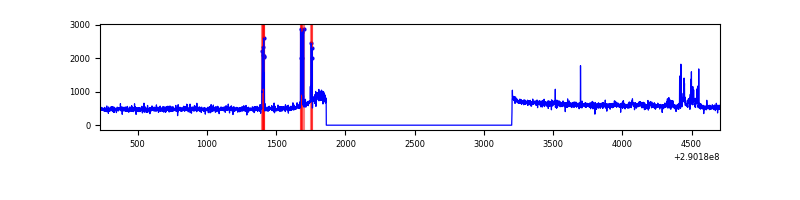 |
| D | 4478 | 3138 | 118 | 118 | 2.64% | 3.76% | 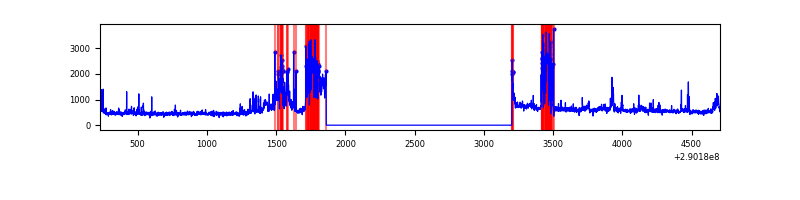 |
Top three noisy pixels from each quadrant. If the there are fewer than three noisy pixels in the level2.evt file, extra rows are filled as -1
| Pixel properties | Quadrant properties | ||||||
|---|---|---|---|---|---|---|---|
| Quadrant | DetID | PixID | Counts | Sigma | Mean | Median | Sigma |
| A | 6 | 16 | 8319 | 88.22 | 444 | 436 | 89.4 |
| A | 13 | 254 | 4955 | 50.57 | 444 | 436 | 89.4 |
| A | 0 | 226 | 3850 | 38.21 | 444 | 436 | 89.4 |
| B | 7 | 220 | 141055 | 1696.72 | 432 | 422 | 82.9 |
| B | 4 | 171 | 65284 | 782.55 | 432 | 422 | 82.9 |
| B | 3 | 64 | 44221 | 528.43 | 432 | 422 | 82.9 |
| C | 9 | 54 | 99745 | 1020.74 | 422 | 425 | 97.3 |
| C | 14 | 238 | 66829 | 682.45 | 422 | 425 | 97.3 |
| C | 3 | 233 | 16489 | 165.09 | 422 | 425 | 97.3 |
| D | 7 | 238 | 624721 | 6184.57 | 416 | 404 | 100.9 |
| D | 7 | 96 | 17021 | 164.61 | 416 | 404 | 100.9 |
| D | 2 | 234 | 13568 | 130.4 | 416 | 404 | 100.9 |
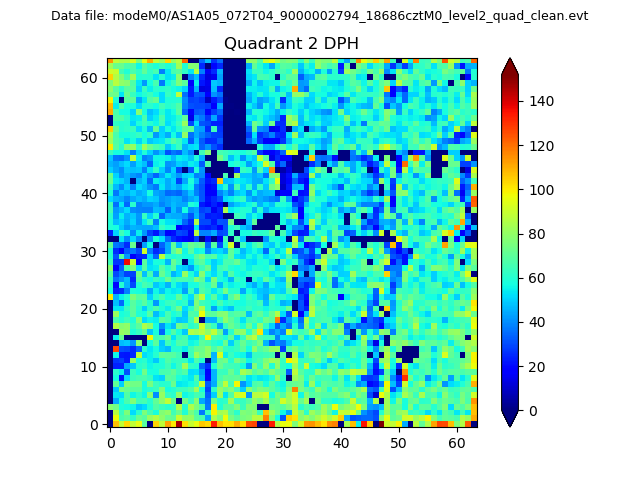
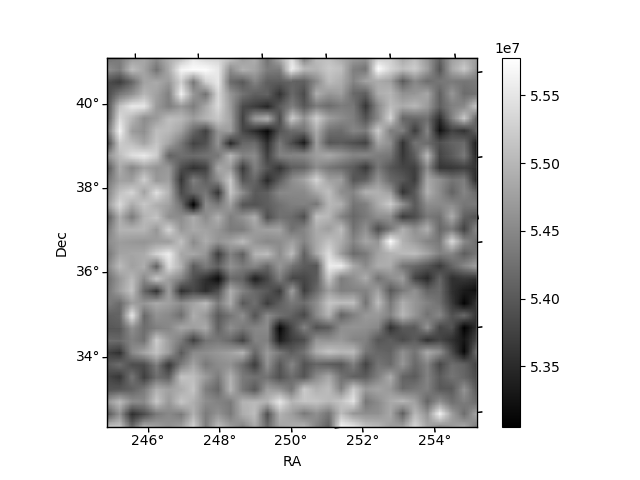
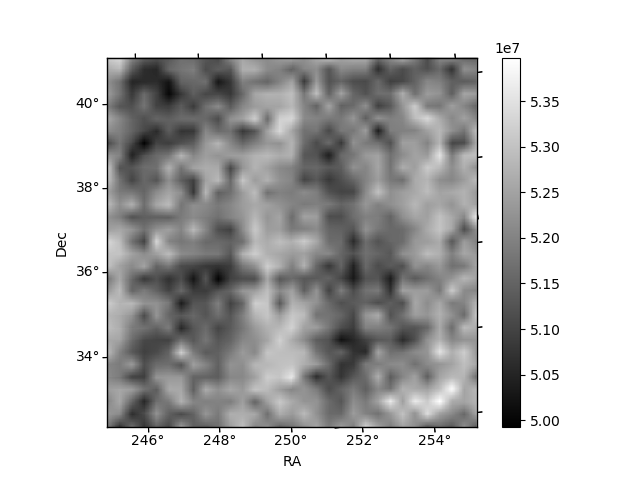
Histogram calculated using DETX and DETY for each event in the final _common_clean file
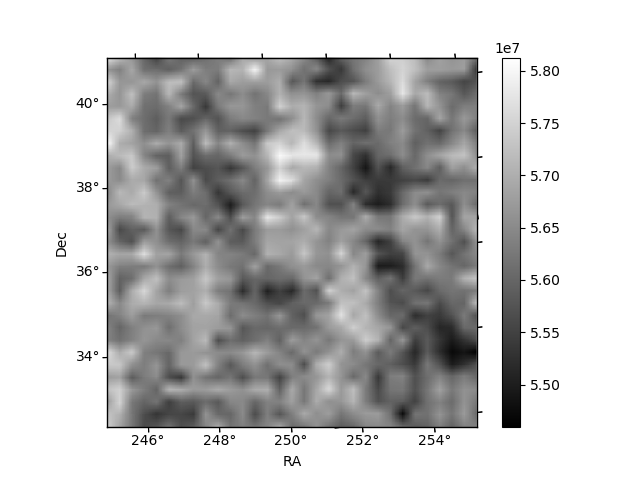
| Quadrant A | 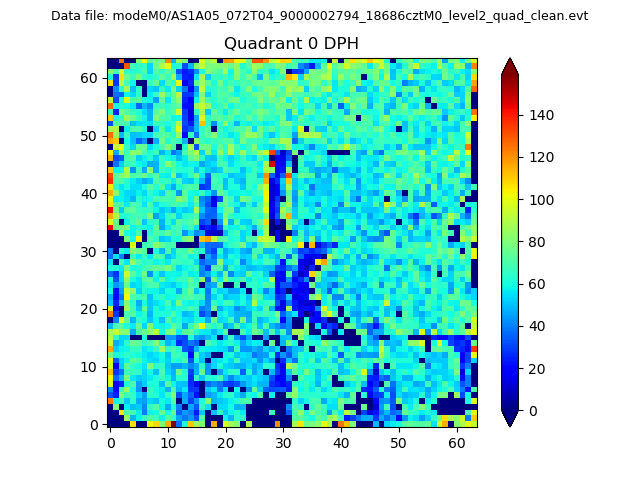 |
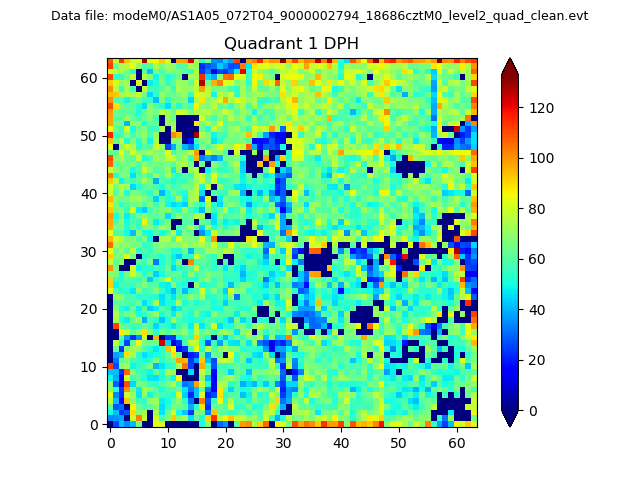 |
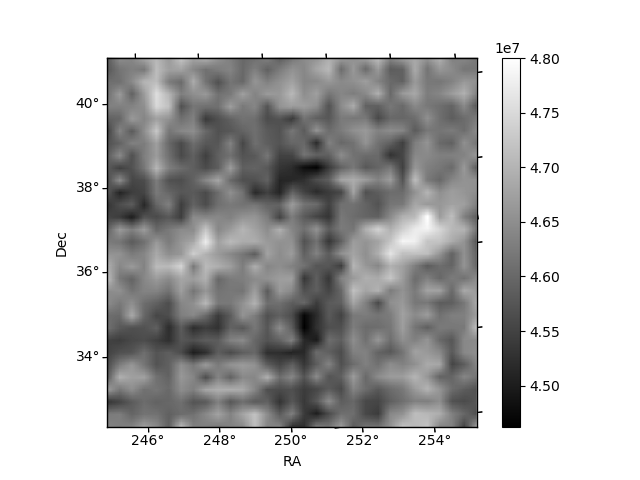
Quadrant B |
|---|---|---|---|
| Quadrant D | 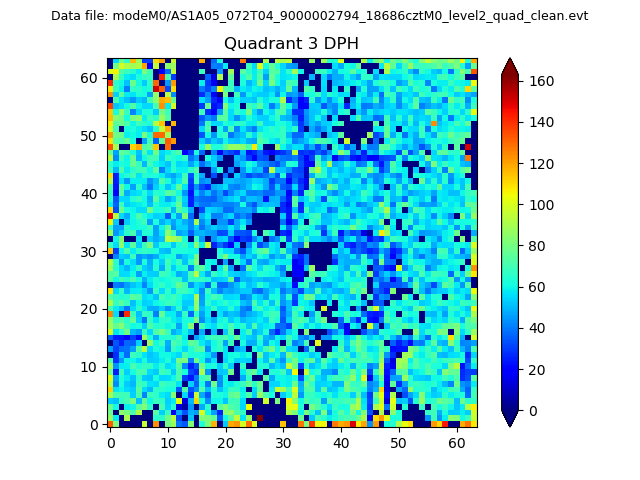 |
 |
Quadrant C |
| Plot type | Count rate plots | Images |
|---|---|---|
| Comparison with Poisson distribution Blue bars denote a histogram of data divided into 1 sec bins. Red curve is a Poisson curve with rate = median count rate of data. |
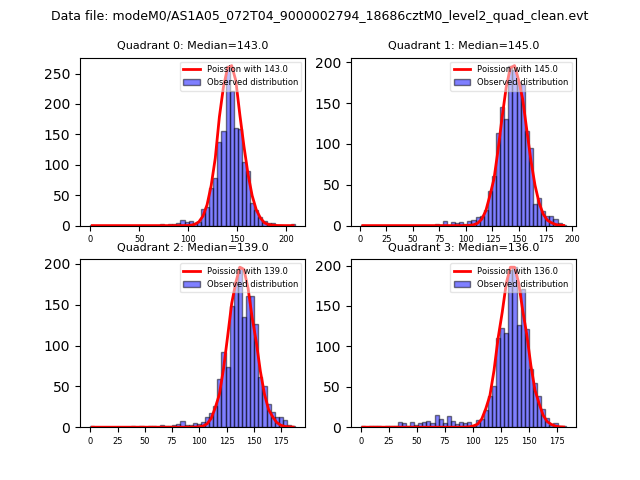 |
 |
| Quadrant-wise count rates Data is divided into 100 sec bins |
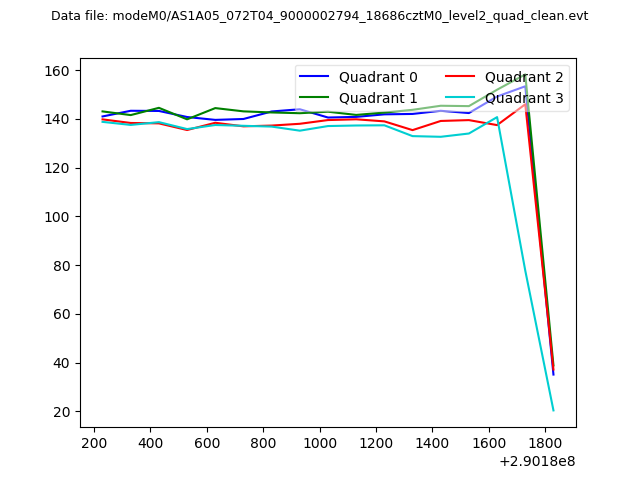 |
|
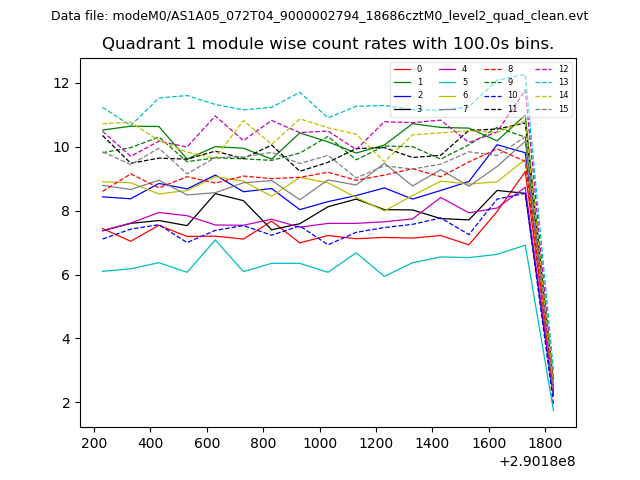
| Module-wise count rates for Quadrant A Data is divided into 100 sec bins |
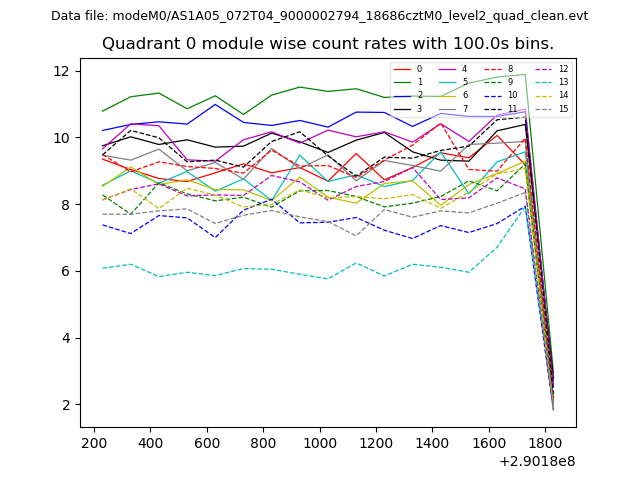 |
 |
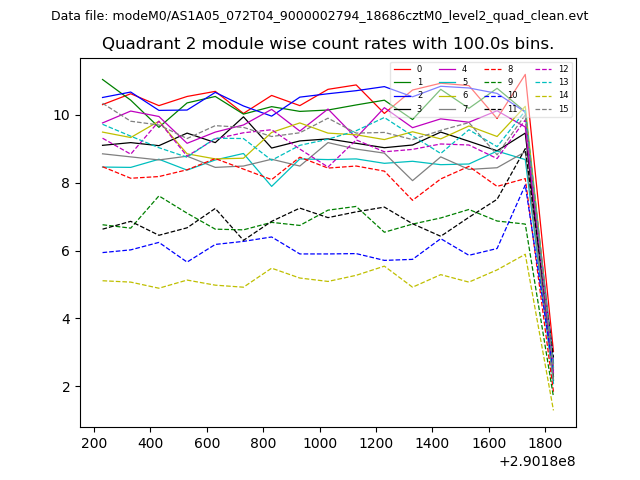
| Module-wise count rates for Quadrant B Data is divided into 100 sec bins |
 |
 |
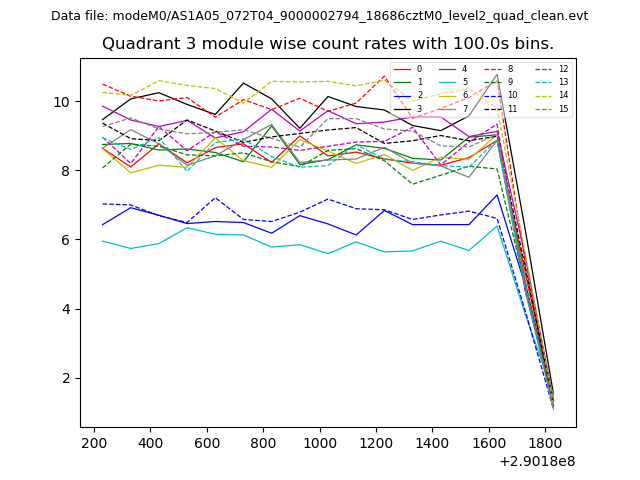
| Module-wise count rates for Quadrant C Data is divided into 100 sec bins |
 |
 |
| Module-wise count rates for Quadrant D Data is divided into 100 sec bins |
 |
 |
| Parameter | Plot |
|---|---|
| CZT HV Monitor | 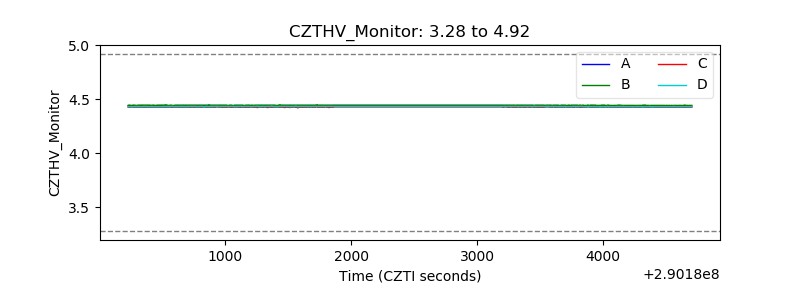 |
| D_VDD | 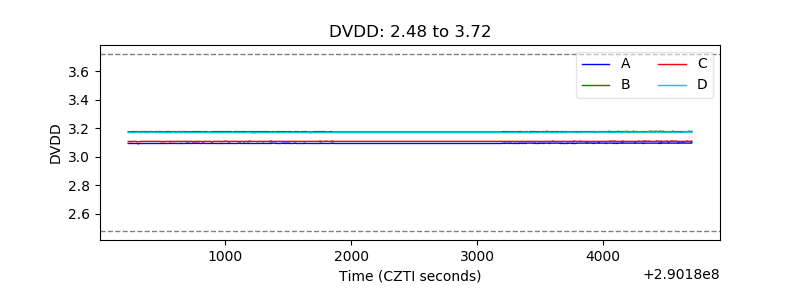 |
| Temperature 1 | 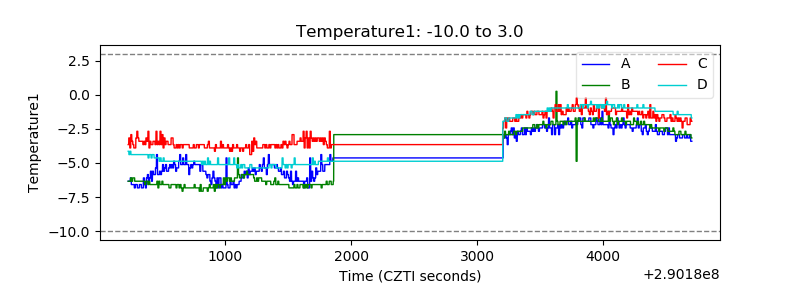 |
| Veto HV Monitor | 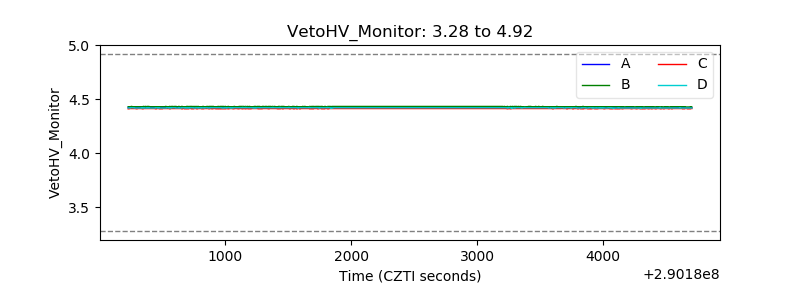 |
| Veto LLD | 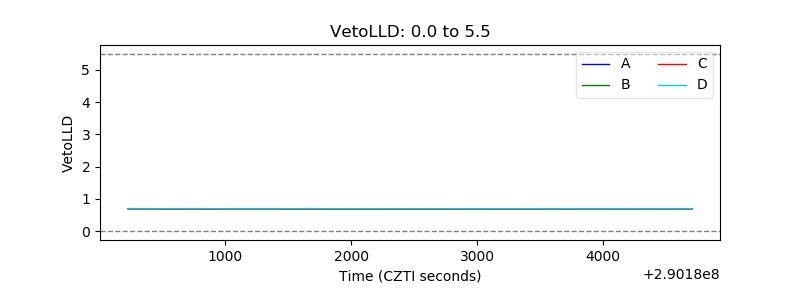 |
| Alpha Counter |  |
| _CPM_Rate | 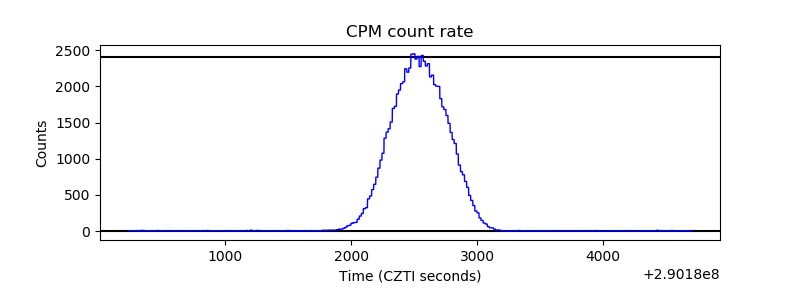 |
| CZT Counter |  |
| +2.5 Volts monitor |  |
| +5 Volts monitor |  |
| _ROLL_ROT | 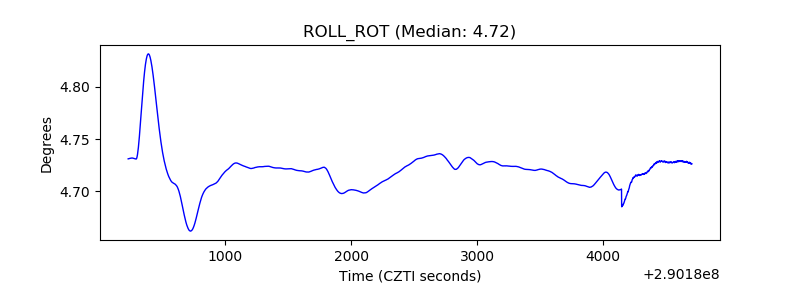 |
| _Roll_DEC | 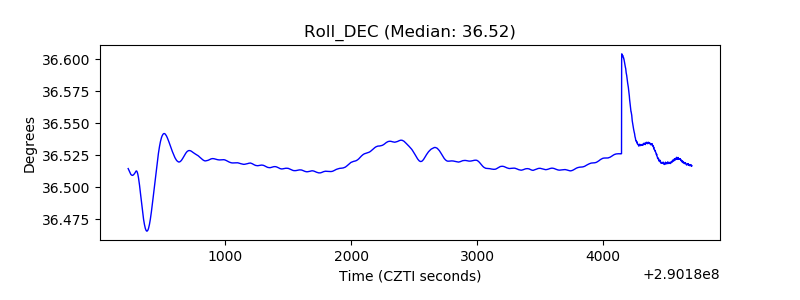 |
| _Roll_RA |  |
| Veto Counter | 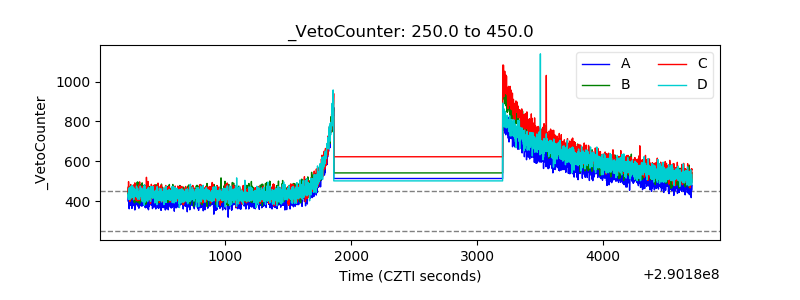 |