| Param | Original file | Final file |
|---|---|---|
| Filename | modeM0/AS1A05_072T04_9000002794_18689cztM0_level2.evt | modeM0/AS1A05_072T04_9000002794_18689cztM0_level2_quad_clean.evt |
| Size (bytes) | 472,383,360 | 92,171,520 |
| Size | 450.5 MB | 87.9 MB |
| Events in quadrant A | 3,319,204 | 581,825 |
| Events in quadrant B | 3,584,326 | 591,435 |
| Events in quadrant C | 3,641,118 | 578,507 |
| Events in quadrant D | 3,305,872 | 572,123 |
| Mode SS | |||
|---|---|---|---|
| Quadrant | BADHDUFLAG | Total packets | Discarded packets |
| A | 0 | 136 | 0 |
| B | 0 | 136 | 0 |
| C | 0 | 136 | 0 |
| D | 0 | 136 | 0 |
| Mode M9 | |||
|---|---|---|---|
| Quadrant | BADHDUFLAG | Total packets | Discarded packets |
| A | 0 | 17 | 0 |
| B | 0 | 18 | 0 |
| C | 0 | 18 | 0 |
| D | 0 | 18 | 0 |
| Mode M0 | |||
|---|---|---|---|
| Quadrant | BADHDUFLAG | Total packets | Discarded packets |
| A | 0 | 14102 | 2 |
| B | 0 | 14942 | 2 |
| C | 0 | 14966 | 2 |
| D | 0 | 14261 | 2 |
| Quadrant | Total seconds | Saturated seconds | Saturation percentage |
|---|---|---|---|
| A | 6706 | 76 | 1.133313% |
| B | 6706 | 125 | 1.864002% |
| C | 6706 | 170 | 2.535043% |
| D | 6706 | 62 | 0.924545% |
Noise dominated data is calculated using 1-second bins in cleaned event files. If a bin has >2000 counts, and if more than 50% of those come from <1% of pixels, then it is considered to be noise-dominated and hence unusable.
| Quadrant | # 1 sec bins | Bins with >0 counts | Bins with >2000 counts | High rate bins dominated by noise | Noise dominated (total time) | Noise dominated (detector-on time) | Marked lightcurve |
|---|---|---|---|---|---|---|---|
| A | 7616 | 6707 | 6 | 6 | 0.08% | 0.09% | 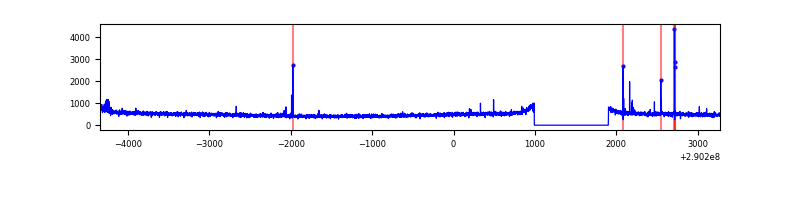 |
| B | 7616 | 6707 | 23 | 23 | 0.30% | 0.34% | 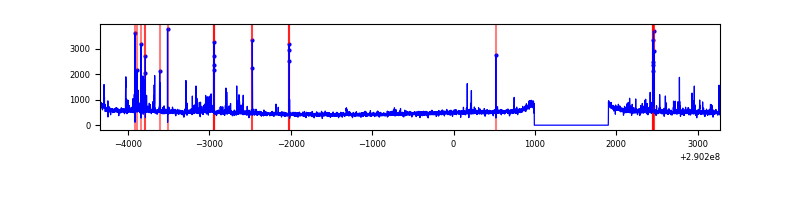 |
| C | 7616 | 6707 | 19 | 19 | 0.25% | 0.28% | 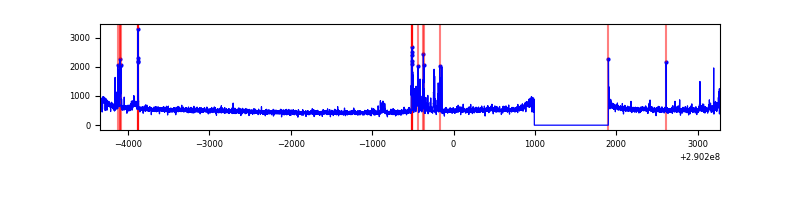 |
| D | 7616 | 6707 | 3 | 3 | 0.04% | 0.04% | 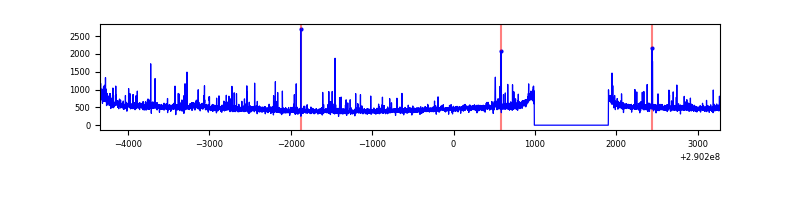 |
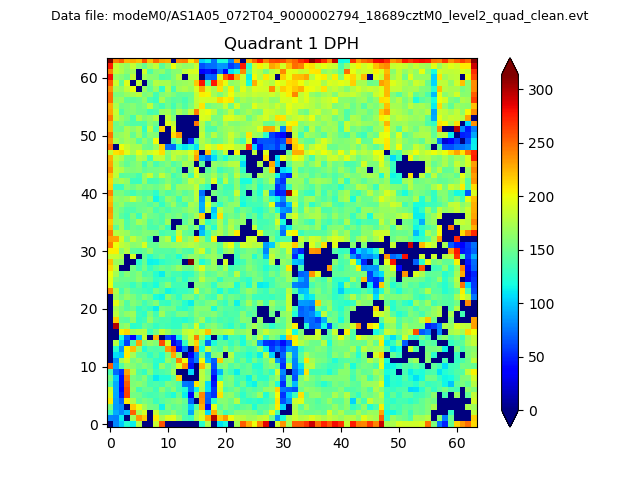
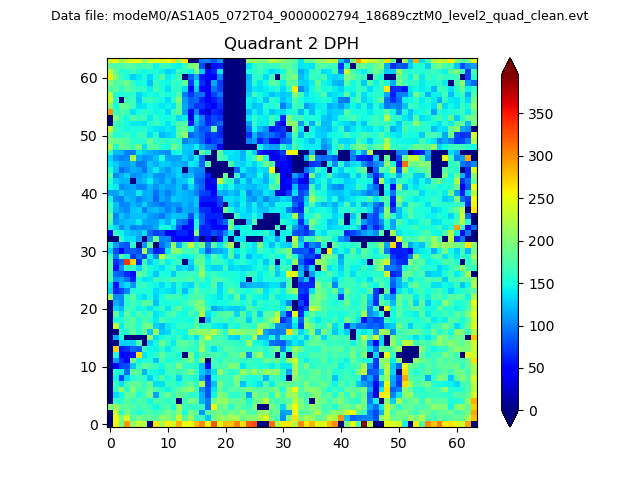
Top three noisy pixels from each quadrant. If the there are fewer than three noisy pixels in the level2.evt file, extra rows are filled as -1
| Pixel properties | Quadrant properties | ||||||
|---|---|---|---|---|---|---|---|
| Quadrant | DetID | PixID | Counts | Sigma | Mean | Median | Sigma |
| A | 6 | 16 | 52158 | 300.09 | 845 | 827 | 171.1 |
| A | 13 | 254 | 10793 | 58.26 | 845 | 827 | 171.1 |
| A | 0 | 226 | 7465 | 38.81 | 845 | 827 | 171.1 |
| B | 7 | 220 | 99020 | 610.46 | 844 | 823 | 160.9 |
| B | 0 | 197 | 52692 | 322.45 | 844 | 823 | 160.9 |
| B | 10 | 245 | 51330 | 313.98 | 844 | 823 | 160.9 |
| C | 9 | 54 | 248973 | 1309.58 | 817 | 821 | 189.5 |
| C | 14 | 238 | 128892 | 675.87 | 817 | 821 | 189.5 |
| C | 3 | 233 | 57149 | 297.26 | 817 | 821 | 189.5 |
| D | 1 | 52 | 78860 | 386.19 | 832 | 808 | 202.1 |
| D | 7 | 238 | 56677 | 276.43 | 832 | 808 | 202.1 |
| D | 2 | 234 | 28619 | 137.61 | 832 | 808 | 202.1 |
Histogram calculated using DETX and DETY for each event in the final _common_clean file
| Quadrant A | 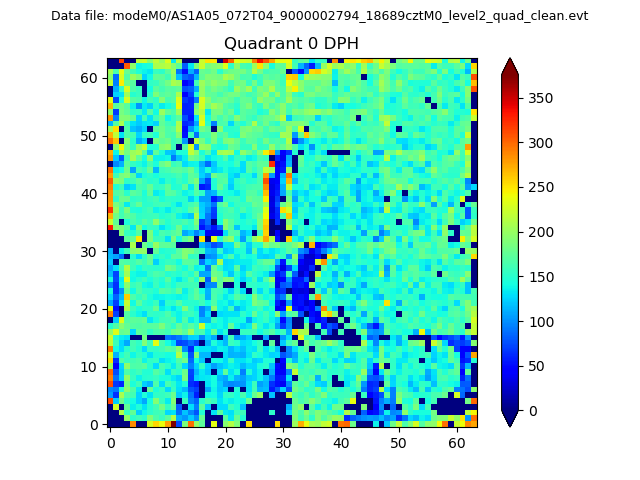 |
 |
Quadrant B |
|---|---|---|---|
| Quadrant D | 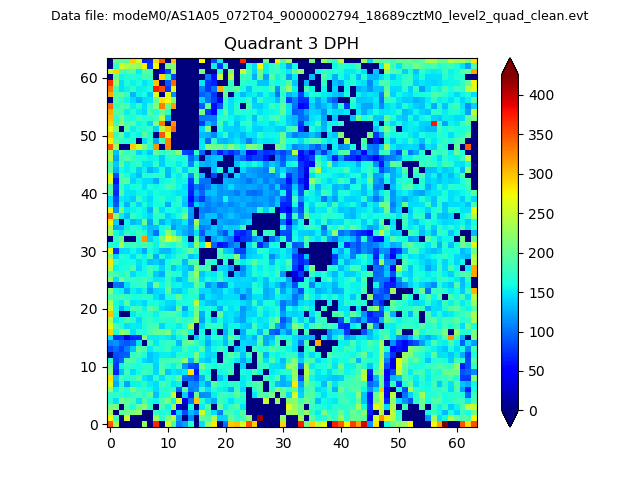 |
 |
Quadrant C |
| Plot type | Count rate plots | Images |
|---|---|---|
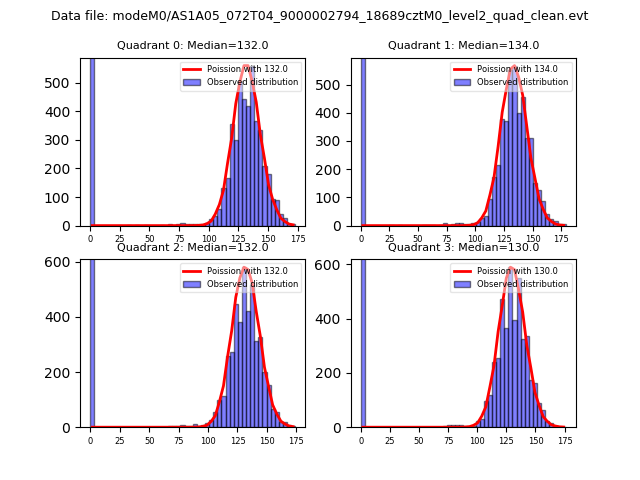
| Comparison with Poisson distribution Blue bars denote a histogram of data divided into 1 sec bins. Red curve is a Poisson curve with rate = median count rate of data. |
 |
 |
| Quadrant-wise count rates Data is divided into 100 sec bins |
 |
|
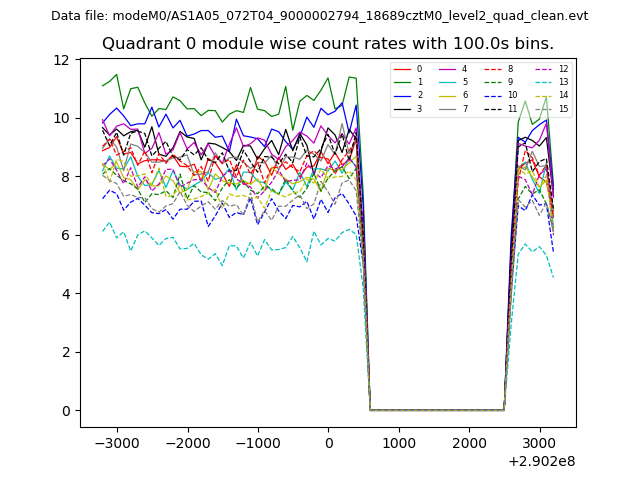
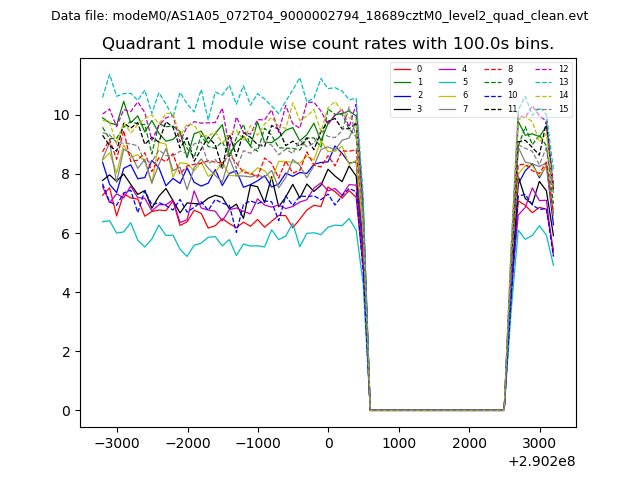
| Module-wise count rates for Quadrant A Data is divided into 100 sec bins |
 |
 |
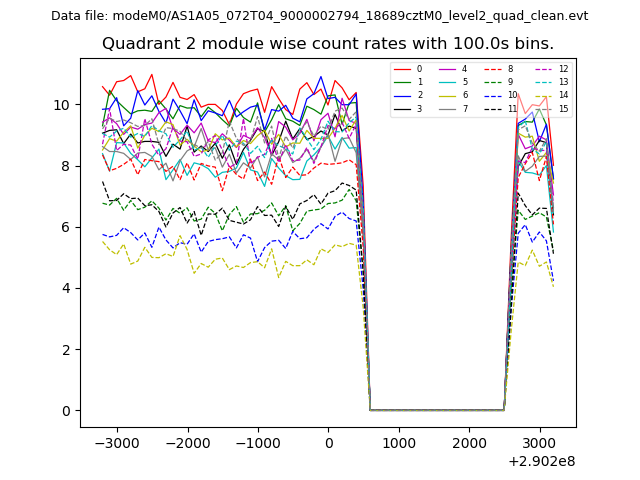
| Module-wise count rates for Quadrant B Data is divided into 100 sec bins |
 |
 |
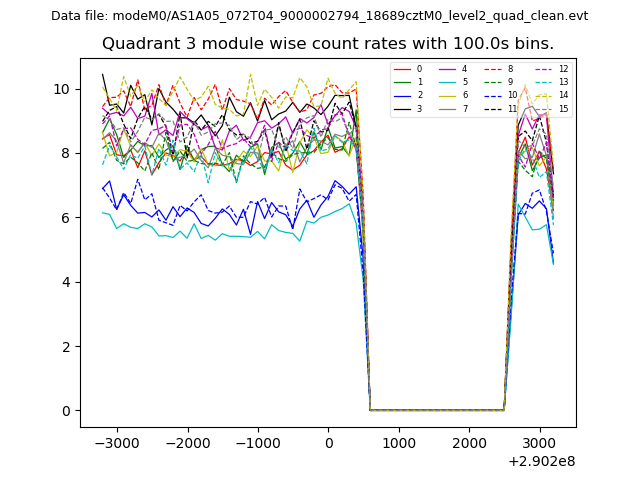
| Module-wise count rates for Quadrant C Data is divided into 100 sec bins |
 |
 |
| Module-wise count rates for Quadrant D Data is divided into 100 sec bins |
 |
 |
| Parameter | Plot |
|---|---|
| CZT HV Monitor | 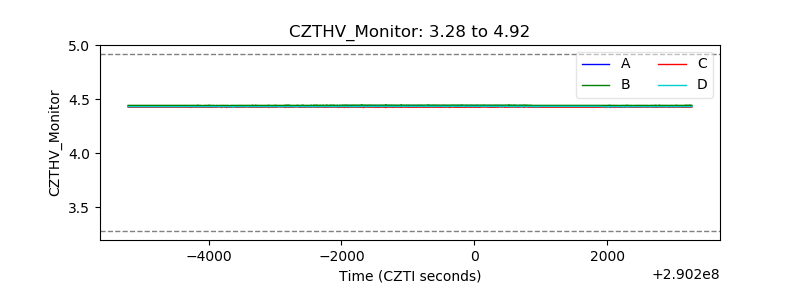 |
| D_VDD | 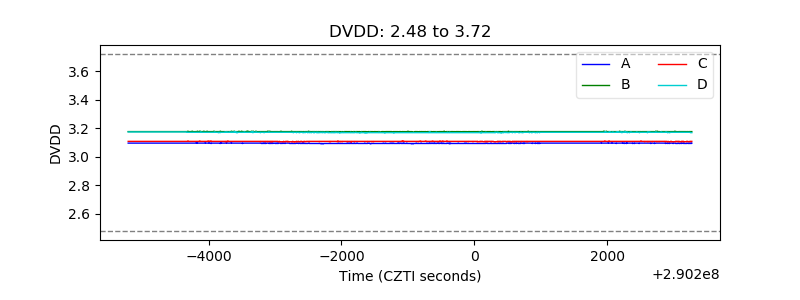 |
| Temperature 1 |  |
| Veto HV Monitor | 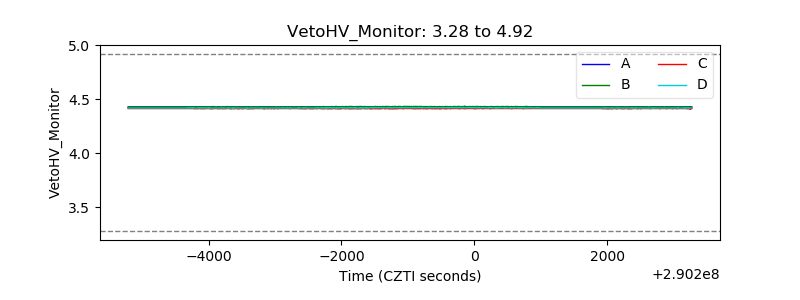 |
| Veto LLD | 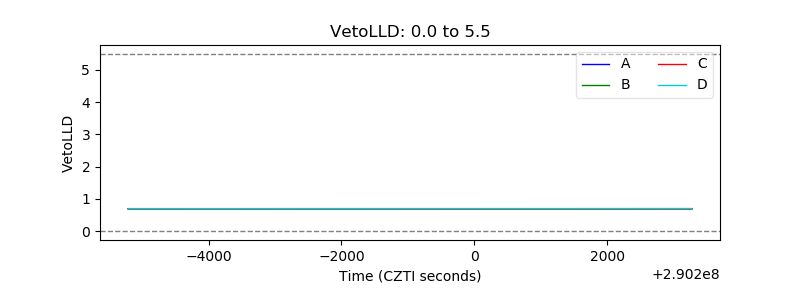 |
| Alpha Counter | 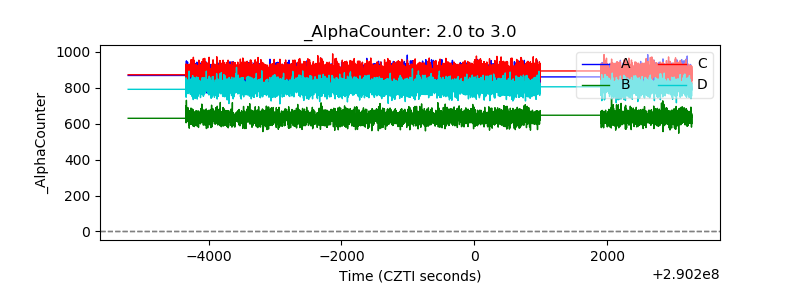 |
| _CPM_Rate | 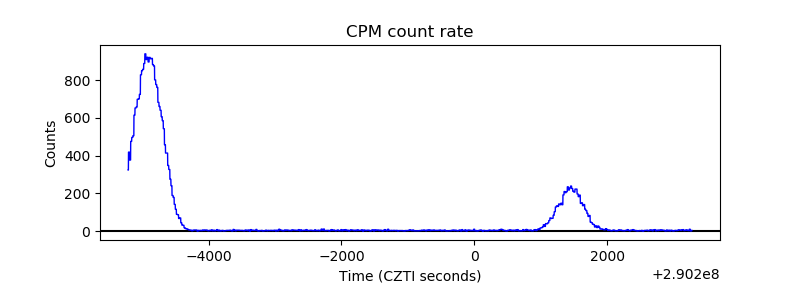 |
| CZT Counter |  |
| +2.5 Volts monitor |  |
| +5 Volts monitor |  |
| _ROLL_ROT | 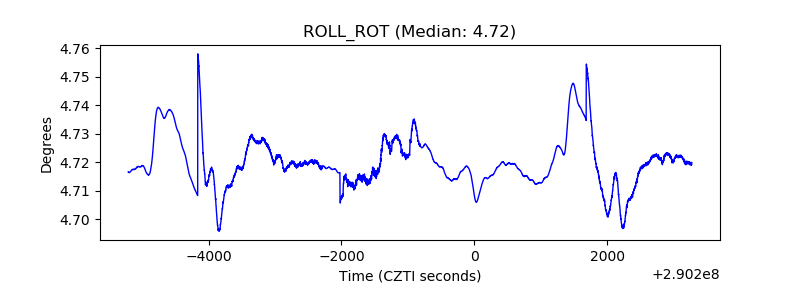 |
| _Roll_DEC | 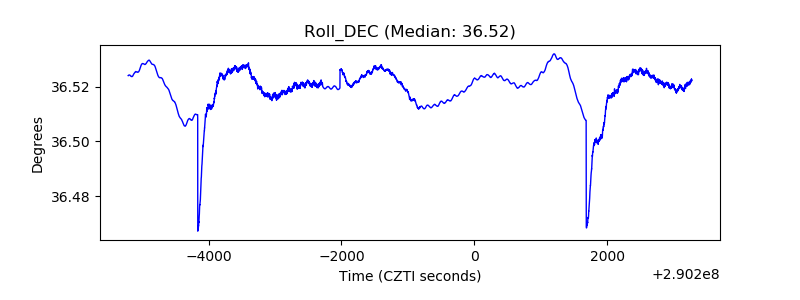 |
| _Roll_RA |  |
| Veto Counter | 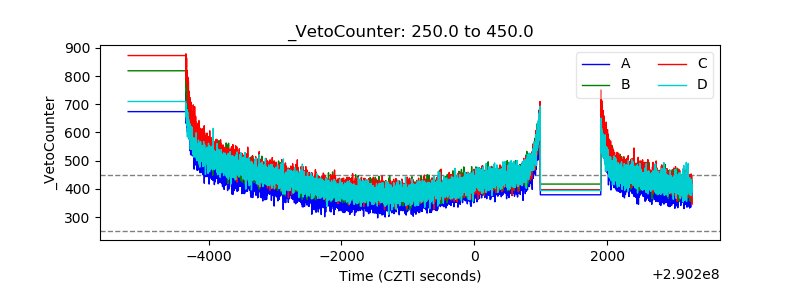 |