| Param | Original file | Final file |
|---|---|---|
| Filename | modeM0/AS1A05_072T04_9000002794_18690cztM0_level2.evt | modeM0/AS1A05_072T04_9000002794_18690cztM0_level2_quad_clean.evt |
| Size (bytes) | 507,628,800 | 96,229,440 |
| Size | 484.1 MB | 91.8 MB |
| Events in quadrant A | 3,517,984 | 605,759 |
| Events in quadrant B | 3,683,383 | 616,676 |
| Events in quadrant C | 3,787,221 | 600,018 |
| Events in quadrant D | 3,897,660 | 592,069 |
| Mode SS | |||
|---|---|---|---|
| Quadrant | BADHDUFLAG | Total packets | Discarded packets |
| A | 0 | 148 | 0 |
| B | 0 | 148 | 0 |
| C | 0 | 148 | 0 |
| D | 0 | 148 | 0 |
| Mode M9 | |||
|---|---|---|---|
| Quadrant | BADHDUFLAG | Total packets | Discarded packets |
| A | 0 | 13 | 0 |
| B | 0 | 13 | 0 |
| C | 0 | 13 | 0 |
| D | 0 | 13 | 0 |
| Mode M0 | |||
|---|---|---|---|
| Quadrant | BADHDUFLAG | Total packets | Discarded packets |
| A | 0 | 15151 | 3 |
| B | 0 | 15613 | 3 |
| C | 0 | 15708 | 3 |
| D | 0 | 16456 | 3 |
| Quadrant | Total seconds | Saturated seconds | Saturation percentage |
|---|---|---|---|
| A | 7173 | 106 | 1.477764% |
| B | 7174 | 154 | 2.146641% |
| C | 7174 | 206 | 2.871480% |
| D | 7174 | 108 | 1.505436% |
Noise dominated data is calculated using 1-second bins in cleaned event files. If a bin has >2000 counts, and if more than 50% of those come from <1% of pixels, then it is considered to be noise-dominated and hence unusable.
| Quadrant | # 1 sec bins | Bins with >0 counts | Bins with >2000 counts | High rate bins dominated by noise | Noise dominated (total time) | Noise dominated (detector-on time) | Marked lightcurve |
|---|---|---|---|---|---|---|---|
| A | 8574 | 7176 | 14 | 14 | 0.16% | 0.20% | 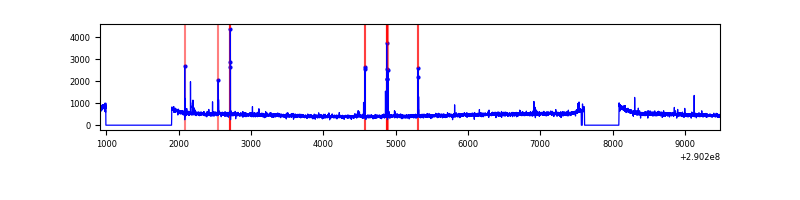 |
| B | 8575 | 7177 | 9 | 9 | 0.10% | 0.13% | 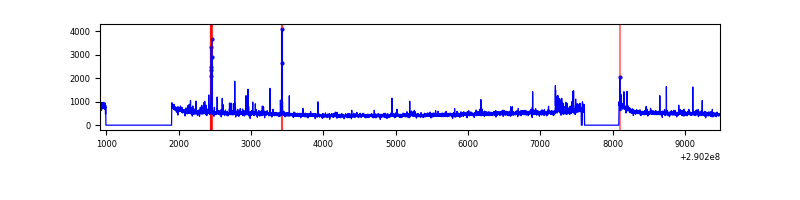 |
| C | 8575 | 7177 | 21 | 21 | 0.24% | 0.29% | 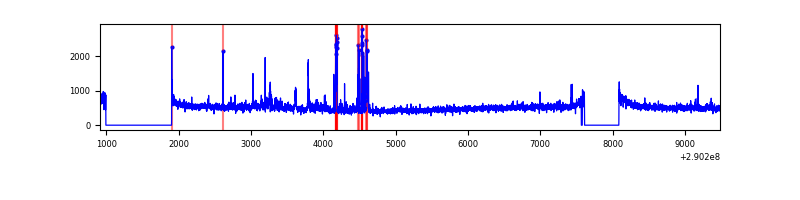 |
| D | 8575 | 7177 | 19 | 19 | 0.22% | 0.26% | 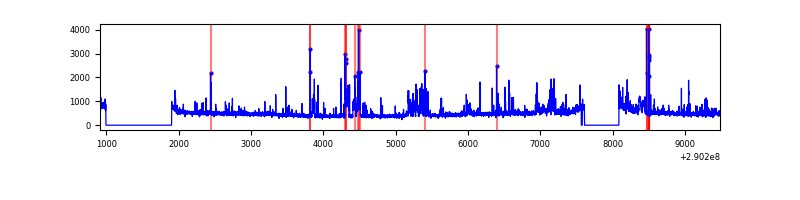 |
Top three noisy pixels from each quadrant. If the there are fewer than three noisy pixels in the level2.evt file, extra rows are filled as -1
| Pixel properties | Quadrant properties | ||||||
|---|---|---|---|---|---|---|---|
| Quadrant | DetID | PixID | Counts | Sigma | Mean | Median | Sigma |
| A | 6 | 16 | 83519 | 465.04 | 886 | 868 | 177.7 |
| A | 13 | 254 | 11024 | 57.14 | 886 | 868 | 177.7 |
| A | 11 | 29 | 10531 | 54.37 | 886 | 868 | 177.7 |
| B | 7 | 220 | 87549 | 508.47 | 887 | 864 | 170.5 |
| B | 0 | 230 | 27604 | 156.85 | 887 | 864 | 170.5 |
| B | 0 | 197 | 25970 | 147.27 | 887 | 864 | 170.5 |
| C | 9 | 54 | 193107 | 961.65 | 856 | 861 | 199.9 |
| C | 14 | 238 | 133712 | 664.54 | 856 | 861 | 199.9 |
| C | 3 | 233 | 99448 | 493.15 | 856 | 861 | 199.9 |
| D | 1 | 52 | 297096 | 1391.22 | 871 | 845 | 212.9 |
| D | 7 | 238 | 228100 | 1067.21 | 871 | 845 | 212.9 |
| D | 7 | 38 | 54156 | 250.35 | 871 | 845 | 212.9 |
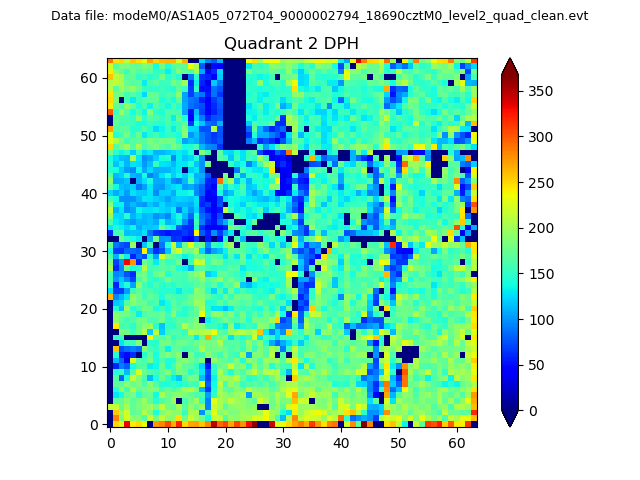
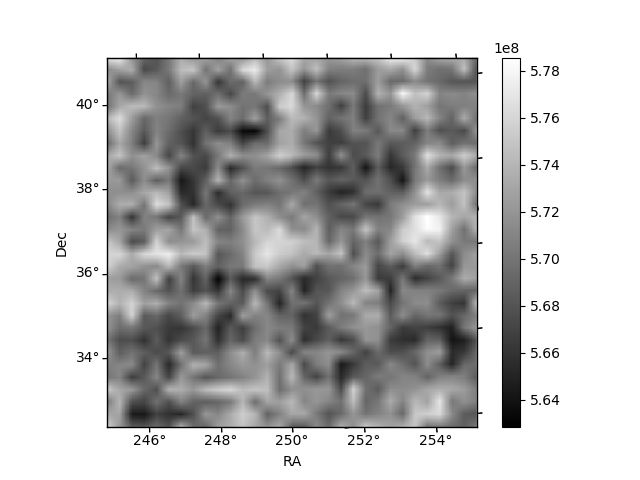
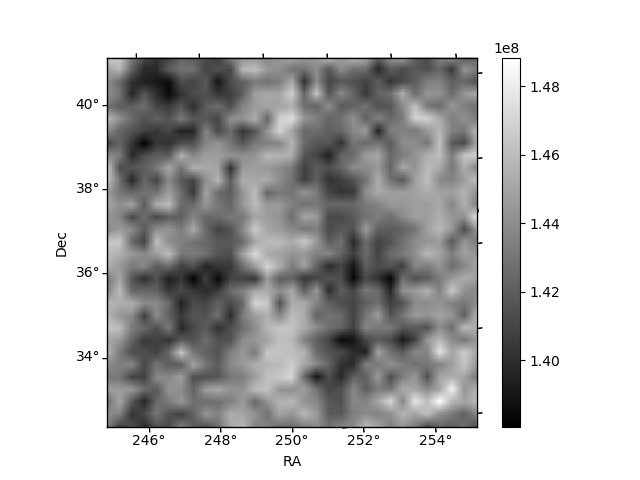
Histogram calculated using DETX and DETY for each event in the final _common_clean file
| Quadrant A | 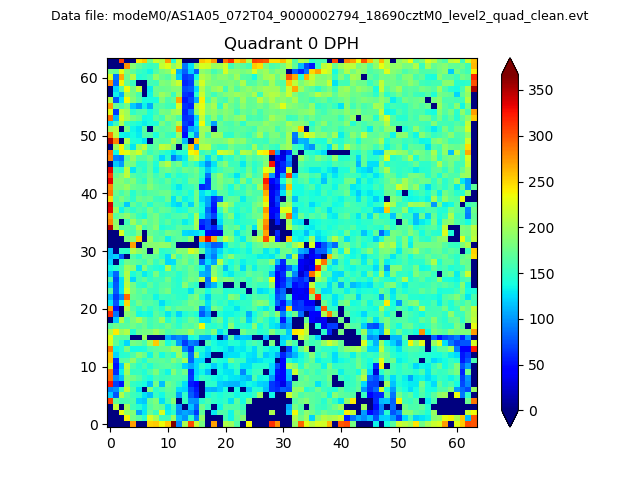 |
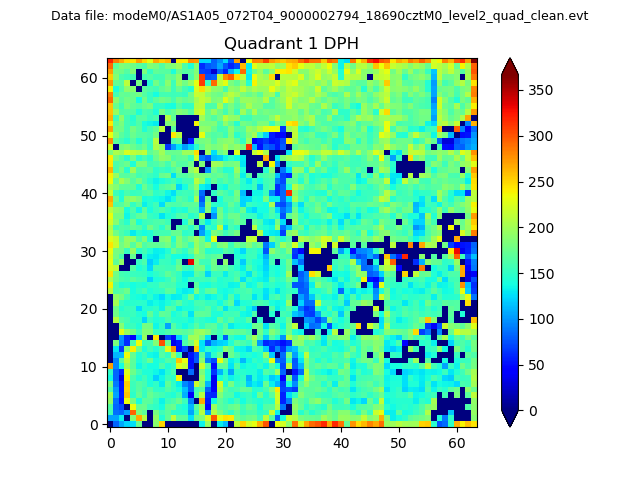 |
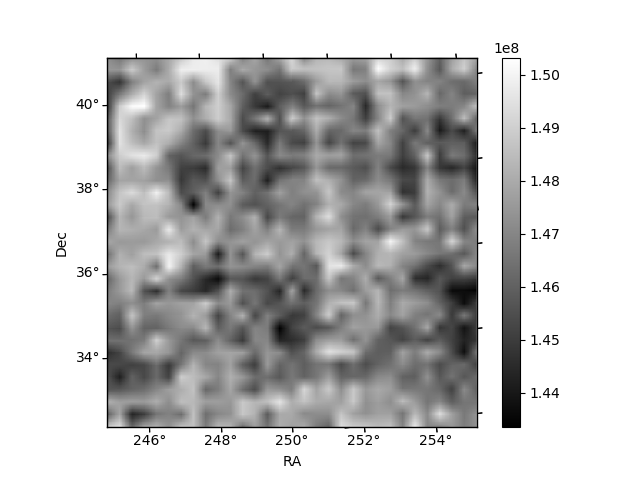
Quadrant B |
|---|---|---|---|
| Quadrant D | 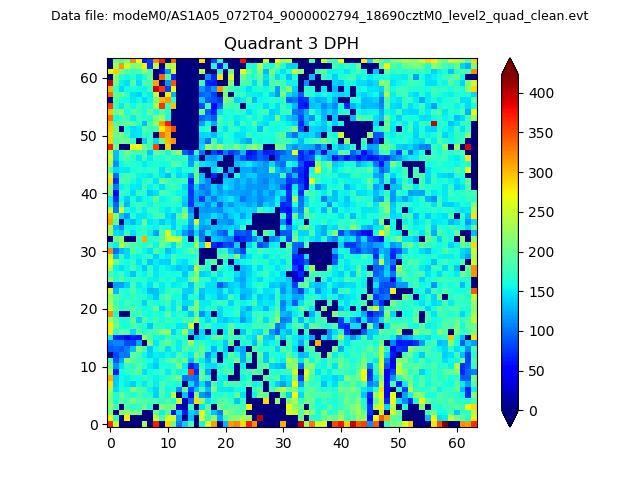 |
 |
Quadrant C |
| Plot type | Count rate plots | Images |
|---|---|---|
| Comparison with Poisson distribution Blue bars denote a histogram of data divided into 1 sec bins. Red curve is a Poisson curve with rate = median count rate of data. |
 |
 |
| Quadrant-wise count rates Data is divided into 100 sec bins |
 |
|
| Module-wise count rates for Quadrant A Data is divided into 100 sec bins |
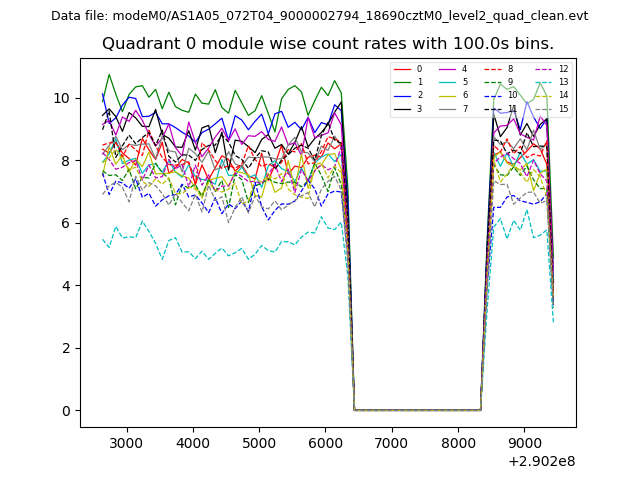 |
 |
| Module-wise count rates for Quadrant B Data is divided into 100 sec bins |
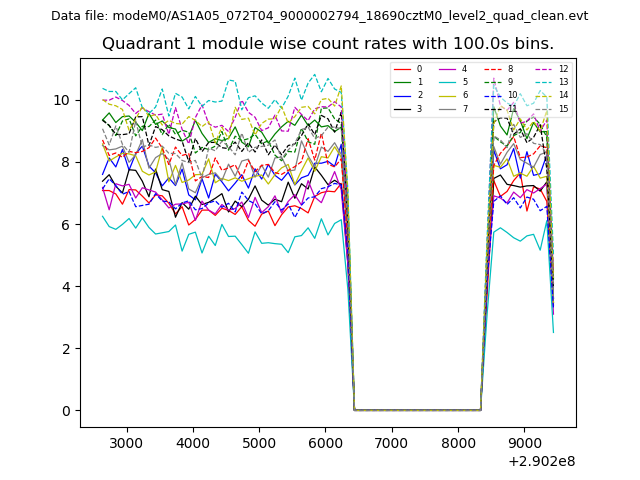 |
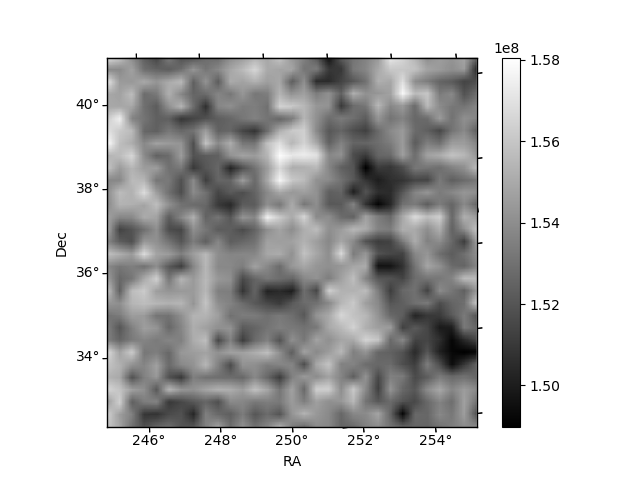 |
| Module-wise count rates for Quadrant C Data is divided into 100 sec bins |
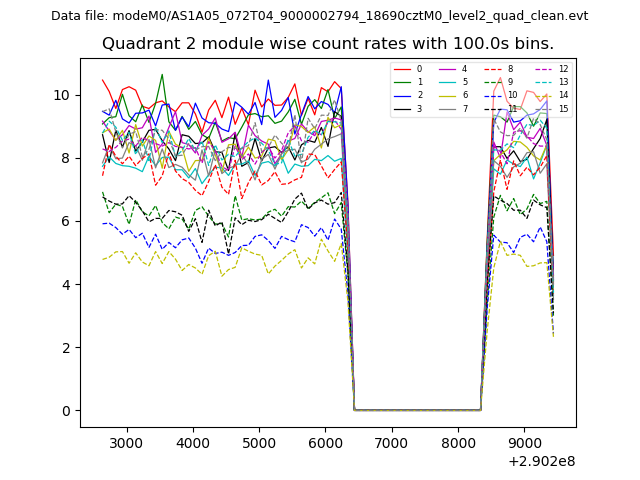 |
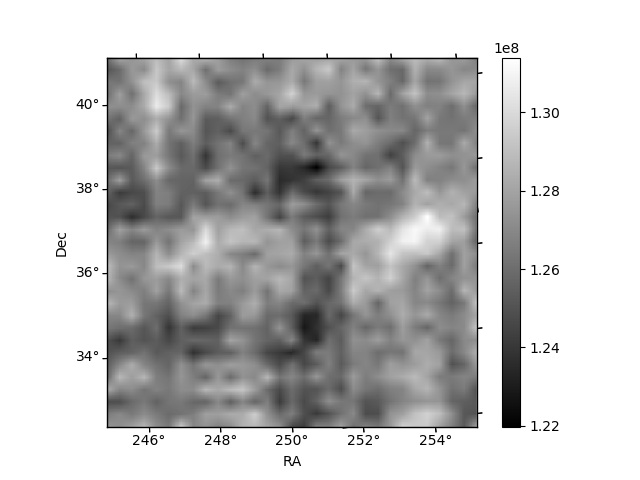 |
| Module-wise count rates for Quadrant D Data is divided into 100 sec bins |
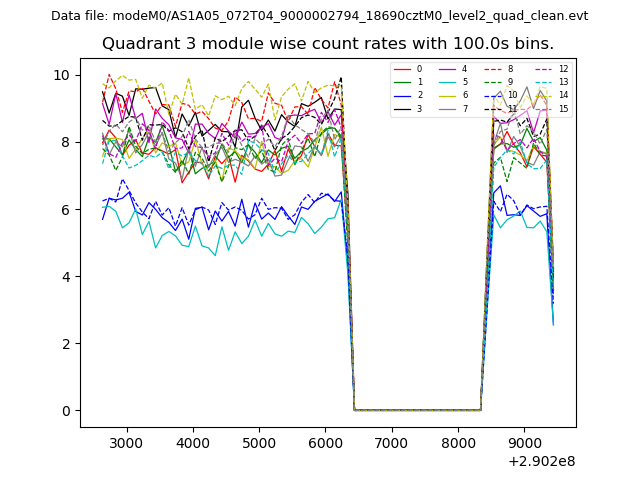 |
 |
| Parameter | Plot |
|---|---|
| CZT HV Monitor | 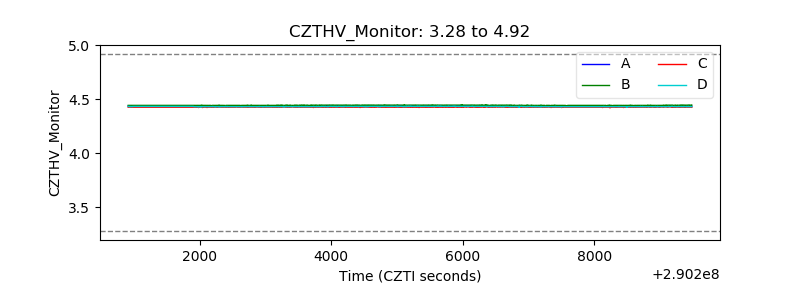 |
| D_VDD | 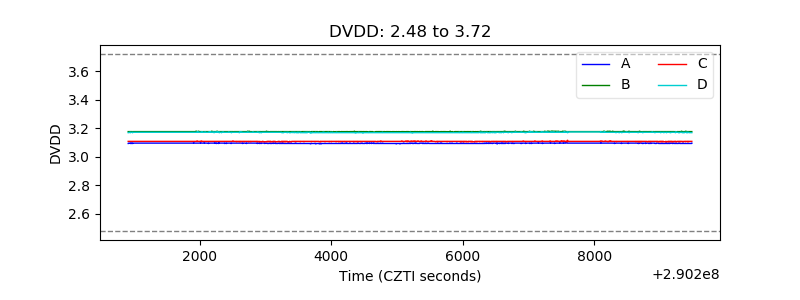 |
| Temperature 1 | 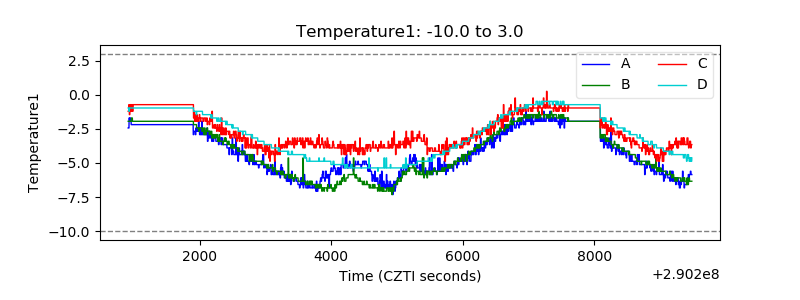 |
| Veto HV Monitor | 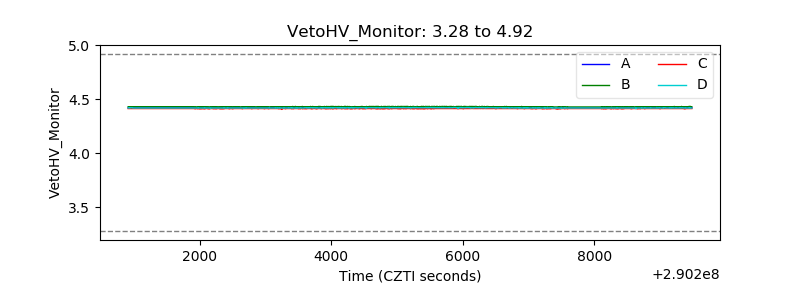 |
| Veto LLD | 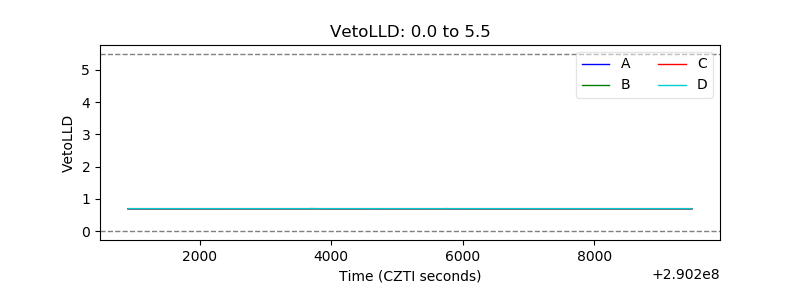 |
| Alpha Counter | 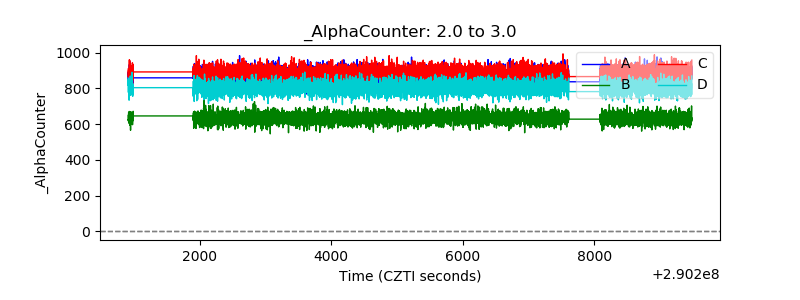 |
| _CPM_Rate |  |
| CZT Counter | 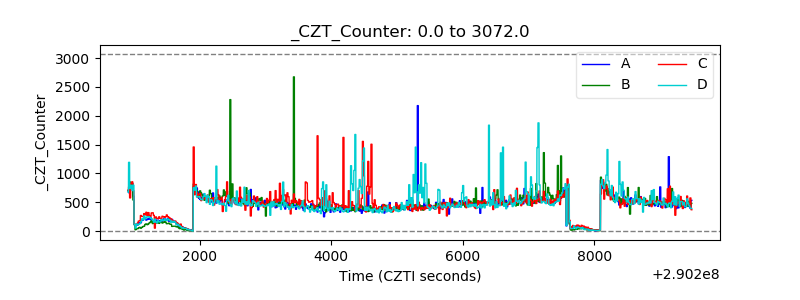 |
| +2.5 Volts monitor |  |
| +5 Volts monitor |  |
| _ROLL_ROT | 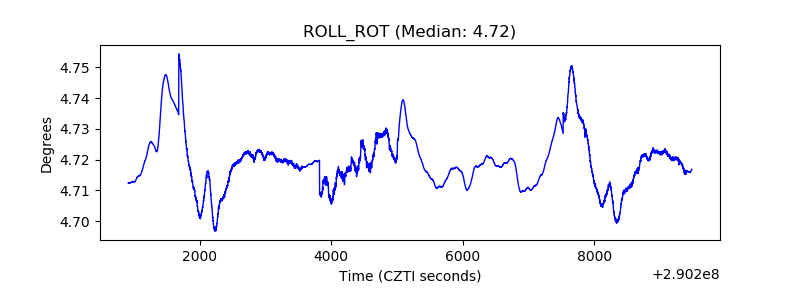 |
| _Roll_DEC | 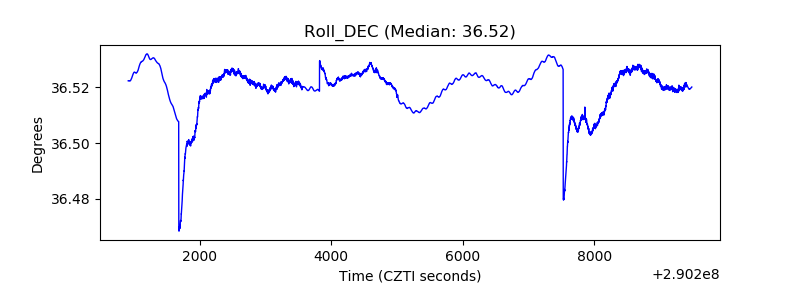 |
| _Roll_RA | 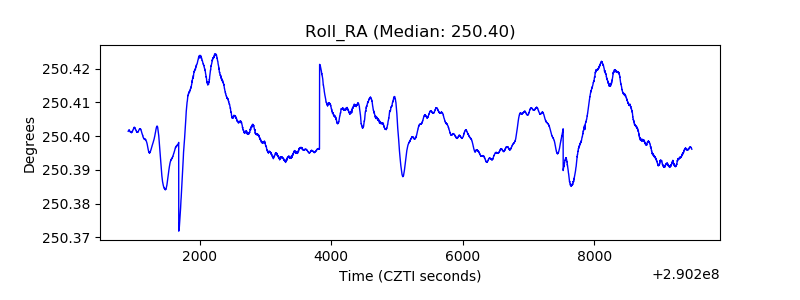 |
| Veto Counter | 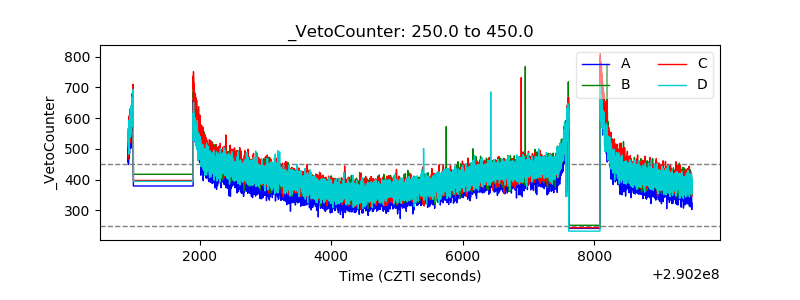 |