| Param | Original file | Final file |
|---|---|---|
| Filename | modeM0/AS1A05_072T04_9000002794_18692cztM0_level2.evt | modeM0/AS1A05_072T04_9000002794_18692cztM0_level2_quad_clean.evt |
| Size (bytes) | 564,246,720 | 106,770,240 |
| Size | 538.1 MB | 101.8 MB |
| Events in quadrant A | 3,564,484 | 682,136 |
| Events in quadrant B | 3,705,477 | 698,050 |
| Events in quadrant C | 3,904,413 | 676,743 |
| Events in quadrant D | 5,398,622 | 648,130 |
| Mode SS | |||
|---|---|---|---|
| Quadrant | BADHDUFLAG | Total packets | Discarded packets |
| A | 0 | 154 | 0 |
| B | 0 | 154 | 0 |
| C | 0 | 154 | 0 |
| D | 0 | 154 | 0 |
| Mode M9 | |||
|---|---|---|---|
| Quadrant | BADHDUFLAG | Total packets | Discarded packets |
| A | 0 | 4 | 0 |
| B | 0 | 4 | 0 |
| C | 0 | 4 | 0 |
| D | 0 | 4 | 0 |
| Mode M0 | |||
|---|---|---|---|
| Quadrant | BADHDUFLAG | Total packets | Discarded packets |
| A | 0 | 15854 | 2 |
| B | 0 | 16205 | 2 |
| C | 0 | 16710 | 2 |
| D | 0 | 21385 | 2 |
| Quadrant | Total seconds | Saturated seconds | Saturation percentage |
|---|---|---|---|
| A | 7592 | 57 | 0.750790% |
| B | 7593 | 96 | 1.264322% |
| C | 7593 | 206 | 2.713025% |
| D | 7593 | 444 | 5.847491% |
Noise dominated data is calculated using 1-second bins in cleaned event files. If a bin has >2000 counts, and if more than 50% of those come from <1% of pixels, then it is considered to be noise-dominated and hence unusable.
| Quadrant | # 1 sec bins | Bins with >0 counts | Bins with >2000 counts | High rate bins dominated by noise | Noise dominated (total time) | Noise dominated (detector-on time) | Marked lightcurve |
|---|---|---|---|---|---|---|---|
| A | 7942 | 7593 | 2 | 2 | 0.03% | 0.03% | 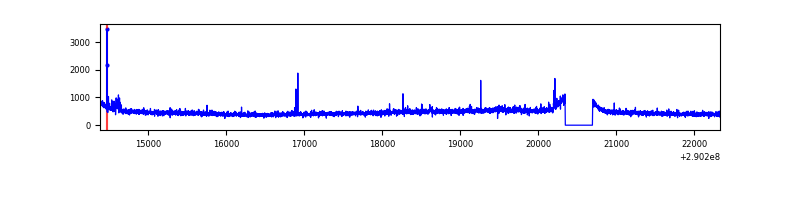 |
| B | 7943 | 7594 | 2 | 2 | 0.03% | 0.03% | 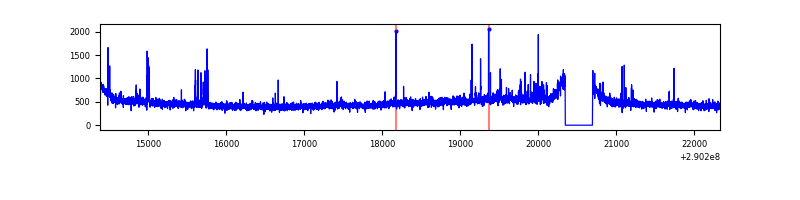 |
| C | 7943 | 7594 | 31 | 31 | 0.39% | 0.41% | 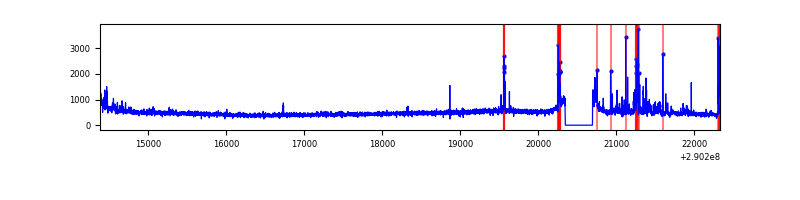 |
| D | 7943 | 7594 | 344 | 344 | 4.33% | 4.53% | 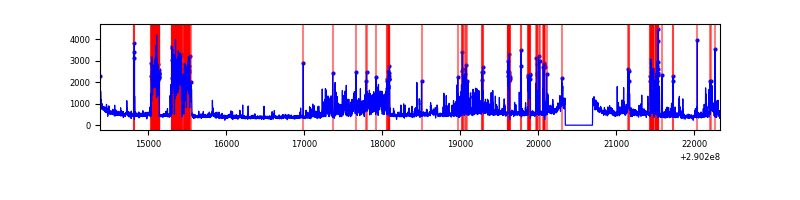 |
Top three noisy pixels from each quadrant. If the there are fewer than three noisy pixels in the level2.evt file, extra rows are filled as -1
| Pixel properties | Quadrant properties | ||||||
|---|---|---|---|---|---|---|---|
| Quadrant | DetID | PixID | Counts | Sigma | Mean | Median | Sigma |
| A | 6 | 16 | 39029 | 207.16 | 907 | 888 | 184.1 |
| A | 9 | 143 | 20818 | 108.25 | 907 | 888 | 184.1 |
| A | 13 | 254 | 10840 | 54.05 | 907 | 888 | 184.1 |
| B | 7 | 220 | 38599 | 214.78 | 911 | 887 | 175.6 |
| B | 15 | 222 | 24310 | 133.4 | 911 | 887 | 175.6 |
| B | 12 | 111 | 21381 | 116.72 | 911 | 887 | 175.6 |
| C | 9 | 54 | 266591 | 1284.8 | 876 | 882 | 206.8 |
| C | 14 | 238 | 135562 | 651.23 | 876 | 882 | 206.8 |
| C | 5 | 112 | 62014 | 295.59 | 876 | 882 | 206.8 |
| D | 1 | 52 | 1677336 | 7791.94 | 871 | 843 | 215.2 |
| D | 7 | 238 | 345334 | 1601.11 | 871 | 843 | 215.2 |
| D | 12 | 110 | 34087 | 154.51 | 871 | 843 | 215.2 |
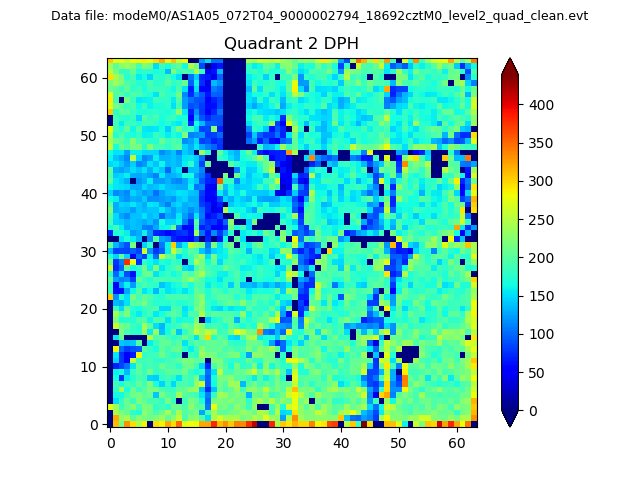
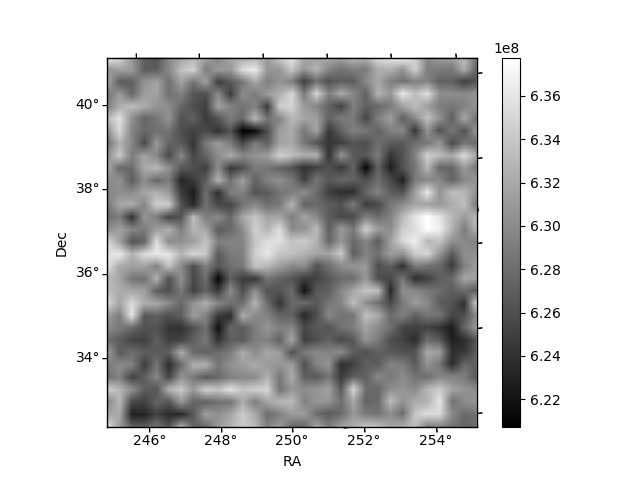
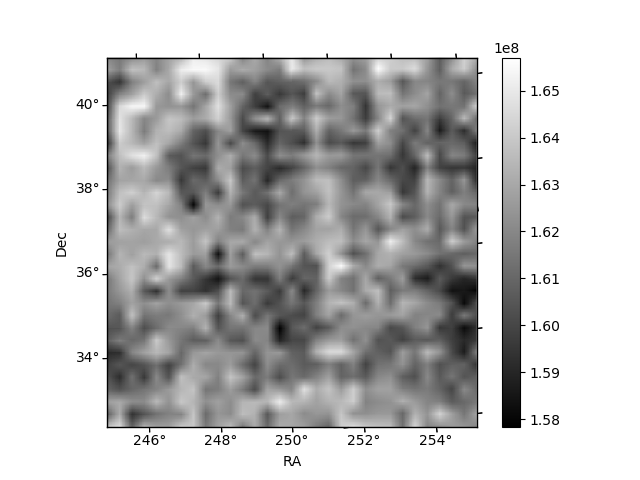
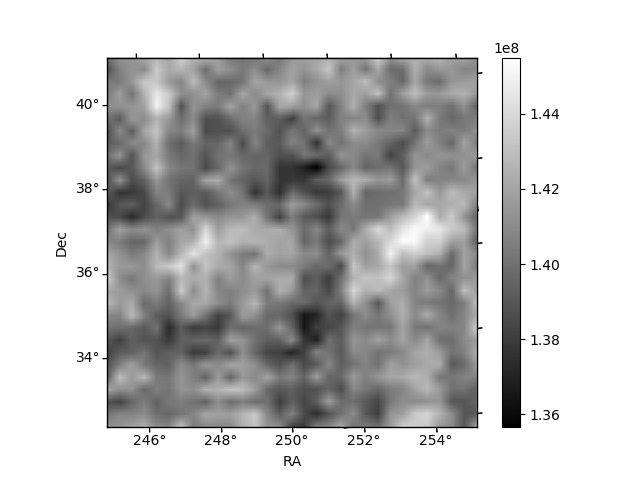
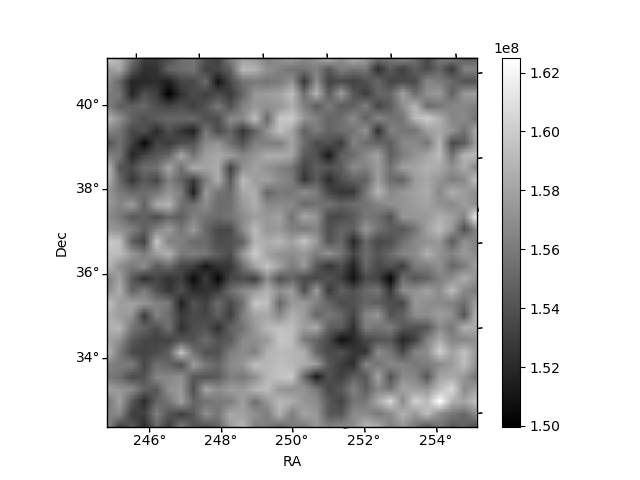
Histogram calculated using DETX and DETY for each event in the final _common_clean file
| Quadrant A | 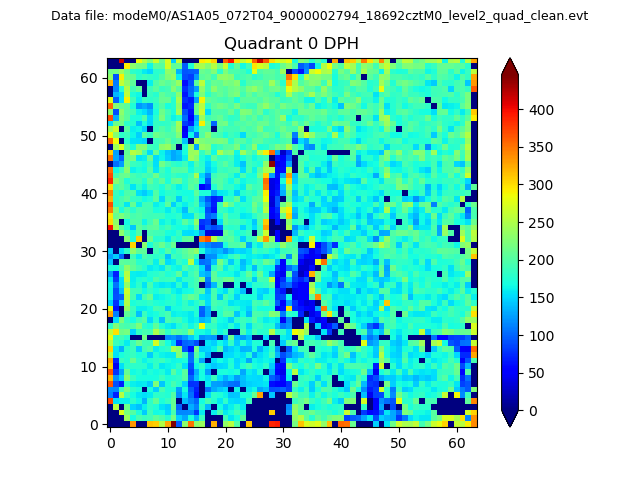 |
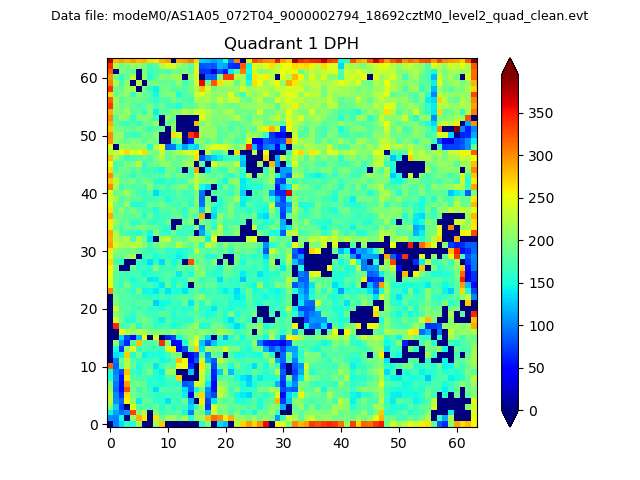 |
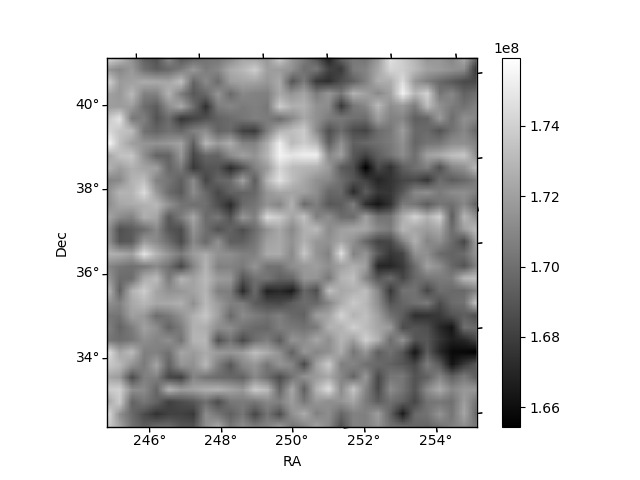
Quadrant B |
|---|---|---|---|
| Quadrant D | 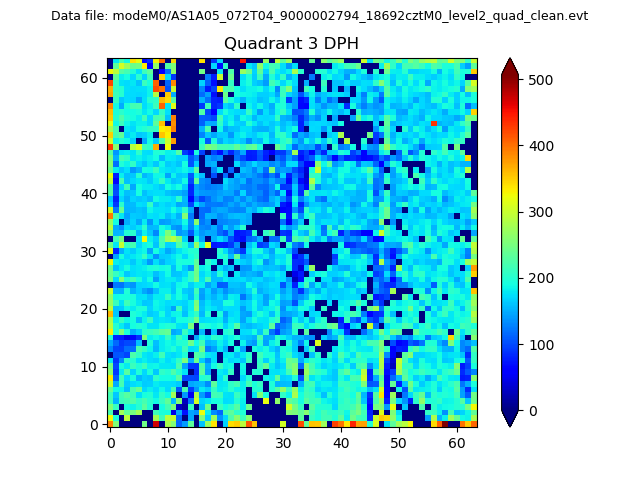 |
 |
Quadrant C |
| Plot type | Count rate plots | Images |
|---|---|---|
| Comparison with Poisson distribution Blue bars denote a histogram of data divided into 1 sec bins. Red curve is a Poisson curve with rate = median count rate of data. |
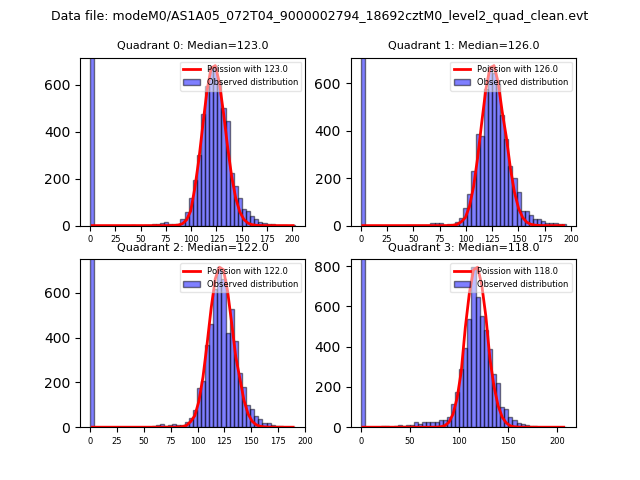 |
 |
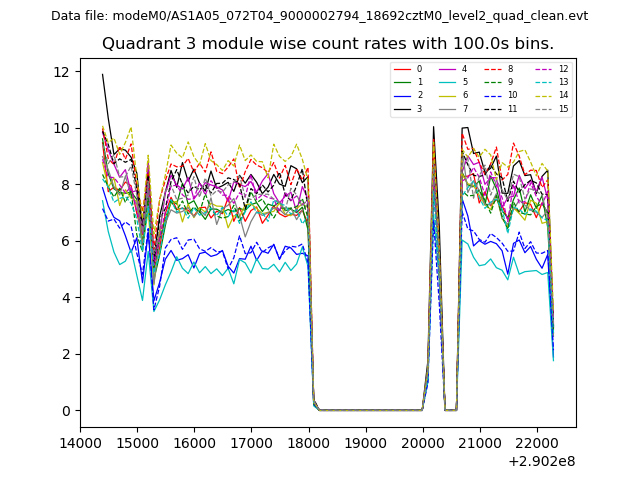
| Quadrant-wise count rates Data is divided into 100 sec bins |
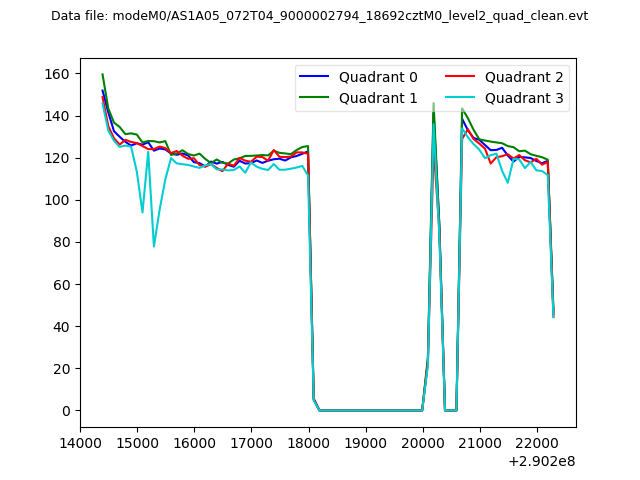 |
|
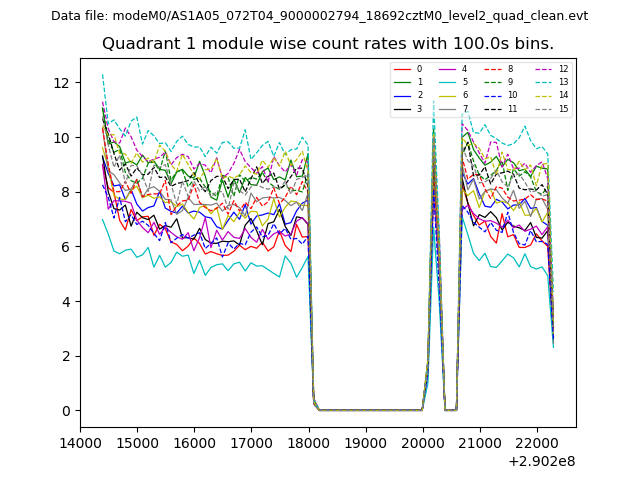
| Module-wise count rates for Quadrant A Data is divided into 100 sec bins |
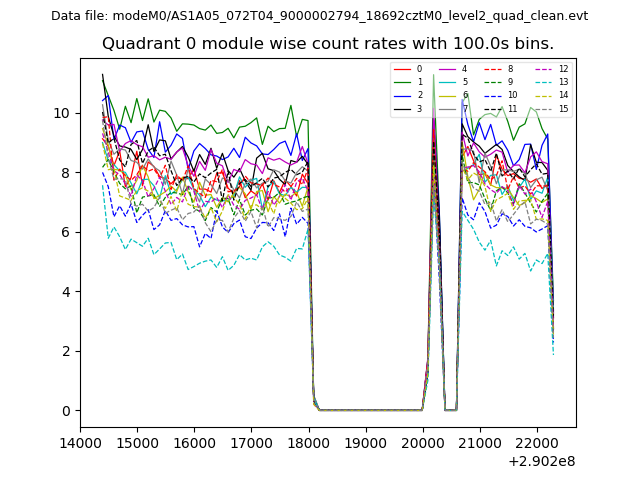 |
 |
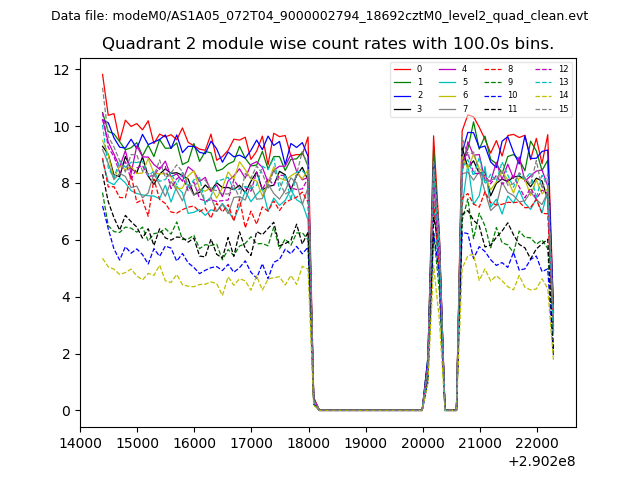
| Module-wise count rates for Quadrant B Data is divided into 100 sec bins |
 |
 |
| Module-wise count rates for Quadrant C Data is divided into 100 sec bins |
 |
 |
| Module-wise count rates for Quadrant D Data is divided into 100 sec bins |
 |
 |
| Parameter | Plot |
|---|---|
| CZT HV Monitor | 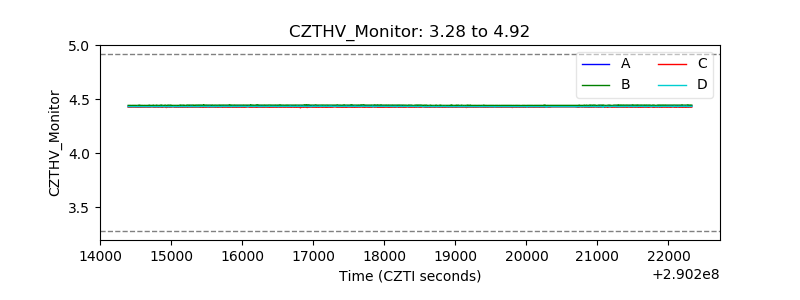 |
| D_VDD | 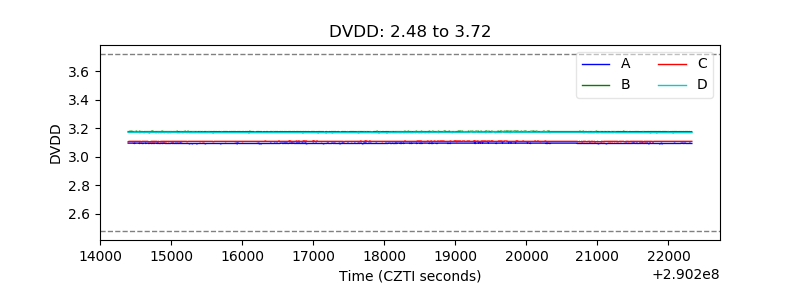 |
| Temperature 1 | 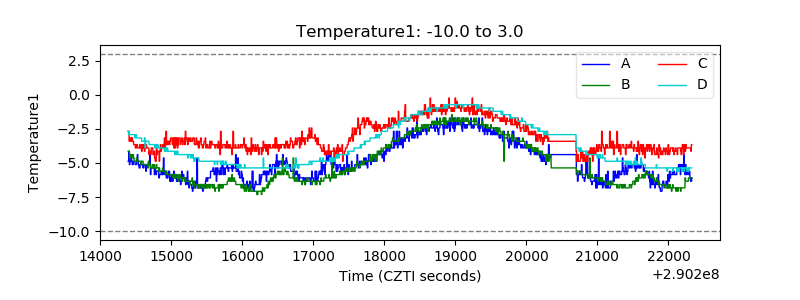 |
| Veto HV Monitor | 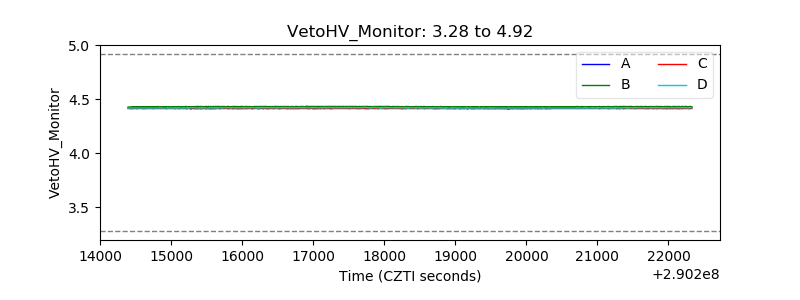 |
| Veto LLD | 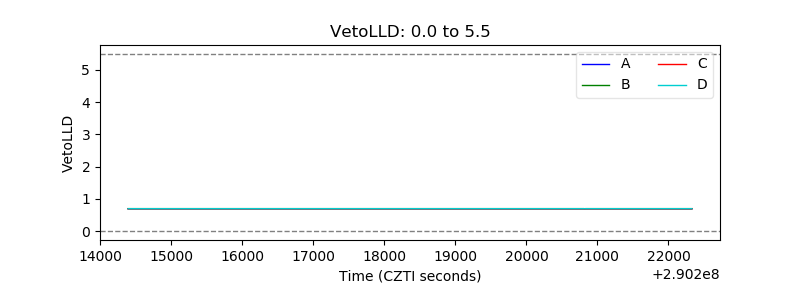 |
| Alpha Counter | 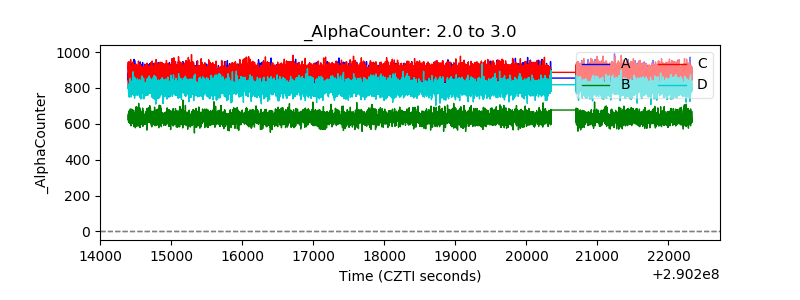 |
| _CPM_Rate | 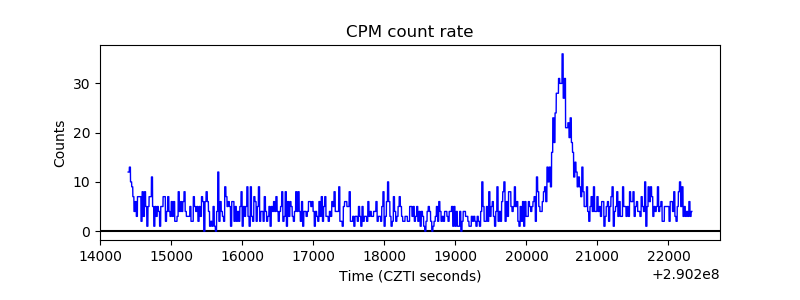 |
| CZT Counter | 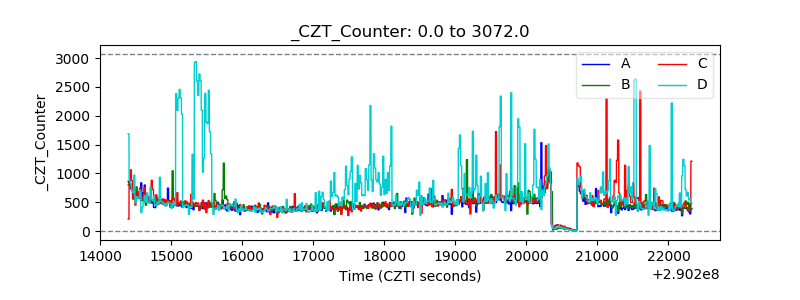 |
| +2.5 Volts monitor |  |
| +5 Volts monitor |  |
| _ROLL_ROT | 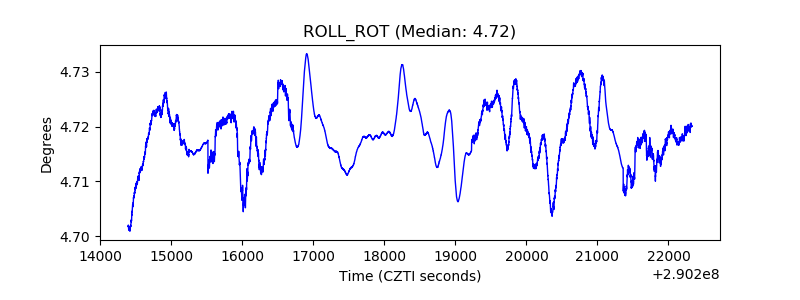 |
| _Roll_DEC | 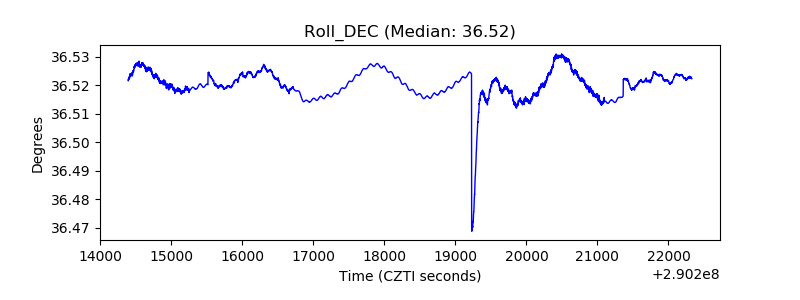 |
| _Roll_RA | 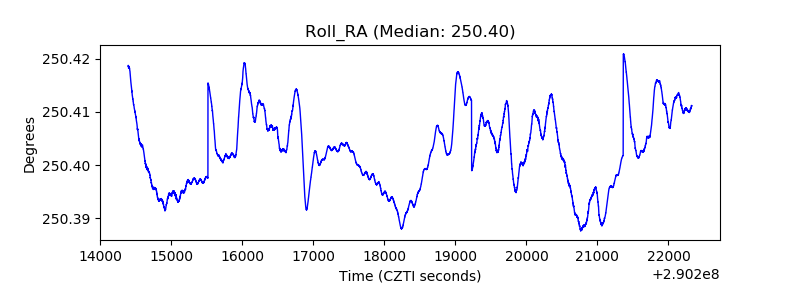 |
| Veto Counter | 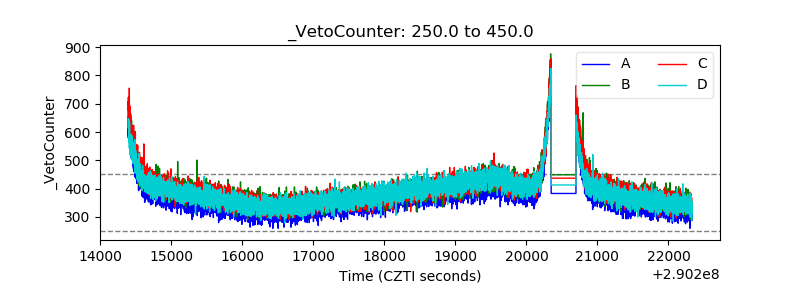 |