| Param | Original file | Final file |
|---|---|---|
| Filename | modeM0/AS1A05_072T04_9000002794_18694cztM0_level2.evt | modeM0/AS1A05_072T04_9000002794_18694cztM0_level2_quad_clean.evt |
| Size (bytes) | 563,708,160 | 110,352,960 |
| Size | 537.6 MB | 105.2 MB |
| Events in quadrant A | 3,689,646 | 701,449 |
| Events in quadrant B | 3,758,664 | 719,707 |
| Events in quadrant C | 4,090,973 | 695,037 |
| Events in quadrant D | 4,996,873 | 676,926 |
| Mode SS | |||
|---|---|---|---|
| Quadrant | BADHDUFLAG | Total packets | Discarded packets |
| A | 0 | 162 | 0 |
| B | 0 | 162 | 0 |
| C | 0 | 162 | 0 |
| D | 0 | 162 | 0 |
| Mode M9 | |||
|---|---|---|---|
| Quadrant | BADHDUFLAG | Total packets | Discarded packets |
| A | 0 | 9 | 0 |
| B | 0 | 9 | 0 |
| C | 0 | 9 | 0 |
| D | 0 | 9 | 0 |
| Mode M0 | |||
|---|---|---|---|
| Quadrant | BADHDUFLAG | Total packets | Discarded packets |
| A | 0 | 16450 | 2 |
| B | 0 | 16568 | 2 |
| C | 0 | 17478 | 2 |
| D | 0 | 20352 | 2 |
| Quadrant | Total seconds | Saturated seconds | Saturation percentage |
|---|---|---|---|
| A | 7895 | 80 | 1.013300% |
| B | 7895 | 115 | 1.456618% |
| C | 7895 | 218 | 2.761241% |
| D | 7896 | 260 | 3.292806% |
Noise dominated data is calculated using 1-second bins in cleaned event files. If a bin has >2000 counts, and if more than 50% of those come from <1% of pixels, then it is considered to be noise-dominated and hence unusable.
| Quadrant | # 1 sec bins | Bins with >0 counts | Bins with >2000 counts | High rate bins dominated by noise | Noise dominated (total time) | Noise dominated (detector-on time) | Marked lightcurve |
|---|---|---|---|---|---|---|---|
| A | 8760 | 7897 | 6 | 6 | 0.07% | 0.08% | 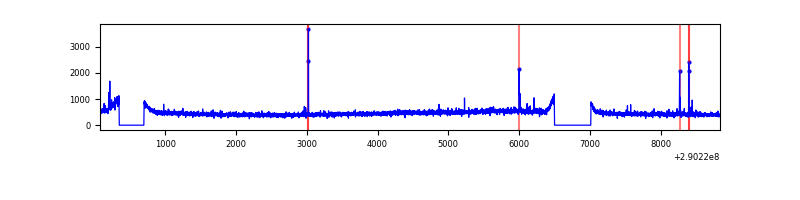 |
| B | 8760 | 7897 | 2 | 2 | 0.02% | 0.03% | 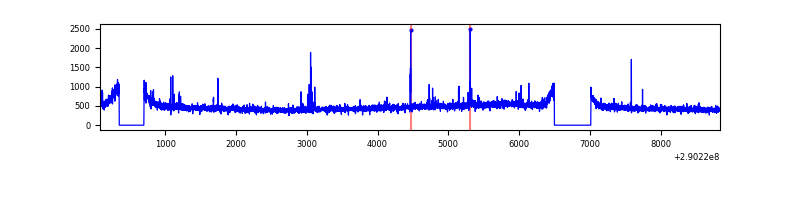 |
| C | 8760 | 7897 | 39 | 39 | 0.45% | 0.49% | 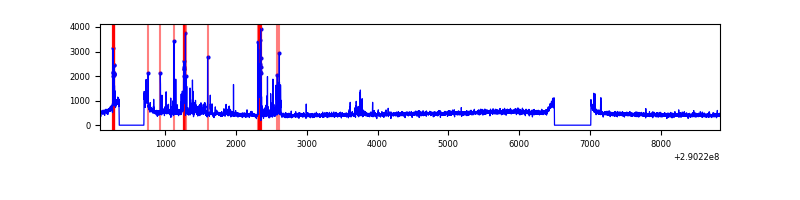 |
| D | 8761 | 7898 | 172 | 172 | 1.96% | 2.18% | 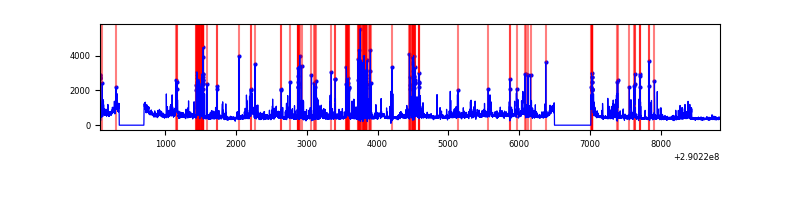 |
Top three noisy pixels from each quadrant. If the there are fewer than three noisy pixels in the level2.evt file, extra rows are filled as -1
| Pixel properties | Quadrant properties | ||||||
|---|---|---|---|---|---|---|---|
| Quadrant | DetID | PixID | Counts | Sigma | Mean | Median | Sigma |
| A | 0 | 13 | 29149 | 147.35 | 940 | 923 | 191.6 |
| A | 9 | 143 | 21357 | 106.67 | 940 | 923 | 191.6 |
| A | 13 | 254 | 11704 | 56.28 | 940 | 923 | 191.6 |
| B | 12 | 111 | 22518 | 117.93 | 943 | 917 | 183.2 |
| B | 11 | 111 | 19380 | 100.8 | 943 | 917 | 183.2 |
| B | 4 | 216 | 17512 | 90.6 | 943 | 917 | 183.2 |
| C | 9 | 54 | 343182 | 1609.81 | 903 | 909 | 212.6 |
| C | 14 | 238 | 139171 | 650.29 | 903 | 909 | 212.6 |
| C | 5 | 112 | 41195 | 189.48 | 903 | 909 | 212.6 |
| D | 1 | 52 | 1235788 | 5565.81 | 906 | 880 | 221.9 |
| D | 7 | 238 | 317010 | 1424.82 | 906 | 880 | 221.9 |
| D | 2 | 234 | 35100 | 154.23 | 906 | 880 | 221.9 |
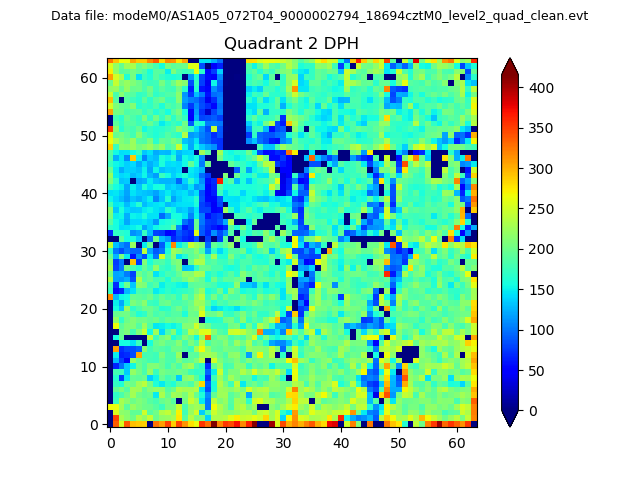
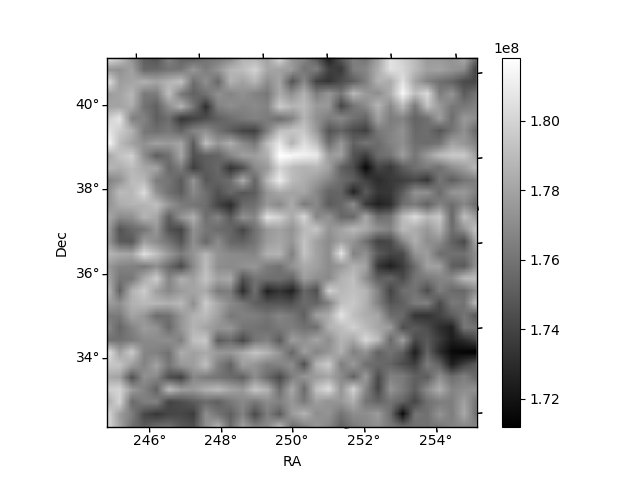
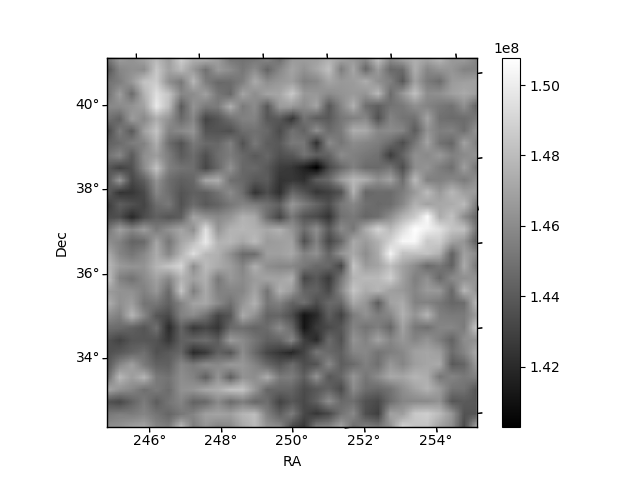
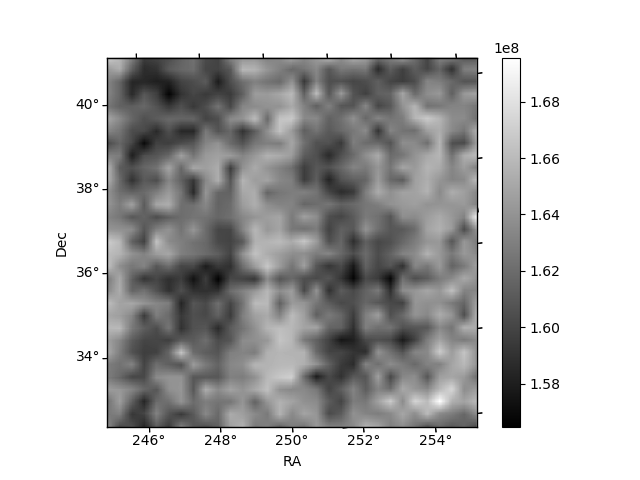
Histogram calculated using DETX and DETY for each event in the final _common_clean file
| Quadrant A | 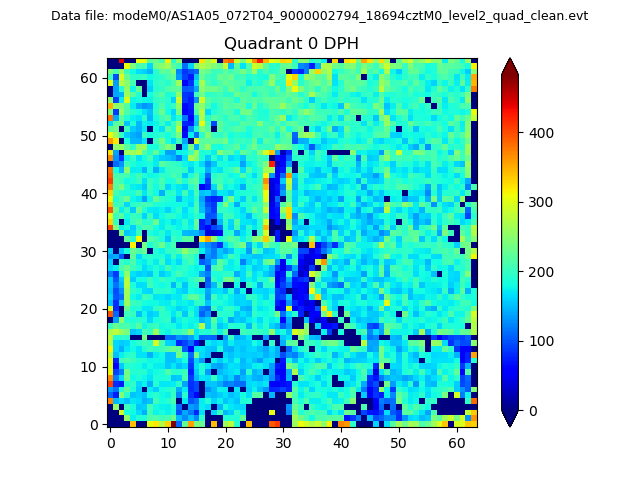 |
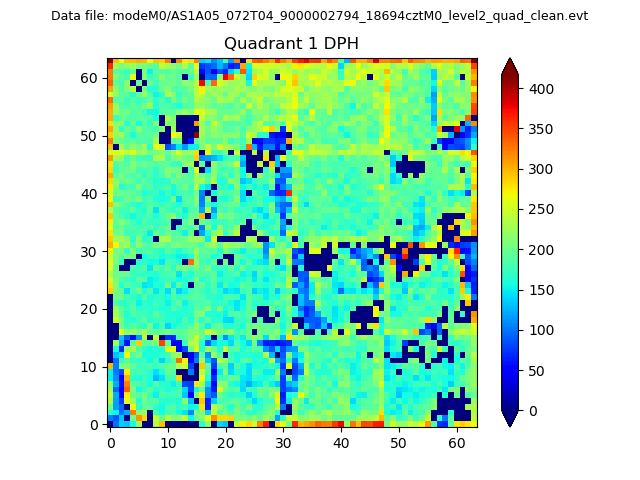 |
Quadrant B |
|---|---|---|---|
| Quadrant D | 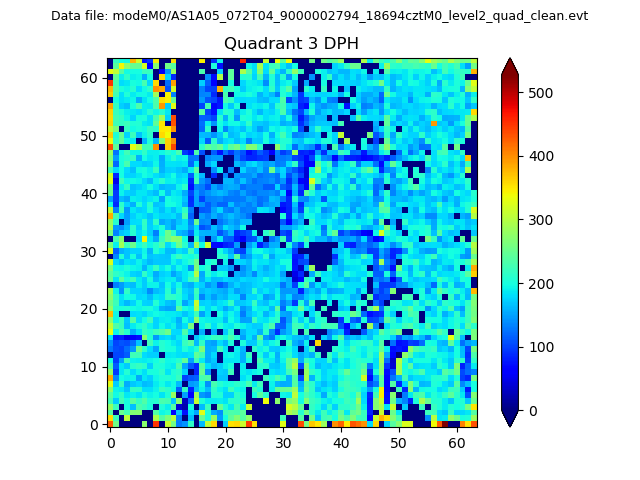 |
 |
Quadrant C |
| Plot type | Count rate plots | Images |
|---|---|---|
| Comparison with Poisson distribution Blue bars denote a histogram of data divided into 1 sec bins. Red curve is a Poisson curve with rate = median count rate of data. |
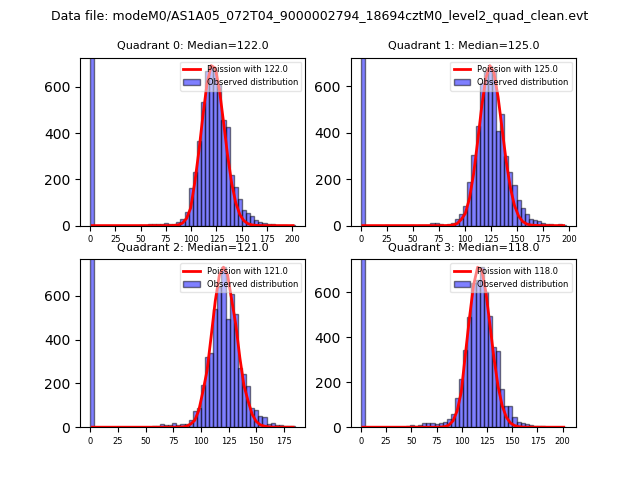 |
 |
| Quadrant-wise count rates Data is divided into 100 sec bins |
 |
|
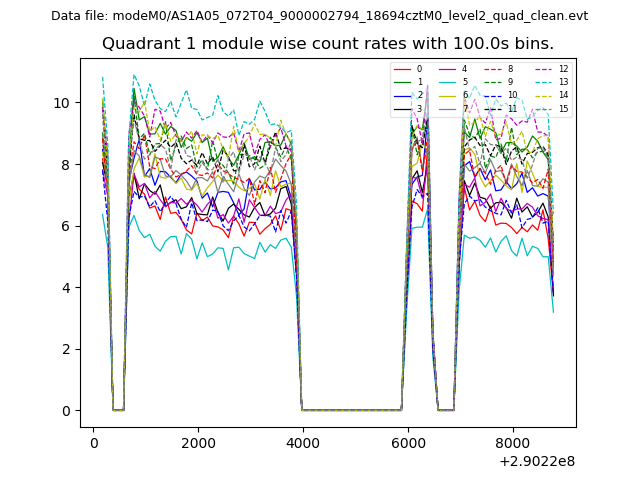
| Module-wise count rates for Quadrant A Data is divided into 100 sec bins |
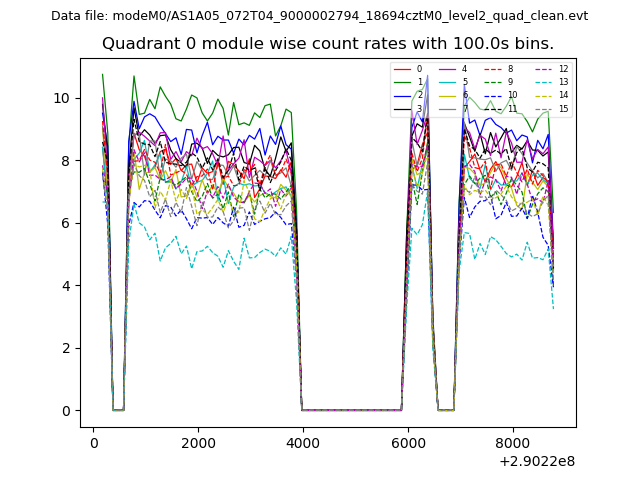 |
 |
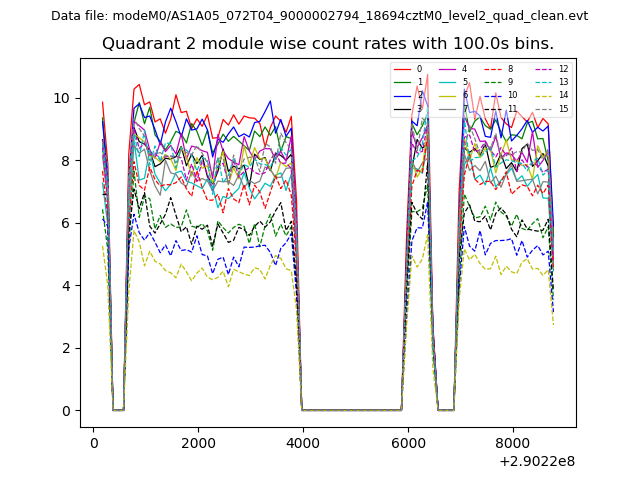
| Module-wise count rates for Quadrant B Data is divided into 100 sec bins |
 |
 |
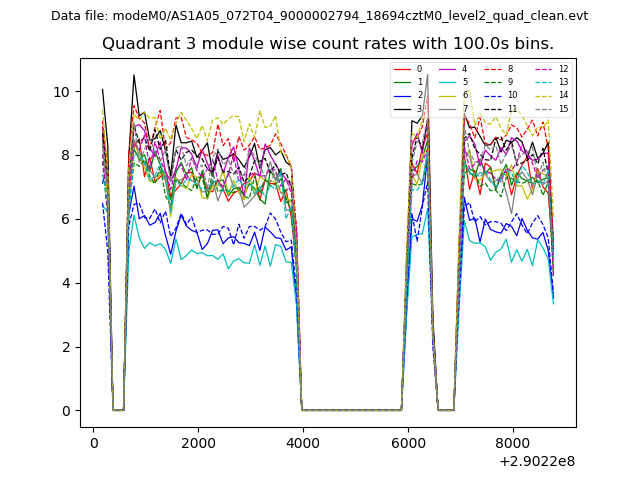
| Module-wise count rates for Quadrant C Data is divided into 100 sec bins |
 |
 |
| Module-wise count rates for Quadrant D Data is divided into 100 sec bins |
 |
 |
| Parameter | Plot |
|---|---|
| CZT HV Monitor | 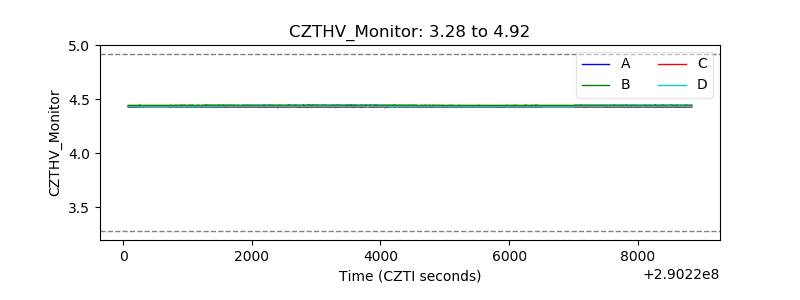 |
| D_VDD | 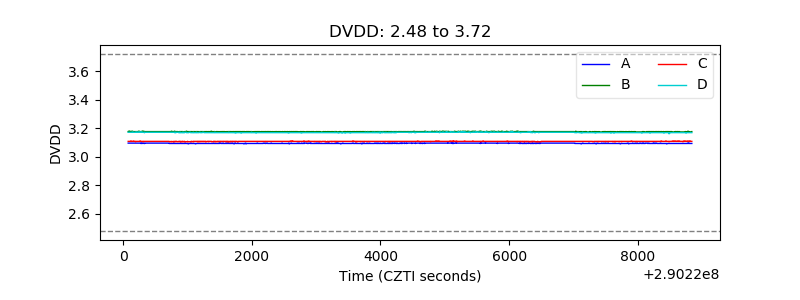 |
| Temperature 1 | 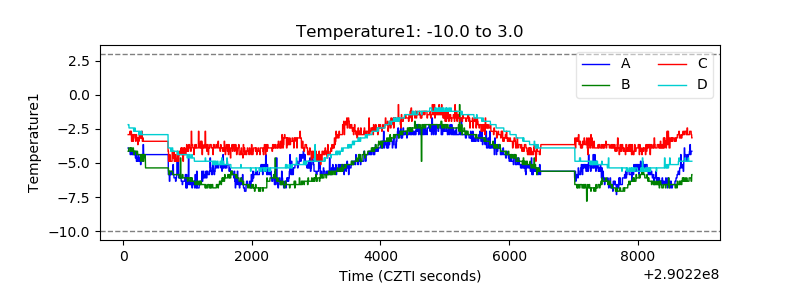 |
| Veto HV Monitor |  |
| Veto LLD | 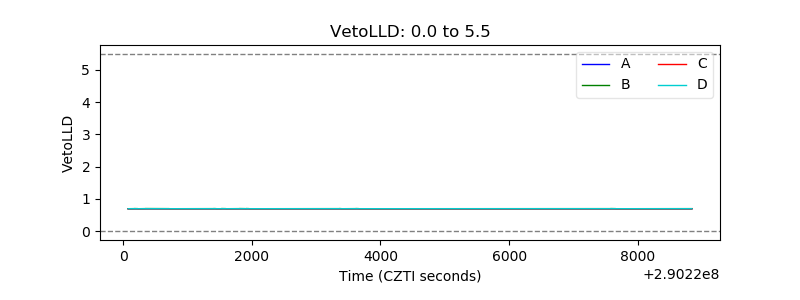 |
| Alpha Counter | 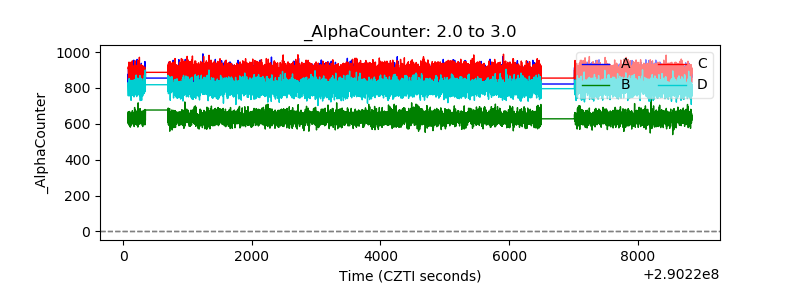 |
| _CPM_Rate | 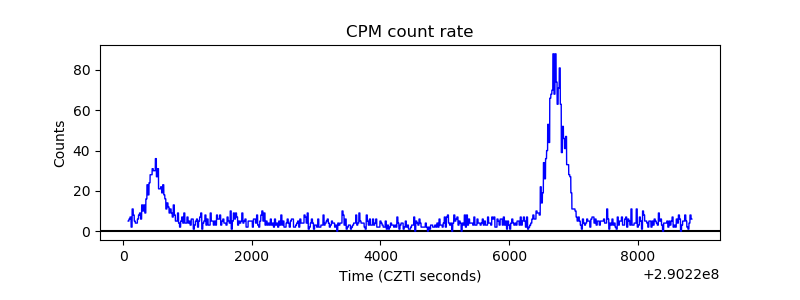 |
| CZT Counter | 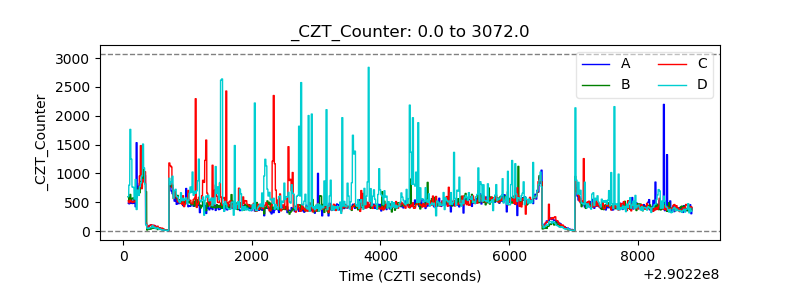 |
| +2.5 Volts monitor | 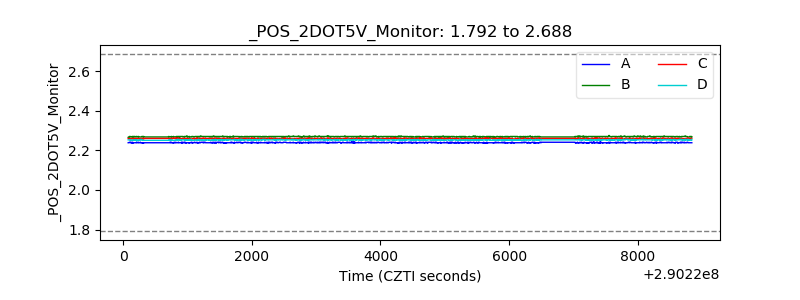 |
| +5 Volts monitor |  |
| _ROLL_ROT | 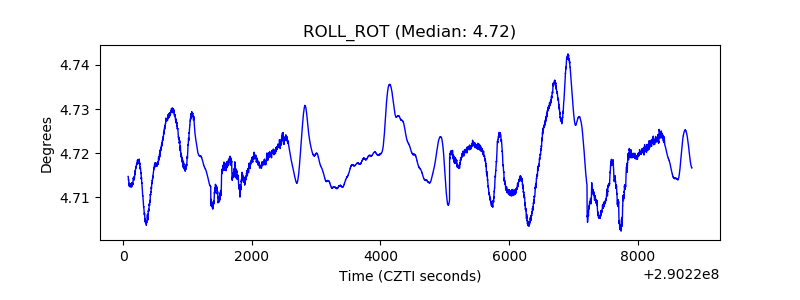 |
| _Roll_DEC | 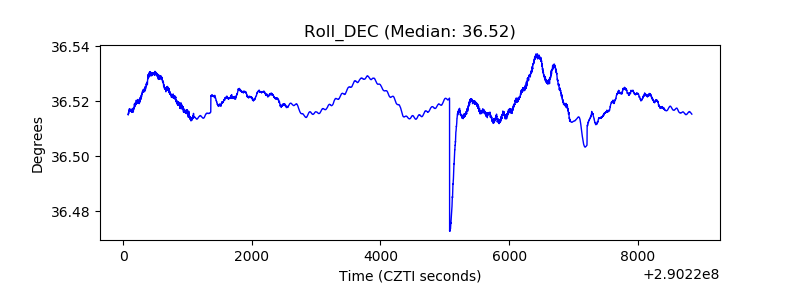 |
| _Roll_RA | 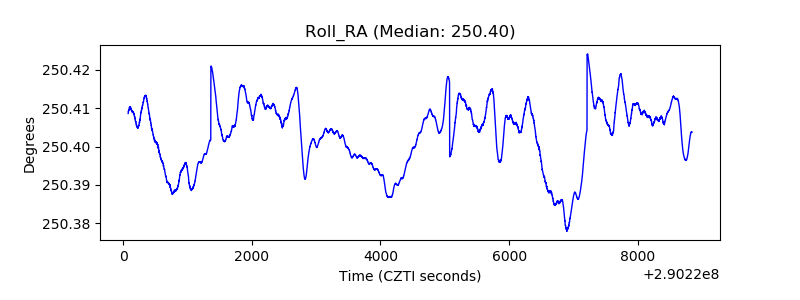 |
| Veto Counter | 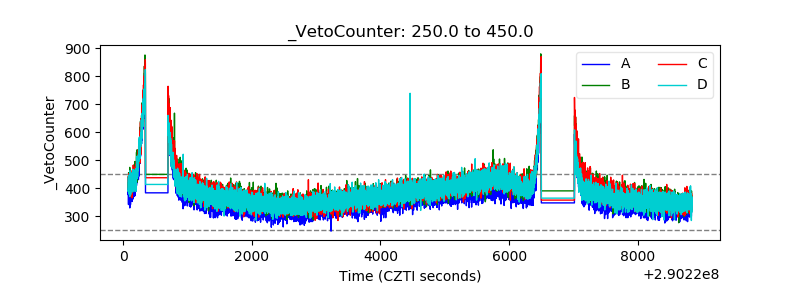 |