| Param | Original file | Final file |
|---|---|---|
| Filename | modeM0/AS1A05_072T04_9000002794_18695cztM0_level2.evt | modeM0/AS1A05_072T04_9000002794_18695cztM0_level2_quad_clean.evt |
| Size (bytes) | 752,008,320 | 135,216,000 |
| Size | 717.2 MB | 129.0 MB |
| Events in quadrant A | 5,166,211 | 836,753 |
| Events in quadrant B | 5,201,817 | 857,870 |
| Events in quadrant C | 5,757,239 | 833,966 |
| Events in quadrant D | 5,914,080 | 815,447 |
| Mode SS | |||
|---|---|---|---|
| Quadrant | BADHDUFLAG | Total packets | Discarded packets |
| A | 0 | 220 | 0 |
| B | 0 | 220 | 0 |
| C | 0 | 220 | 0 |
| D | 0 | 220 | 0 |
| Mode M9 | |||
|---|---|---|---|
| Quadrant | BADHDUFLAG | Total packets | Discarded packets |
| A | 0 | 16 | 0 |
| B | 0 | 16 | 0 |
| C | 0 | 16 | 0 |
| D | 0 | 16 | 0 |
| Mode M0 | |||
|---|---|---|---|
| Quadrant | BADHDUFLAG | Total packets | Discarded packets |
| A | 0 | 22505 | 2 |
| B | 0 | 22461 | 2 |
| C | 0 | 24376 | 2 |
| D | 0 | 25152 | 2 |
| Quadrant | Total seconds | Saturated seconds | Saturation percentage |
|---|---|---|---|
| A | 10853 | 114 | 1.050401% |
| B | 10854 | 95 | 0.875253% |
| C | 10854 | 220 | 2.026903% |
| D | 10854 | 208 | 1.916344% |
Noise dominated data is calculated using 1-second bins in cleaned event files. If a bin has >2000 counts, and if more than 50% of those come from <1% of pixels, then it is considered to be noise-dominated and hence unusable.
| Quadrant | # 1 sec bins | Bins with >0 counts | Bins with >2000 counts | High rate bins dominated by noise | Noise dominated (total time) | Noise dominated (detector-on time) | Marked lightcurve |
|---|---|---|---|---|---|---|---|
| A | 12338 | 10855 | 25 | 25 | 0.20% | 0.23% | 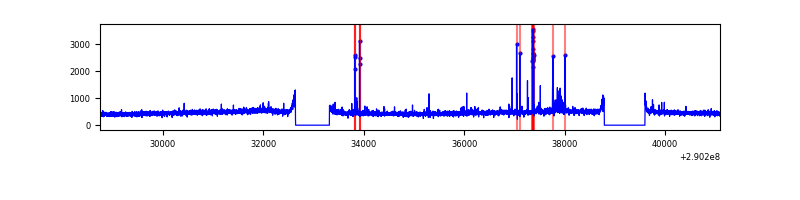 |
| B | 12339 | 10855 | 4 | 4 | 0.03% | 0.04% | 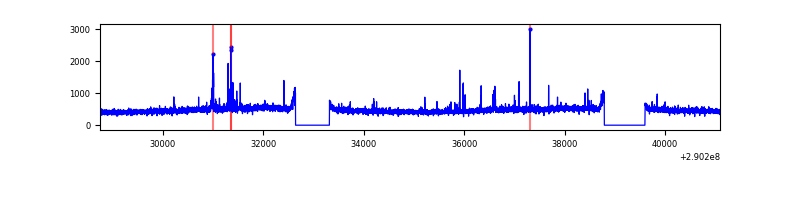 |
| C | 12339 | 10856 | 50 | 50 | 0.41% | 0.46% | 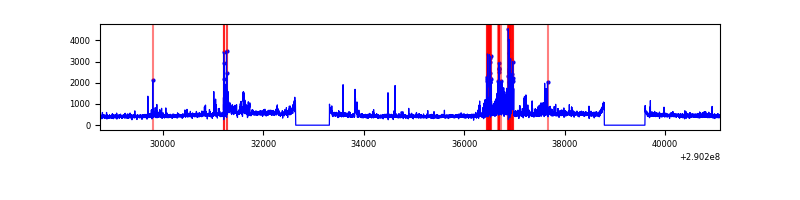 |
| D | 12339 | 10856 | 114 | 114 | 0.92% | 1.05% | 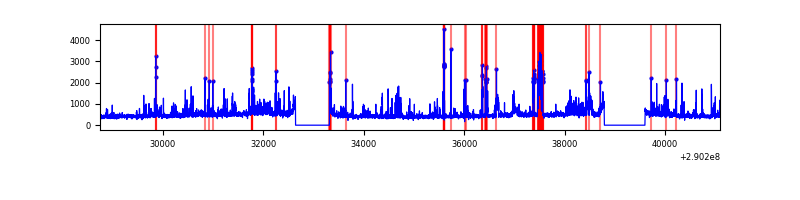 |
Top three noisy pixels from each quadrant. If the there are fewer than three noisy pixels in the level2.evt file, extra rows are filled as -1
| Pixel properties | Quadrant properties | ||||||
|---|---|---|---|---|---|---|---|
| Quadrant | DetID | PixID | Counts | Sigma | Mean | Median | Sigma |
| A | 6 | 16 | 127611 | 483.34 | 1290 | 1264 | 261.4 |
| A | 15 | 192 | 19498 | 69.75 | 1290 | 1264 | 261.4 |
| A | 13 | 254 | 16487 | 58.24 | 1290 | 1264 | 261.4 |
| B | 0 | 190 | 58520 | 233.82 | 1289 | 1257 | 244.9 |
| B | 0 | 197 | 32844 | 128.98 | 1289 | 1257 | 244.9 |
| B | 12 | 111 | 30359 | 118.83 | 1289 | 1257 | 244.9 |
| C | 3 | 233 | 638921 | 2200.36 | 1236 | 1243 | 289.8 |
| C | 14 | 238 | 192029 | 658.32 | 1236 | 1243 | 289.8 |
| C | 0 | 207 | 54177 | 182.65 | 1236 | 1243 | 289.8 |
| D | 1 | 52 | 939594 | 3087.2 | 1250 | 1211 | 304.0 |
| D | 7 | 238 | 230775 | 755.25 | 1250 | 1211 | 304.0 |
| D | 2 | 234 | 46067 | 147.57 | 1250 | 1211 | 304.0 |
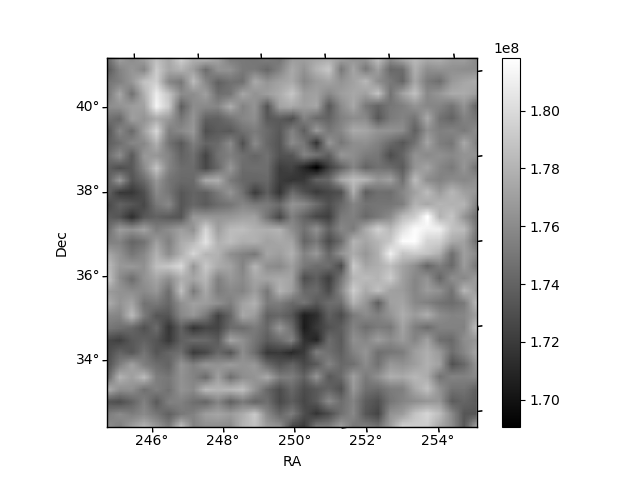
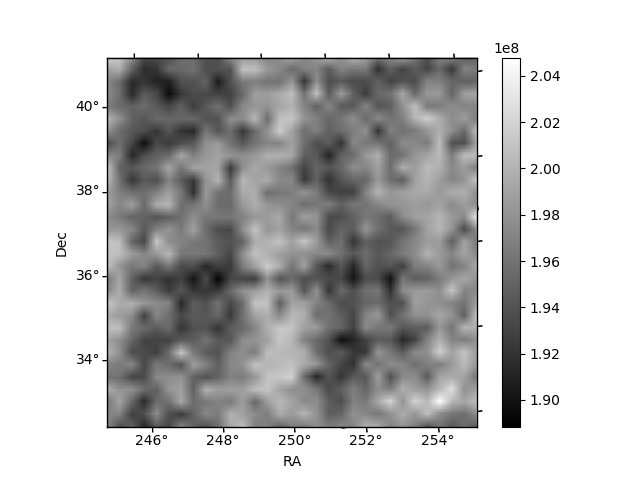
Histogram calculated using DETX and DETY for each event in the final _common_clean file
| Quadrant A |  |
 |
Quadrant B |
|---|---|---|---|
| Quadrant D |  |
 |
Quadrant C |
| Plot type | Count rate plots | Images |
|---|---|---|
| Comparison with Poisson distribution Blue bars denote a histogram of data divided into 1 sec bins. Red curve is a Poisson curve with rate = median count rate of data. |
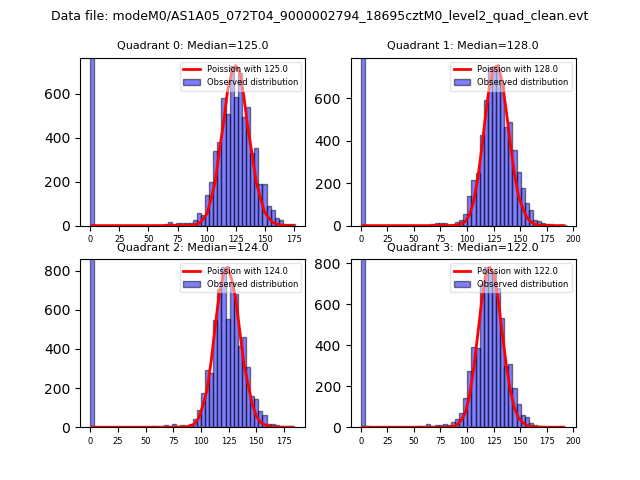 |
 |
| Quadrant-wise count rates Data is divided into 100 sec bins |
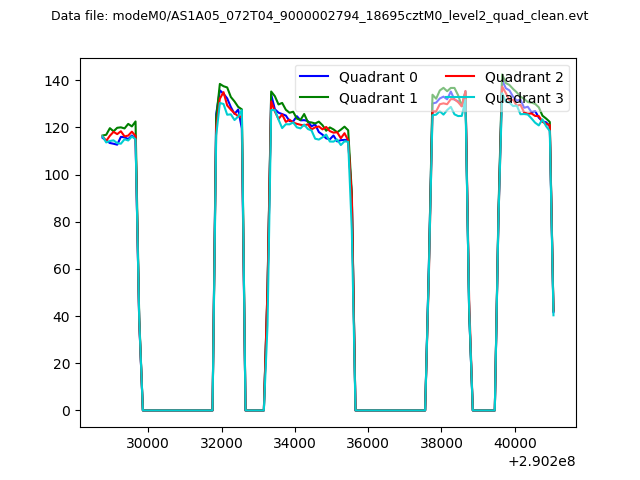 |
|
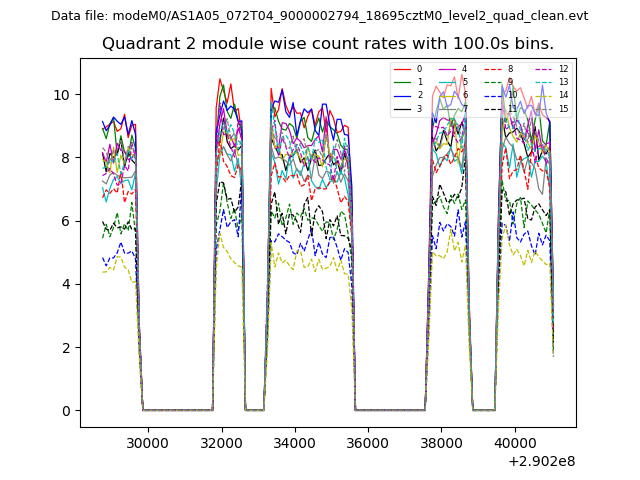
| Module-wise count rates for Quadrant A Data is divided into 100 sec bins |
 |
 |
| Module-wise count rates for Quadrant B Data is divided into 100 sec bins |
 |
 |
| Module-wise count rates for Quadrant C Data is divided into 100 sec bins |
 |
 |
| Module-wise count rates for Quadrant D Data is divided into 100 sec bins |
 |
 |
| Parameter | Plot |
|---|---|
| CZT HV Monitor |  |
| D_VDD |  |
| Temperature 1 |  |
| Veto HV Monitor |  |
| Veto LLD |  |
| Alpha Counter | 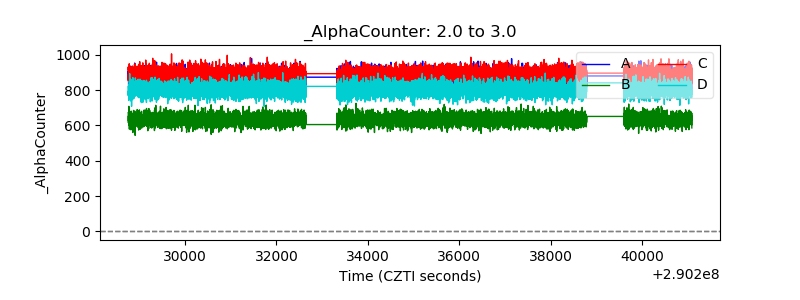 |
| _CPM_Rate | 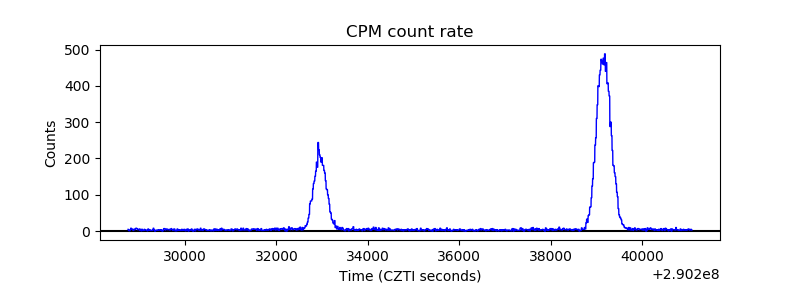 |
| CZT Counter |  |
| +2.5 Volts monitor |  |
| +5 Volts monitor |  |
| _ROLL_ROT |  |
| _Roll_DEC |  |
| _Roll_RA |  |
| Veto Counter |  |