| Param | Original file | Final file |
|---|---|---|
| Filename | modeM0/AS1A05_072T04_9000002794_18696cztM0_level2.evt | modeM0/AS1A05_072T04_9000002794_18696cztM0_level2_quad_clean.evt |
| Size (bytes) | 467,683,200 | 96,094,080 |
| Size | 446.0 MB | 91.6 MB |
| Events in quadrant A | 3,178,155 | 614,954 |
| Events in quadrant B | 3,241,306 | 628,311 |
| Events in quadrant C | 3,334,730 | 606,267 |
| Events in quadrant D | 3,952,363 | 591,391 |
| Mode SS | |||
|---|---|---|---|
| Quadrant | BADHDUFLAG | Total packets | Discarded packets |
| A | 0 | 138 | 0 |
| B | 0 | 138 | 0 |
| C | 0 | 138 | 0 |
| D | 0 | 138 | 0 |
| Mode M9 | |||
|---|---|---|---|
| Quadrant | BADHDUFLAG | Total packets | Discarded packets |
| A | 0 | 9 | 0 |
| B | 0 | 9 | 0 |
| C | 0 | 9 | 0 |
| D | 0 | 9 | 0 |
| Mode M0 | |||
|---|---|---|---|
| Quadrant | BADHDUFLAG | Total packets | Discarded packets |
| A | 0 | 13711 | 2 |
| B | 0 | 13814 | 2 |
| C | 0 | 14094 | 2 |
| D | 0 | 16271 | 2 |
| Quadrant | Total seconds | Saturated seconds | Saturation percentage |
|---|---|---|---|
| A | 6726 | 35 | 0.520369% |
| B | 6727 | 41 | 0.609484% |
| C | 6727 | 64 | 0.951390% |
| D | 6727 | 82 | 1.218968% |
Noise dominated data is calculated using 1-second bins in cleaned event files. If a bin has >2000 counts, and if more than 50% of those come from <1% of pixels, then it is considered to be noise-dominated and hence unusable.
| Quadrant | # 1 sec bins | Bins with >0 counts | Bins with >2000 counts | High rate bins dominated by noise | Noise dominated (total time) | Noise dominated (detector-on time) | Marked lightcurve |
|---|---|---|---|---|---|---|---|
| A | 7701 | 6727 | 0 | 0 | 0.00% | 0.00% | 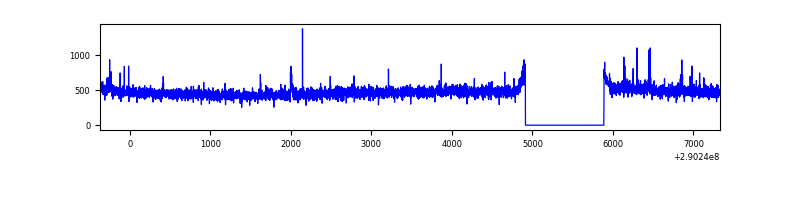 |
| B | 7702 | 6728 | 3 | 3 | 0.04% | 0.04% | 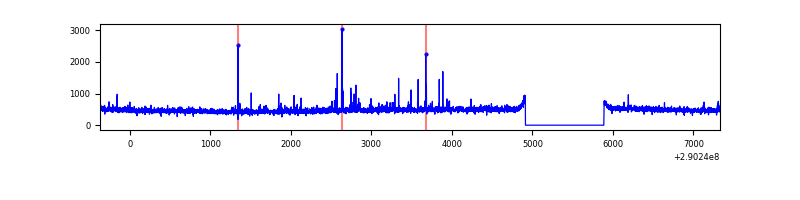 |
| C | 7702 | 6728 | 17 | 17 | 0.22% | 0.25% | 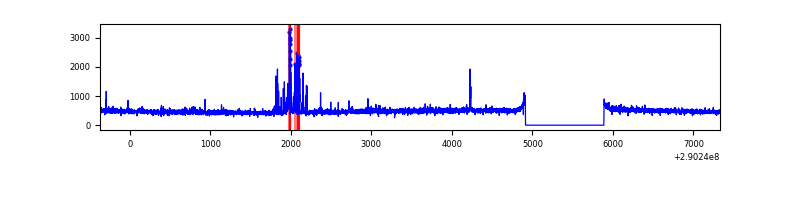 |
| D | 7702 | 6728 | 37 | 37 | 0.48% | 0.55% | 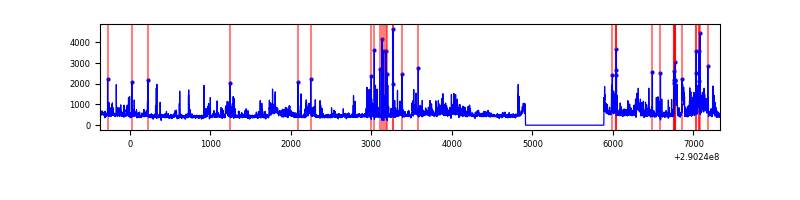 |
Top three noisy pixels from each quadrant. If the there are fewer than three noisy pixels in the level2.evt file, extra rows are filled as -1
| Pixel properties | Quadrant properties | ||||||
|---|---|---|---|---|---|---|---|
| Quadrant | DetID | PixID | Counts | Sigma | Mean | Median | Sigma |
| A | 6 | 16 | 21165 | 123.32 | 813 | 795 | 165.2 |
| A | 13 | 254 | 10496 | 58.73 | 813 | 795 | 165.2 |
| A | 11 | 29 | 9987 | 55.65 | 813 | 795 | 165.2 |
| B | 0 | 197 | 24357 | 152.5 | 808 | 789 | 154.5 |
| B | 0 | 189 | 19441 | 120.69 | 808 | 789 | 154.5 |
| B | 12 | 111 | 18817 | 116.65 | 808 | 789 | 154.5 |
| C | 0 | 207 | 131135 | 722.78 | 773 | 779 | 180.4 |
| C | 14 | 238 | 120267 | 662.52 | 773 | 779 | 180.4 |
| C | 9 | 221 | 25381 | 136.41 | 773 | 779 | 180.4 |
| D | 1 | 52 | 532704 | 2753.64 | 785 | 760 | 193.2 |
| D | 7 | 238 | 378588 | 1955.85 | 785 | 760 | 193.2 |
| D | 12 | 110 | 62609 | 320.16 | 785 | 760 | 193.2 |
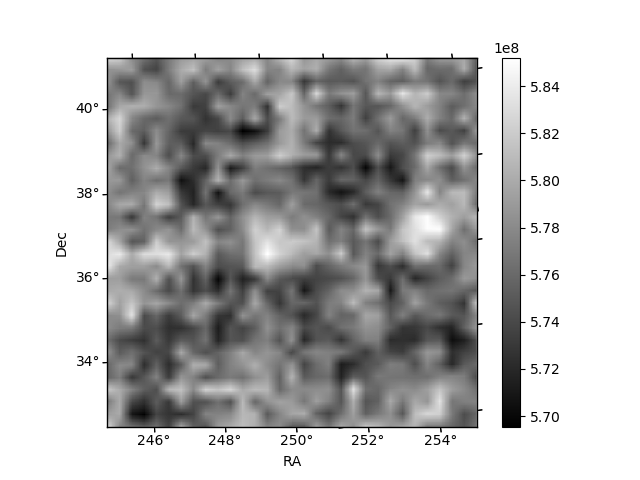
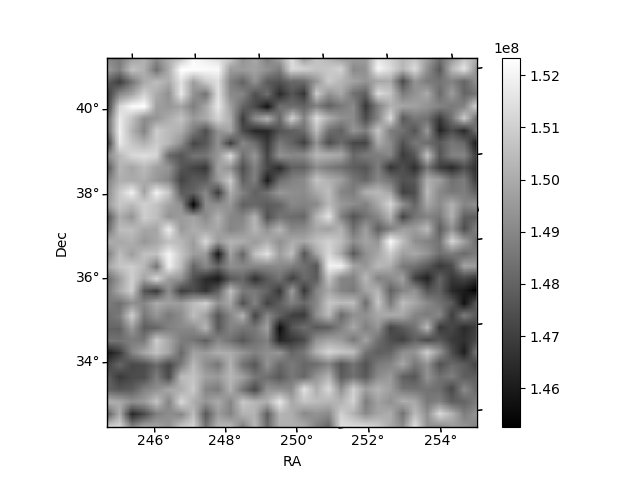
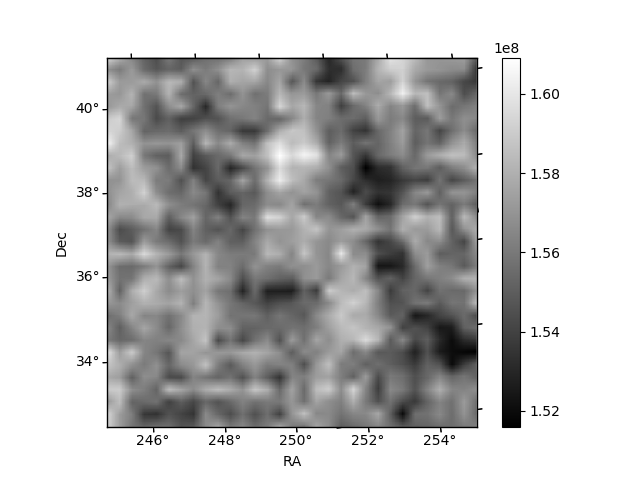
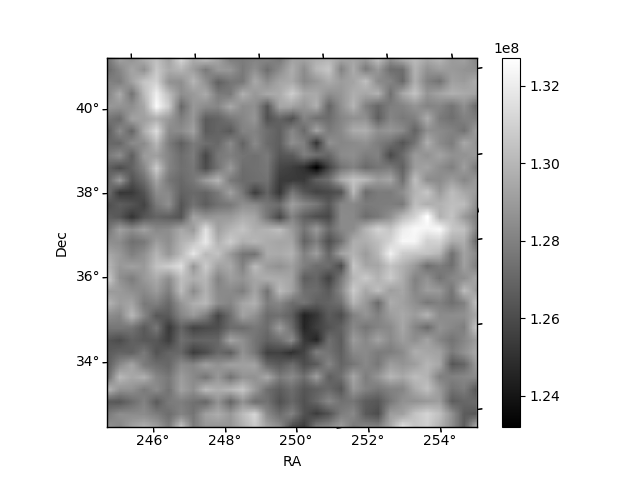
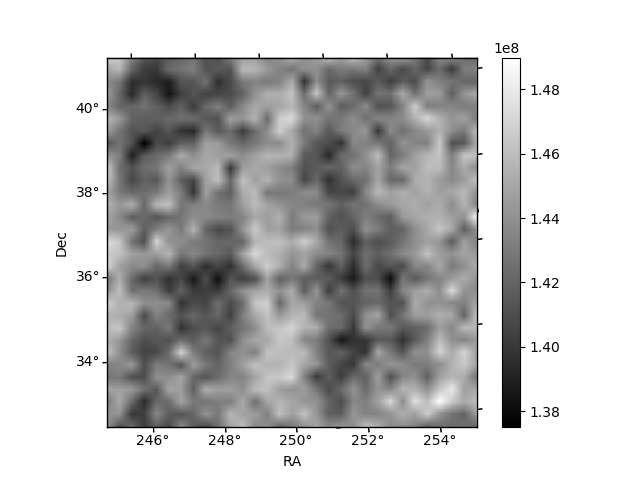
Histogram calculated using DETX and DETY for each event in the final _common_clean file
| Quadrant A | 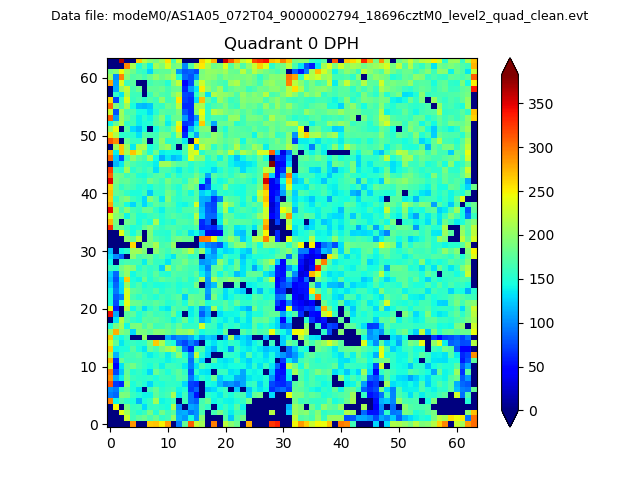 |
 |
Quadrant B |
|---|---|---|---|
| Quadrant D | 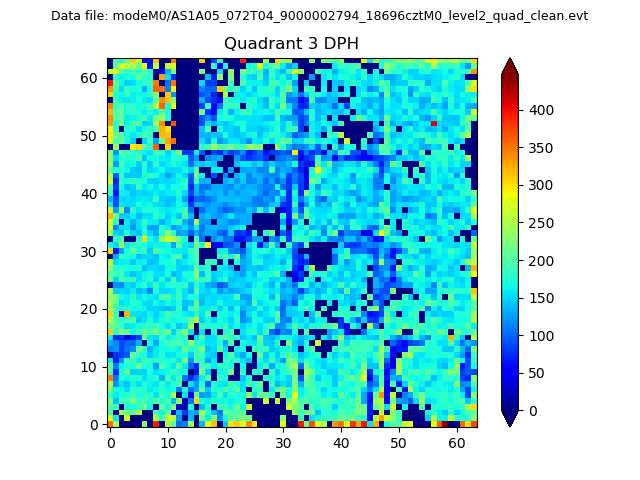 |
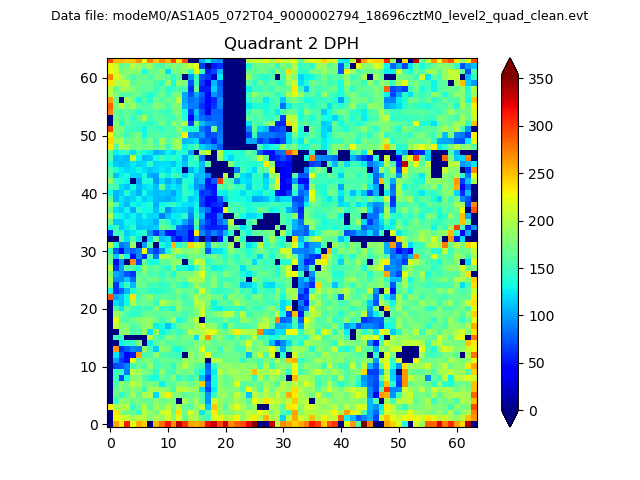 |
Quadrant C |
| Plot type | Count rate plots | Images |
|---|---|---|
| Comparison with Poisson distribution Blue bars denote a histogram of data divided into 1 sec bins. Red curve is a Poisson curve with rate = median count rate of data. |
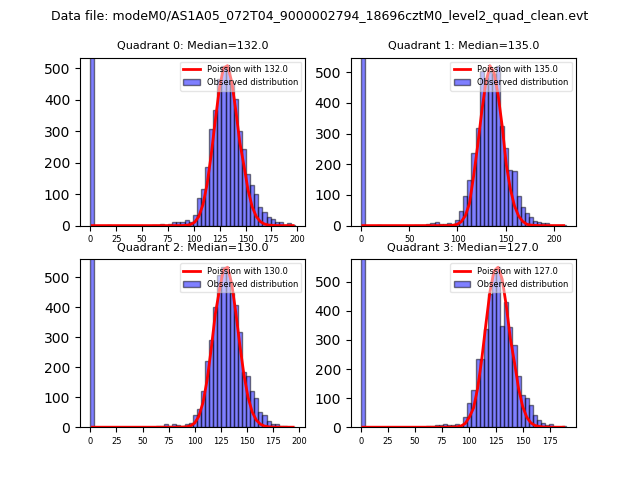 |
 |
| Quadrant-wise count rates Data is divided into 100 sec bins |
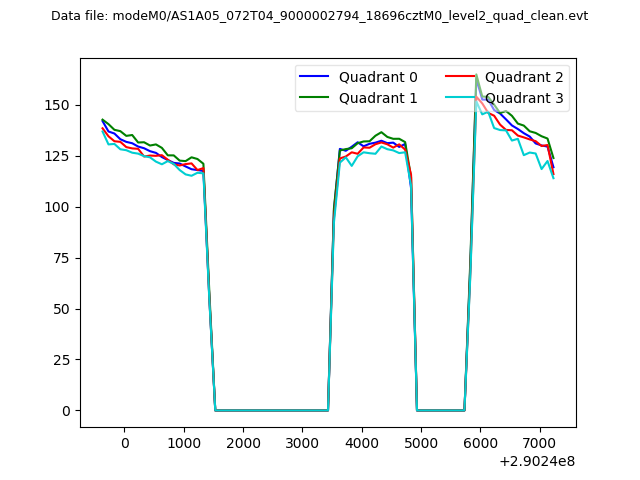 |
|
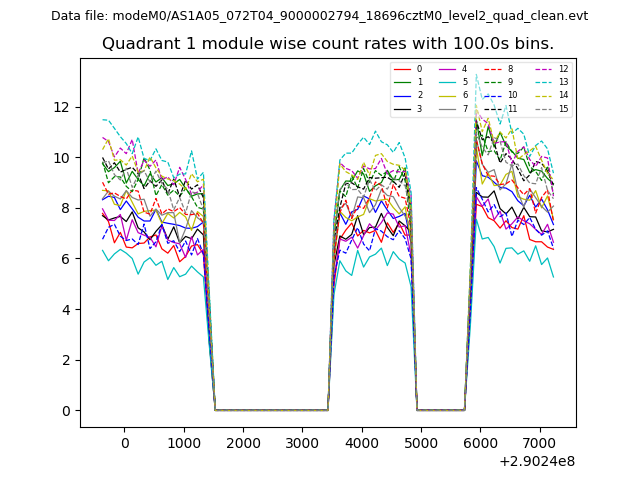
| Module-wise count rates for Quadrant A Data is divided into 100 sec bins |
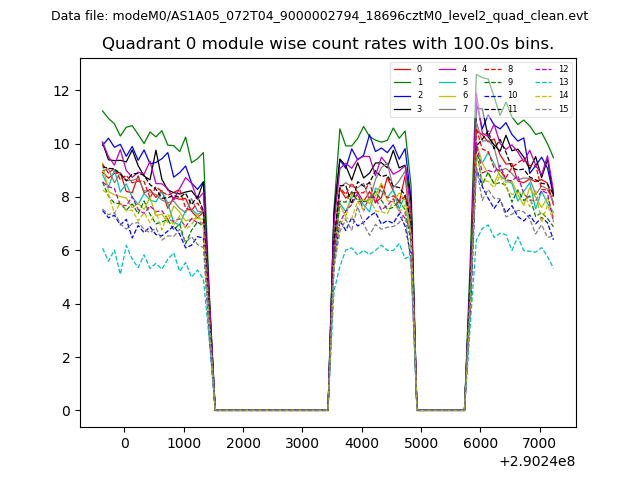 |
 |
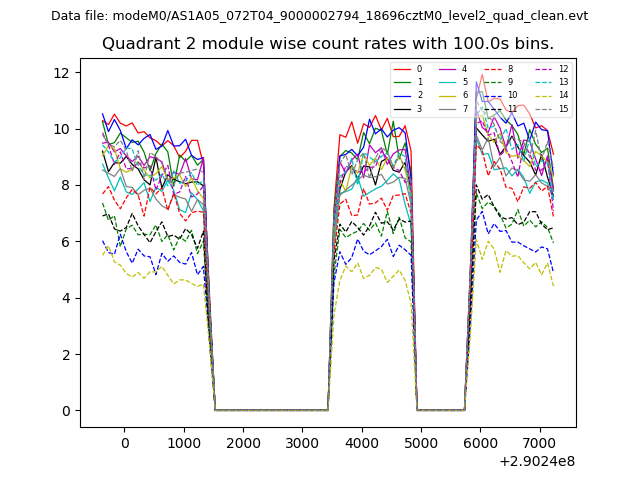
| Module-wise count rates for Quadrant B Data is divided into 100 sec bins |
 |
 |
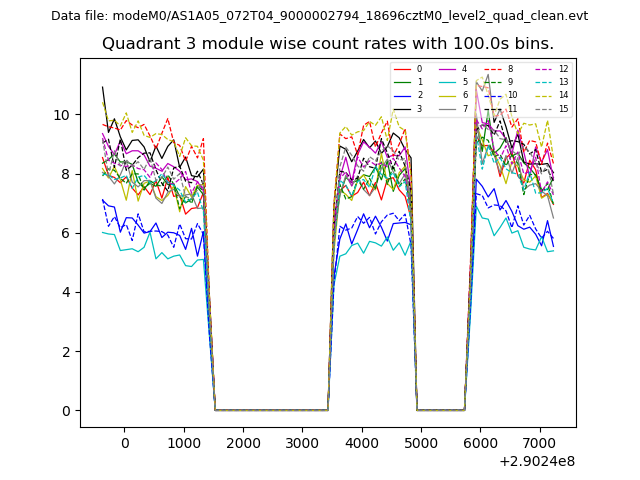
| Module-wise count rates for Quadrant C Data is divided into 100 sec bins |
 |
 |
| Module-wise count rates for Quadrant D Data is divided into 100 sec bins |
 |
 |
| Parameter | Plot |
|---|---|
| CZT HV Monitor | 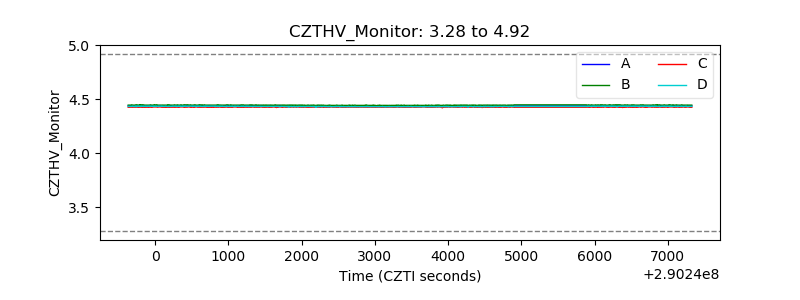 |
| D_VDD |  |
| Temperature 1 | 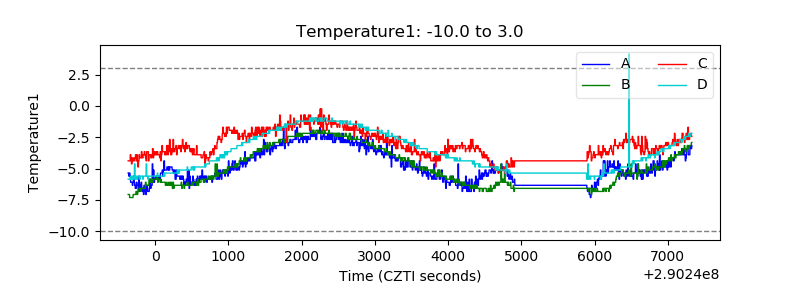 |
| Veto HV Monitor |  |
| Veto LLD | 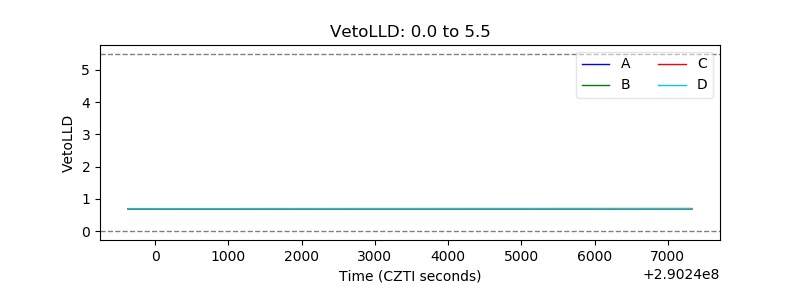 |
| Alpha Counter | 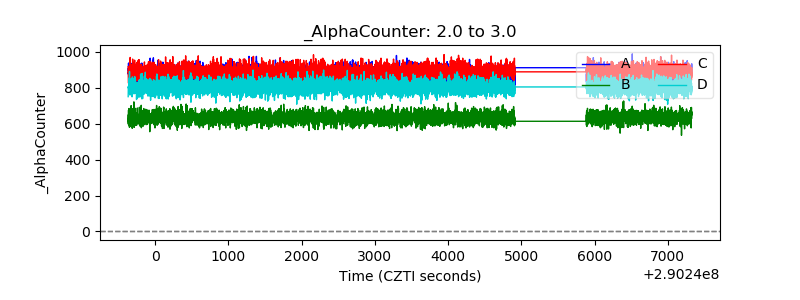 |
| _CPM_Rate | 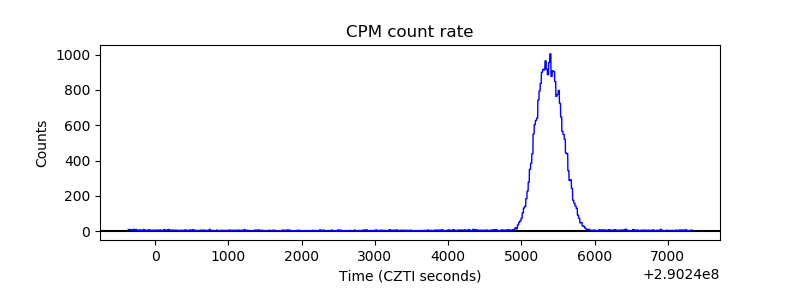 |
| CZT Counter | 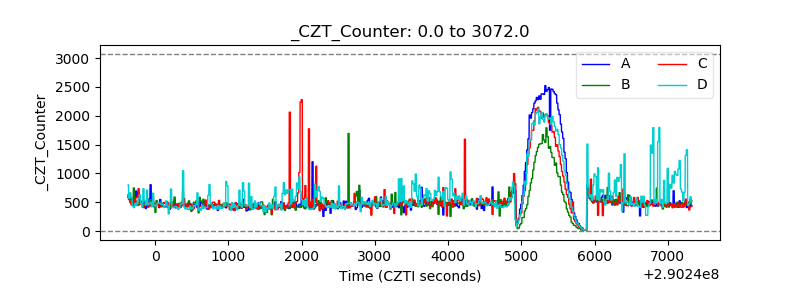 |
| +2.5 Volts monitor |  |
| +5 Volts monitor |  |
| _ROLL_ROT | 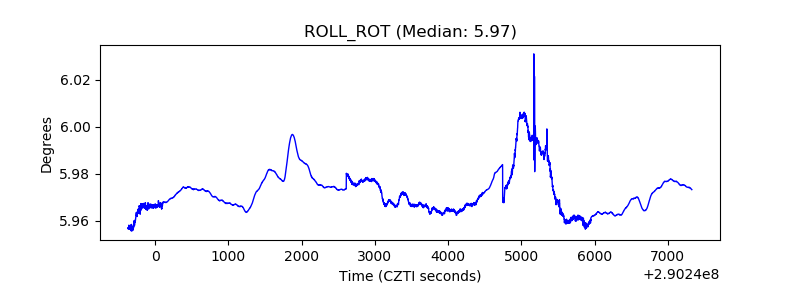 |
| _Roll_DEC | 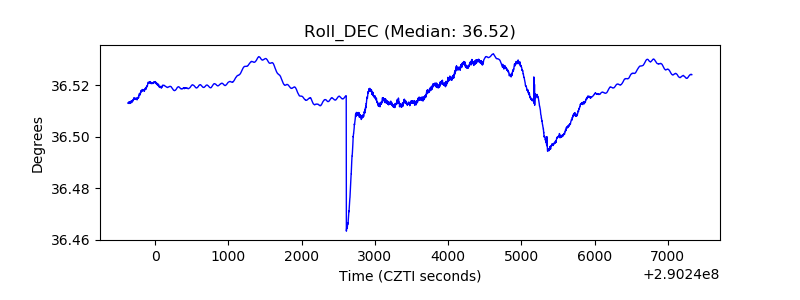 |
| _Roll_RA | 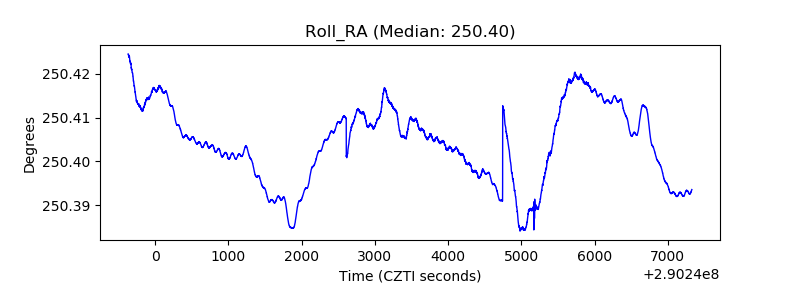 |
| Veto Counter | 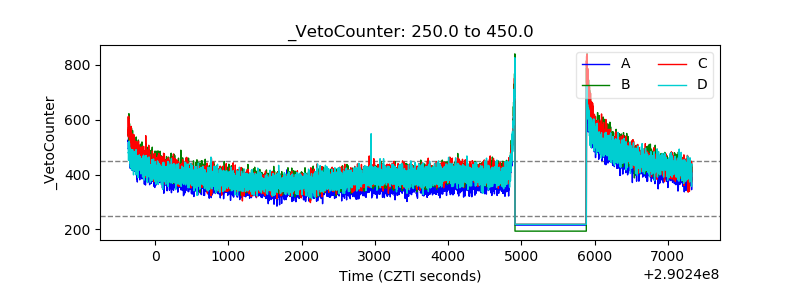 |