| Param | Original file | Final file |
|---|---|---|
| Filename | modeM0/AS1A05_072T04_9000002794_18698cztM0_level2.evt | modeM0/AS1A05_072T04_9000002794_18698cztM0_level2_quad_clean.evt |
| Size (bytes) | 509,376,960 | 82,169,280 |
| Size | 485.8 MB | 78.4 MB |
| Events in quadrant A | 3,030,506 | 528,915 |
| Events in quadrant B | 3,328,795 | 533,864 |
| Events in quadrant C | 3,095,465 | 516,309 |
| Events in quadrant D | 5,559,858 | 484,771 |
| Mode SS | |||
|---|---|---|---|
| Quadrant | BADHDUFLAG | Total packets | Discarded packets |
| A | 0 | 124 | 0 |
| B | 0 | 124 | 0 |
| C | 0 | 124 | 0 |
| D | 0 | 124 | 0 |
| Mode M9 | |||
|---|---|---|---|
| Quadrant | BADHDUFLAG | Total packets | Discarded packets |
| A | 0 | 11 | 0 |
| B | 0 | 11 | 0 |
| C | 0 | 11 | 0 |
| D | 0 | 11 | 0 |
| Mode M0 | |||
|---|---|---|---|
| Quadrant | BADHDUFLAG | Total packets | Discarded packets |
| A | 0 | 12690 | 1 |
| B | 0 | 13599 | 1 |
| C | 0 | 12874 | 1 |
| D | 0 | 20598 | 4 |
| Quadrant | Total seconds | Saturated seconds | Saturation percentage |
|---|---|---|---|
| A | 6071 | 60 | 0.988305% |
| B | 6072 | 154 | 2.536232% |
| C | 6072 | 81 | 1.333992% |
| D | 6071 | 584 | 9.619503% |
Noise dominated data is calculated using 1-second bins in cleaned event files. If a bin has >2000 counts, and if more than 50% of those come from <1% of pixels, then it is considered to be noise-dominated and hence unusable.
| Quadrant | # 1 sec bins | Bins with >0 counts | Bins with >2000 counts | High rate bins dominated by noise | Noise dominated (total time) | Noise dominated (detector-on time) | Marked lightcurve |
|---|---|---|---|---|---|---|---|
| A | 7161 | 6072 | 2 | 2 | 0.03% | 0.03% | 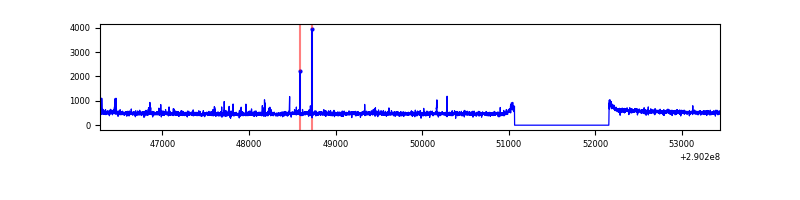 |
| B | 7162 | 6073 | 55 | 55 | 0.77% | 0.91% | 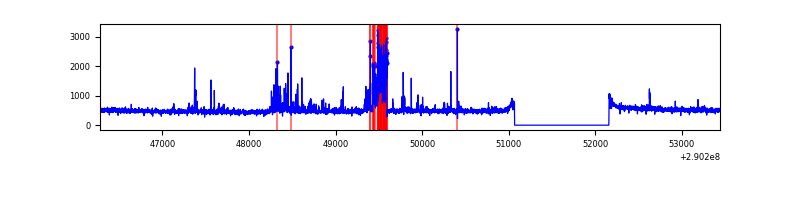 |
| C | 7162 | 6073 | 6 | 6 | 0.08% | 0.10% | 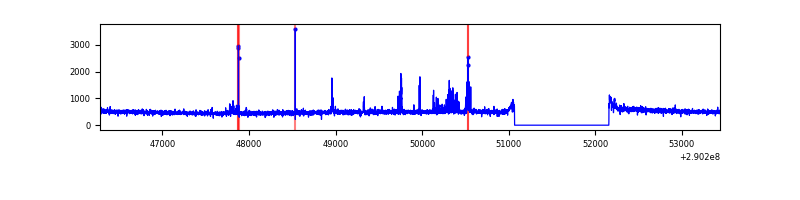 |
| D | 7161 | 6072 | 419 | 419 | 5.85% | 6.90% | 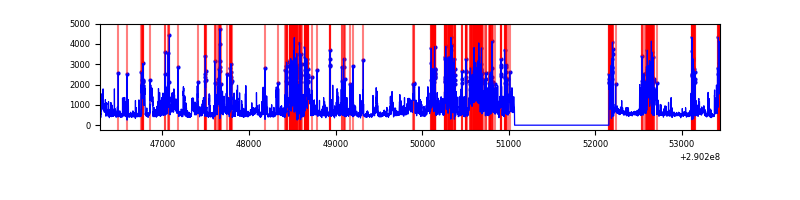 |
Top three noisy pixels from each quadrant. If the there are fewer than three noisy pixels in the level2.evt file, extra rows are filled as -1
| Pixel properties | Quadrant properties | ||||||
|---|---|---|---|---|---|---|---|
| Quadrant | DetID | PixID | Counts | Sigma | Mean | Median | Sigma |
| A | 6 | 16 | 47889 | 305.46 | 764 | 749 | 154.3 |
| A | 0 | 13 | 20592 | 128.58 | 764 | 749 | 154.3 |
| A | 11 | 29 | 11831 | 71.81 | 764 | 749 | 154.3 |
| B | 10 | 245 | 234205 | 1641.37 | 754 | 735 | 142.2 |
| B | 7 | 220 | 77052 | 536.53 | 754 | 735 | 142.2 |
| B | 0 | 189 | 18648 | 125.93 | 754 | 735 | 142.2 |
| C | 14 | 238 | 114941 | 682.82 | 725 | 730 | 167.3 |
| C | 3 | 233 | 88481 | 524.62 | 725 | 730 | 167.3 |
| C | 0 | 207 | 22504 | 130.18 | 725 | 730 | 167.3 |
| D | 1 | 52 | 1542651 | 8873.04 | 715 | 694 | 173.8 |
| D | 7 | 238 | 814744 | 4684.37 | 715 | 694 | 173.8 |
| D | 12 | 110 | 473217 | 2719.09 | 715 | 694 | 173.8 |
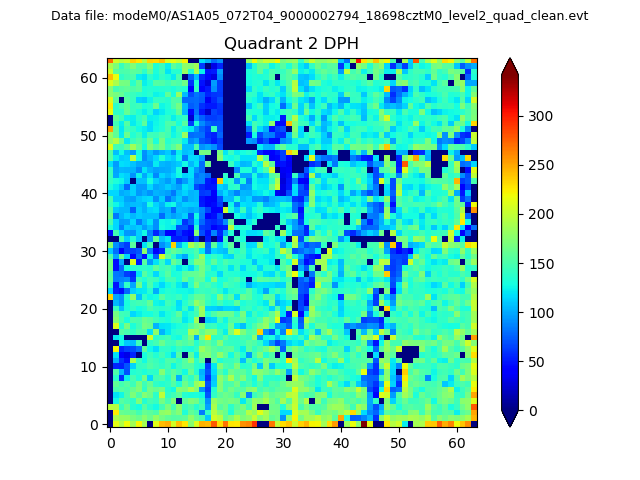
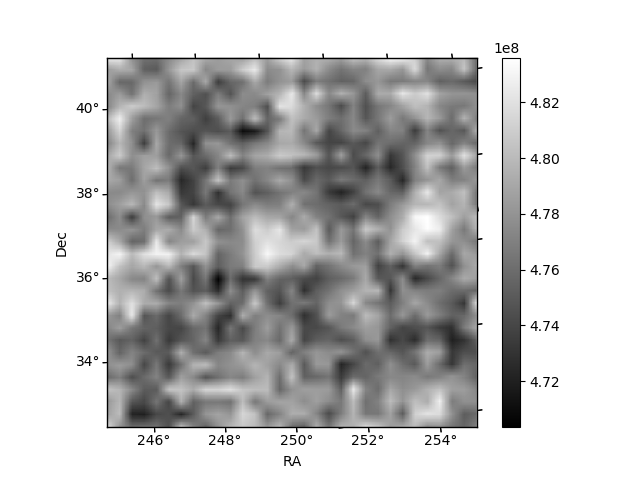
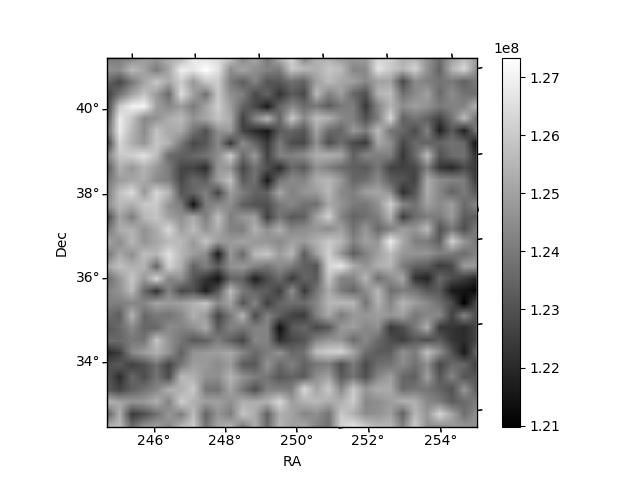
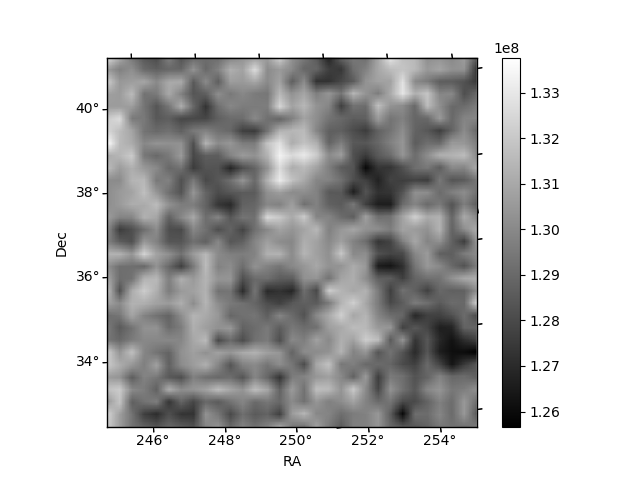
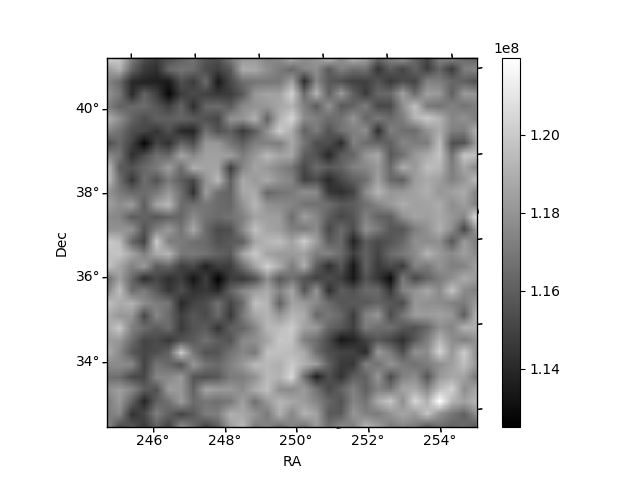
Histogram calculated using DETX and DETY for each event in the final _common_clean file
| Quadrant A | 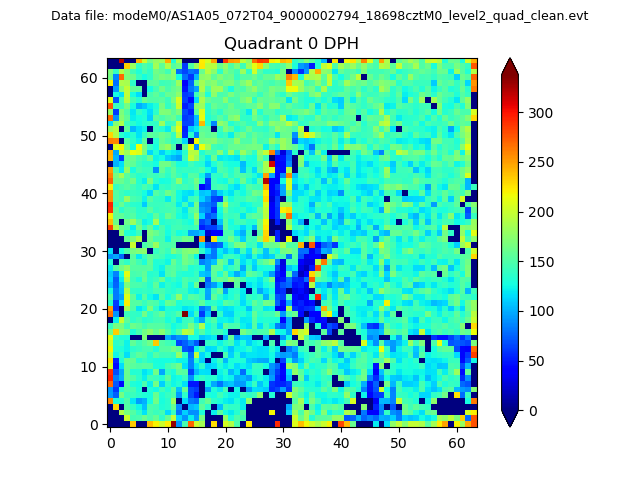 |
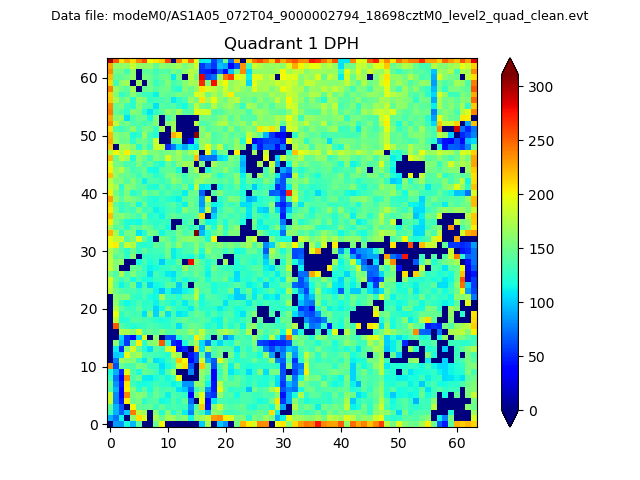 |
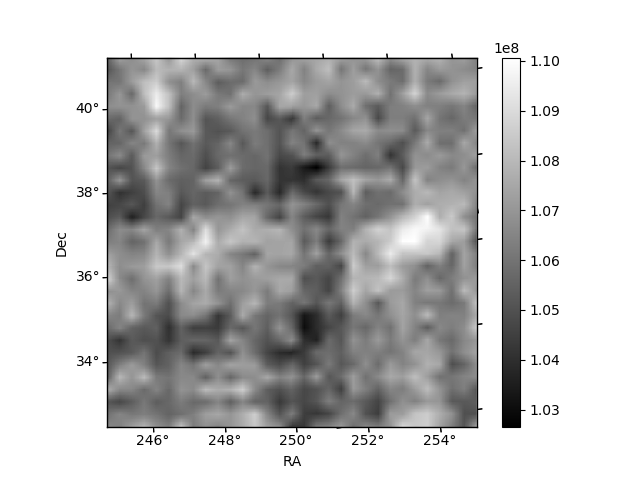
Quadrant B |
|---|---|---|---|
| Quadrant D | 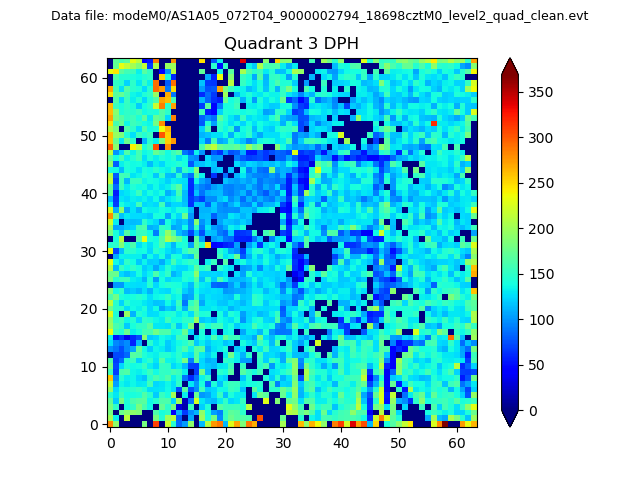 |
 |
Quadrant C |
| Plot type | Count rate plots | Images |
|---|---|---|
| Comparison with Poisson distribution Blue bars denote a histogram of data divided into 1 sec bins. Red curve is a Poisson curve with rate = median count rate of data. |
 |
 |
| Quadrant-wise count rates Data is divided into 100 sec bins |
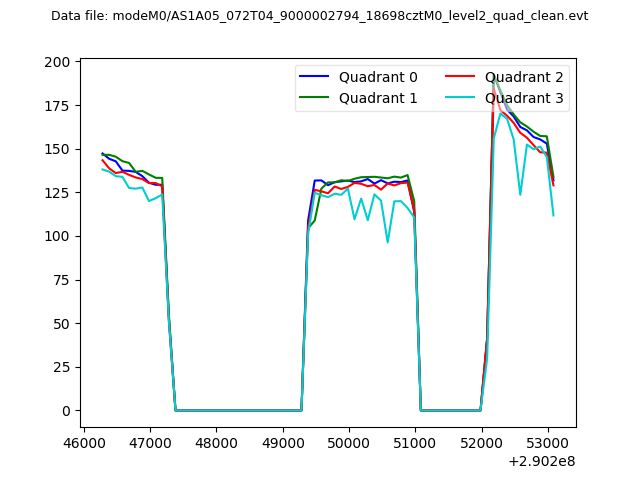 |
|
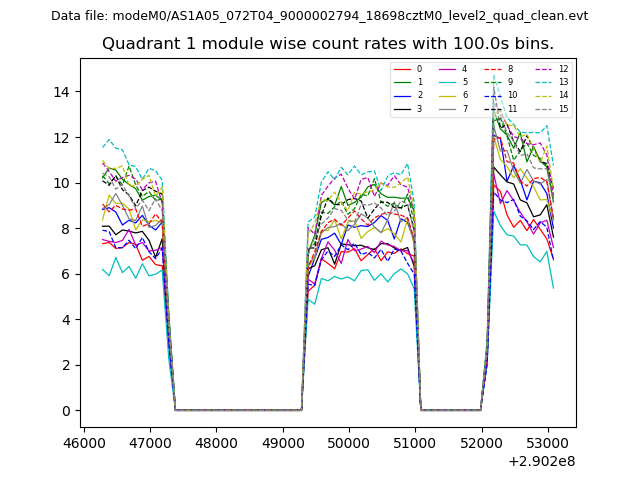
| Module-wise count rates for Quadrant A Data is divided into 100 sec bins |
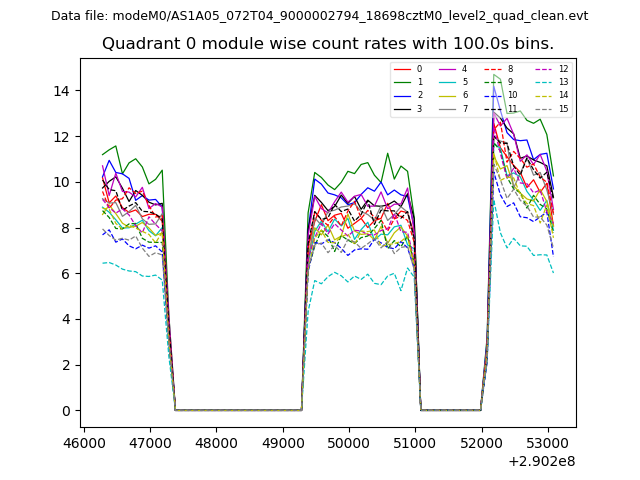 |
 |
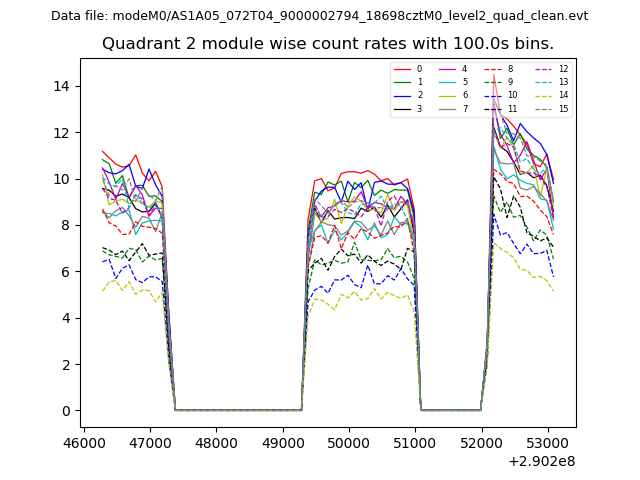
| Module-wise count rates for Quadrant B Data is divided into 100 sec bins |
 |
 |
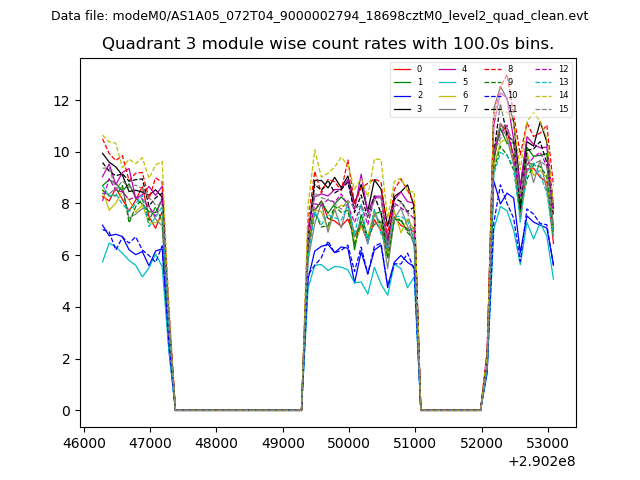
| Module-wise count rates for Quadrant C Data is divided into 100 sec bins |
 |
 |
| Module-wise count rates for Quadrant D Data is divided into 100 sec bins |
 |
 |
| Parameter | Plot |
|---|---|
| CZT HV Monitor | 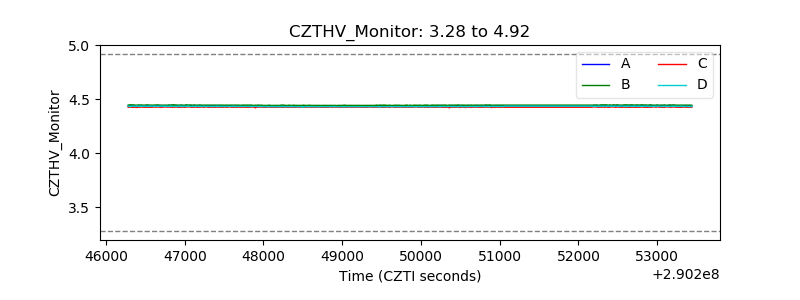 |
| D_VDD | 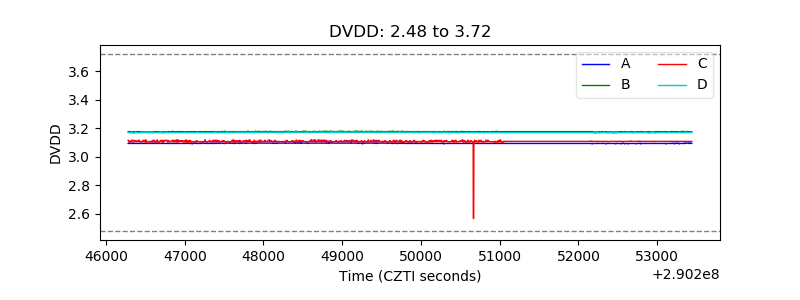 |
| Temperature 1 |  |
| Veto HV Monitor | 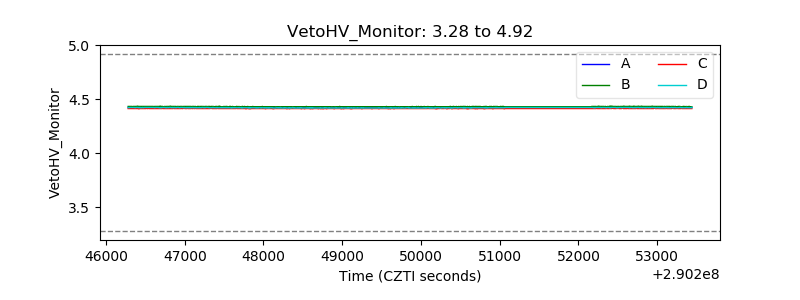 |
| Veto LLD | 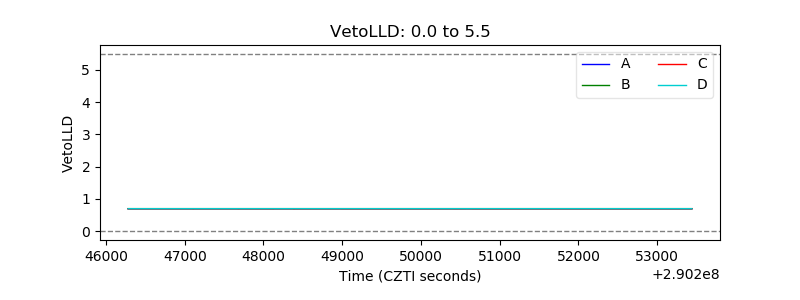 |
| Alpha Counter | 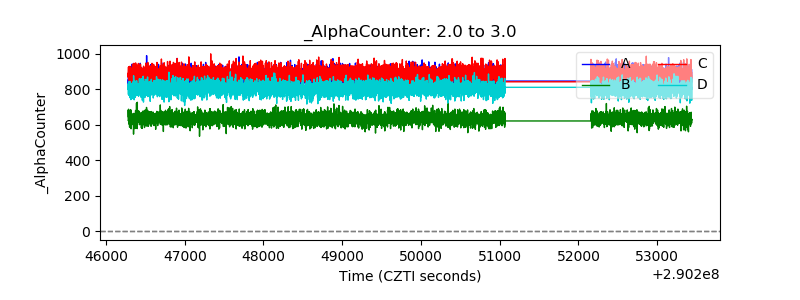 |
| _CPM_Rate | 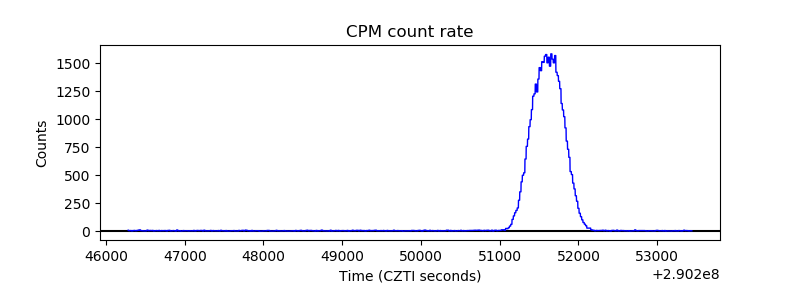 |
| CZT Counter |  |
| +2.5 Volts monitor |  |
| +5 Volts monitor |  |
| _ROLL_ROT | 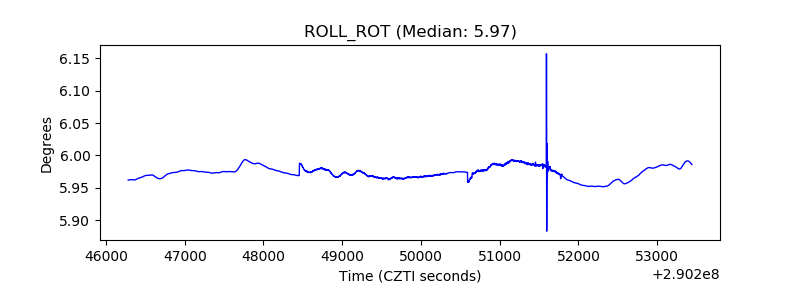 |
| _Roll_DEC | 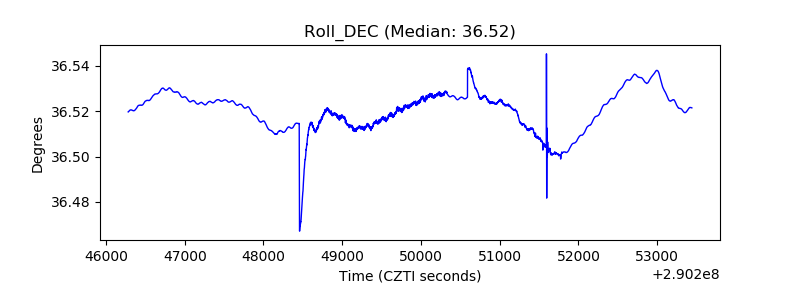 |
| _Roll_RA | 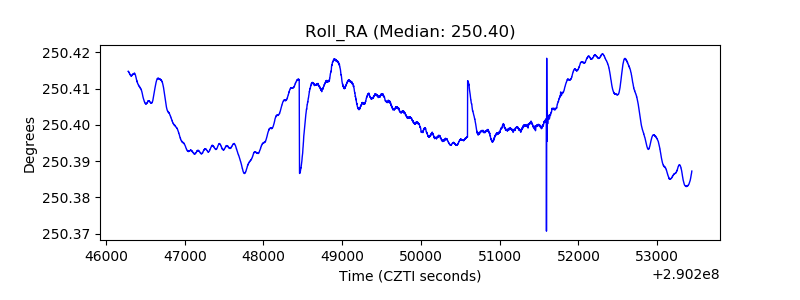 |
| Veto Counter | 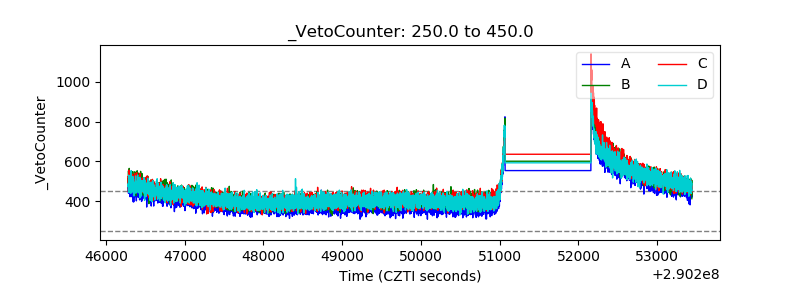 |