| Param | Original file | Final file |
|---|---|---|
| Filename | modeM0/AS1A05_072T04_9000002794_18701cztM0_level2.evt | modeM0/AS1A05_072T04_9000002794_18701cztM0_level2_quad_clean.evt |
| Size (bytes) | 252,362,880 | 15,822,720 |
| Size | 240.7 MB | 15.1 MB |
| Events in quadrant A | 1,858,378 | 76,025 |
| Events in quadrant B | 1,448,587 | 76,414 |
| Events in quadrant C | 1,400,499 | 73,412 |
| Events in quadrant D | 2,760,006 | 68,515 |
| Mode SS | |||
|---|---|---|---|
| Quadrant | BADHDUFLAG | Total packets | Discarded packets |
| A | 0 | 50 | 0 |
| B | 0 | 50 | 0 |
| C | 0 | 50 | 0 |
| D | 0 | 50 | 0 |
| Mode M0 | |||
|---|---|---|---|
| Quadrant | BADHDUFLAG | Total packets | Discarded packets |
| A | 0 | 7161 | 0 |
| B | 0 | 5860 | 0 |
| C | 0 | 5652 | 0 |
| D | 0 | 10035 | 0 |
| Quadrant | Total seconds | Saturated seconds | Saturation percentage |
|---|---|---|---|
| A | 2566 | 132 | 5.144193% |
| B | 2567 | 14 | 0.545384% |
| C | 2567 | 12 | 0.467472% |
| D | 2567 | 327 | 12.738605% |
Noise dominated data is calculated using 1-second bins in cleaned event files. If a bin has >2000 counts, and if more than 50% of those come from <1% of pixels, then it is considered to be noise-dominated and hence unusable.
| Quadrant | # 1 sec bins | Bins with >0 counts | Bins with >2000 counts | High rate bins dominated by noise | Noise dominated (total time) | Noise dominated (detector-on time) | Marked lightcurve |
|---|---|---|---|---|---|---|---|
| A | 2566 | 2566 | 72 | 72 | 2.81% | 2.81% | 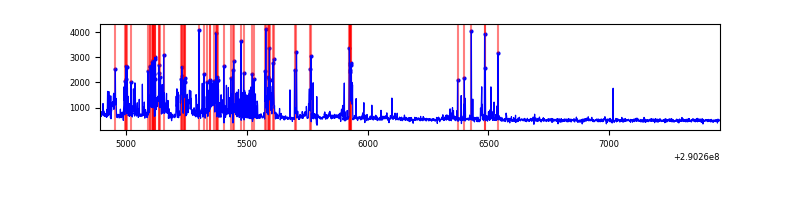 |
| B | 2567 | 2567 | 3 | 3 | 0.12% | 0.12% | 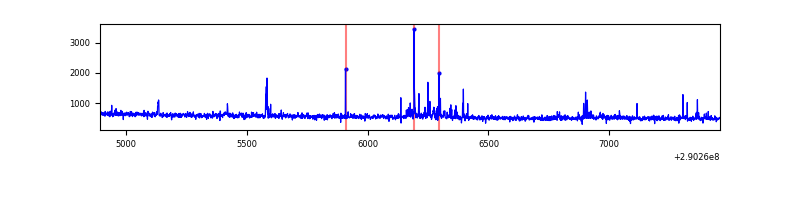 |
| C | 2567 | 2567 | 0 | 0 | 0.00% | 0.00% | 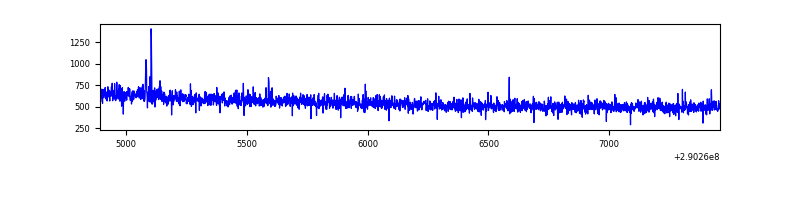 |
| D | 2567 | 2567 | 302 | 302 | 11.76% | 11.76% | 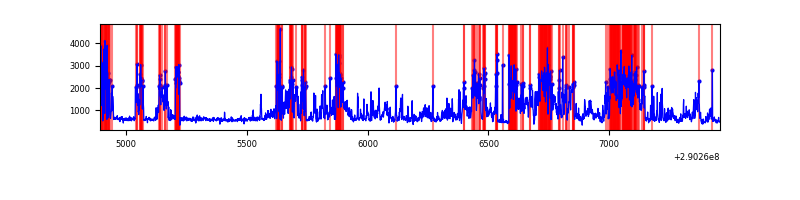 |
Top three noisy pixels from each quadrant. If the there are fewer than three noisy pixels in the level2.evt file, extra rows are filled as -1
| Pixel properties | Quadrant properties | ||||||
|---|---|---|---|---|---|---|---|
| Quadrant | DetID | PixID | Counts | Sigma | Mean | Median | Sigma |
| A | 0 | 13 | 401859 | 5615.83 | 352 | 345 | 71.5 |
| A | 9 | 143 | 93695 | 1305.65 | 352 | 345 | 71.5 |
| A | 13 | 254 | 3965 | 50.63 | 352 | 345 | 71.5 |
| B | 7 | 220 | 36955 | 550.54 | 352 | 346 | 66.5 |
| B | 0 | 197 | 13805 | 202.4 | 352 | 346 | 66.5 |
| B | 4 | 216 | 12834 | 187.8 | 352 | 346 | 66.5 |
| C | 14 | 238 | 56571 | 708.95 | 341 | 345 | 79.3 |
| C | 3 | 233 | 6598 | 78.84 | 341 | 345 | 79.3 |
| C | 0 | 207 | 3942 | 45.35 | 341 | 345 | 79.3 |
| D | 1 | 52 | 1283239 | 15408.66 | 339 | 330 | 83.3 |
| D | 7 | 238 | 186151 | 2231.84 | 339 | 330 | 83.3 |
| D | 2 | 234 | 11103 | 129.39 | 339 | 330 | 83.3 |
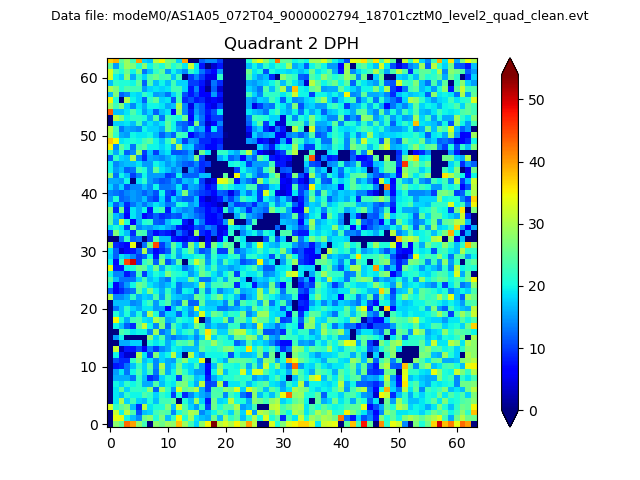
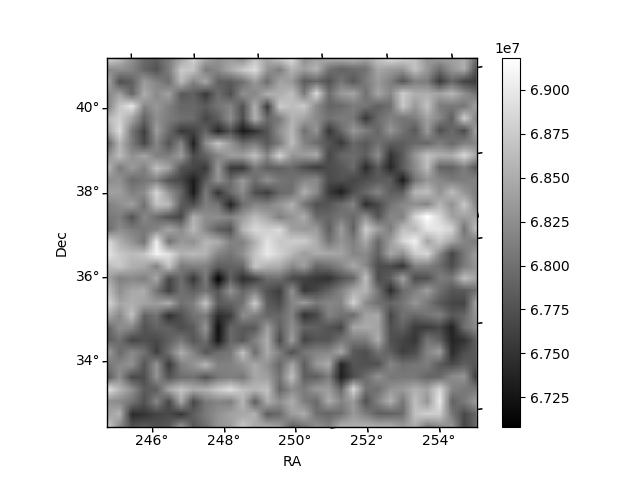
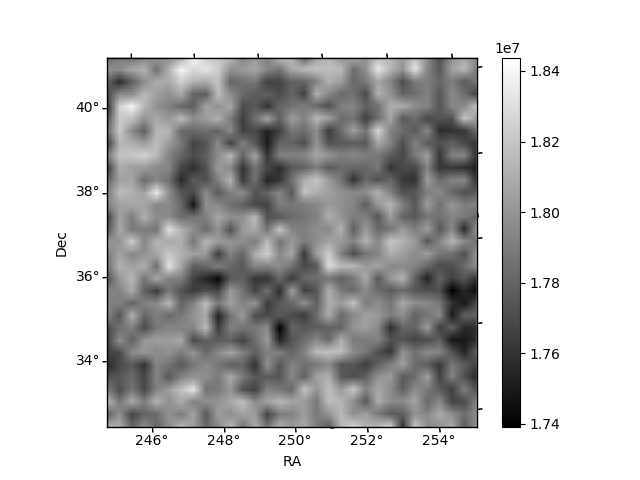
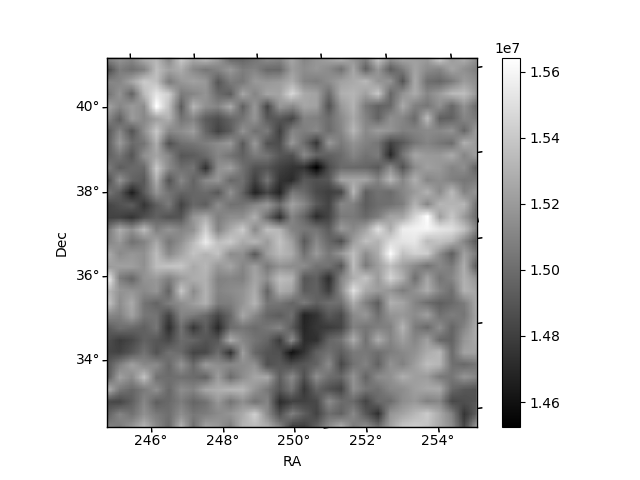
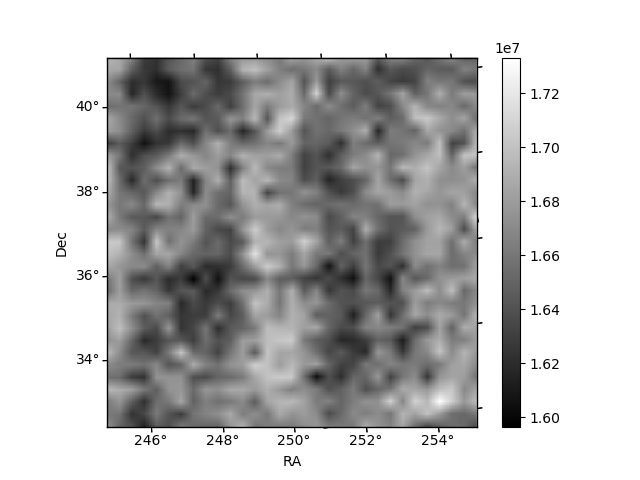
Histogram calculated using DETX and DETY for each event in the final _common_clean file
| Quadrant A | 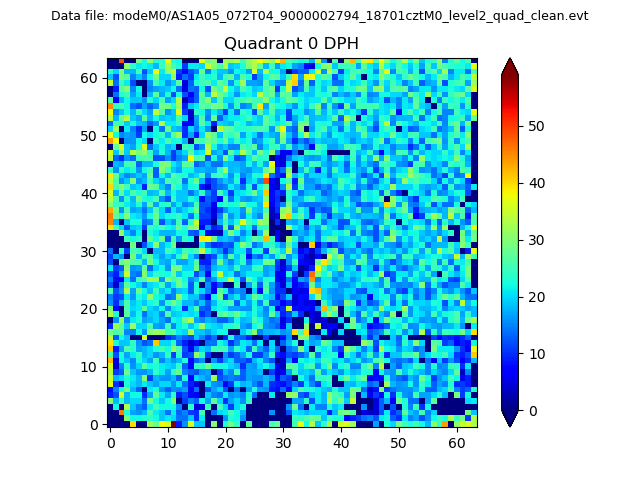 |
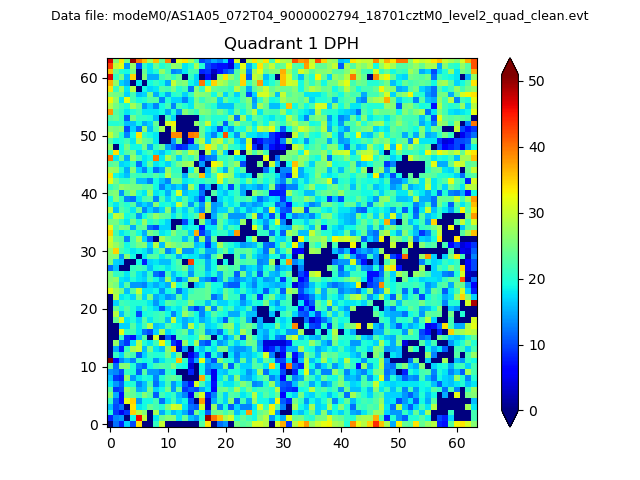 |
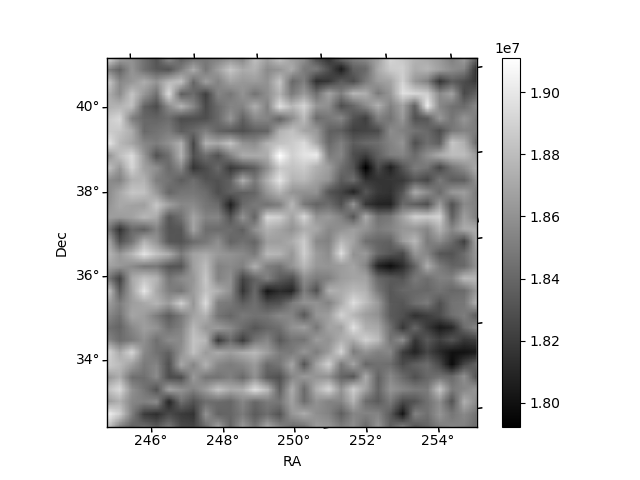
Quadrant B |
|---|---|---|---|
| Quadrant D | 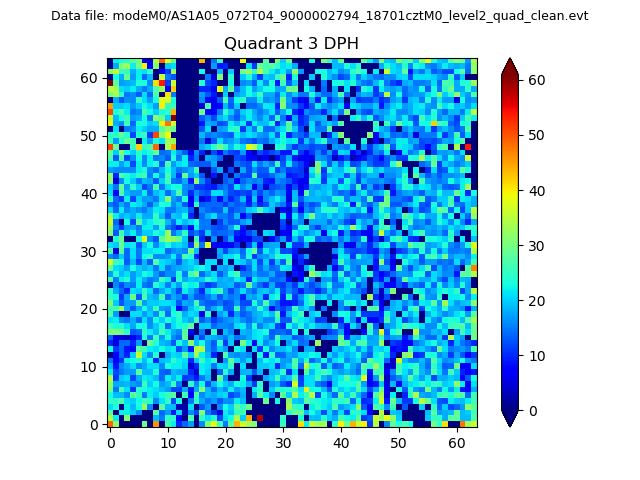 |
 |
Quadrant C |
| Plot type | Count rate plots | Images |
|---|---|---|
| Comparison with Poisson distribution Blue bars denote a histogram of data divided into 1 sec bins. Red curve is a Poisson curve with rate = median count rate of data. |
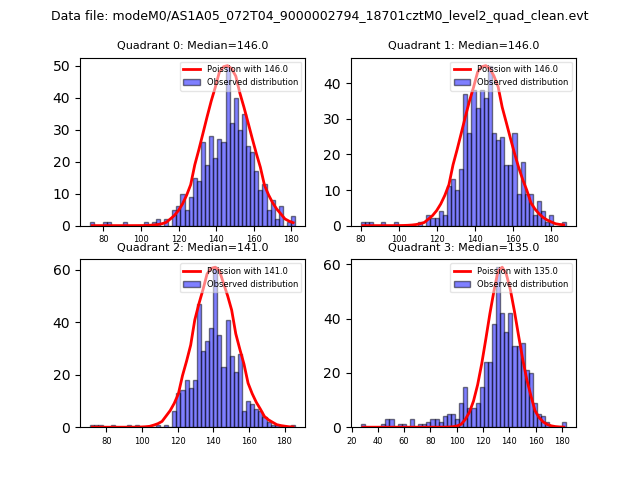 |
 |
| Quadrant-wise count rates Data is divided into 100 sec bins |
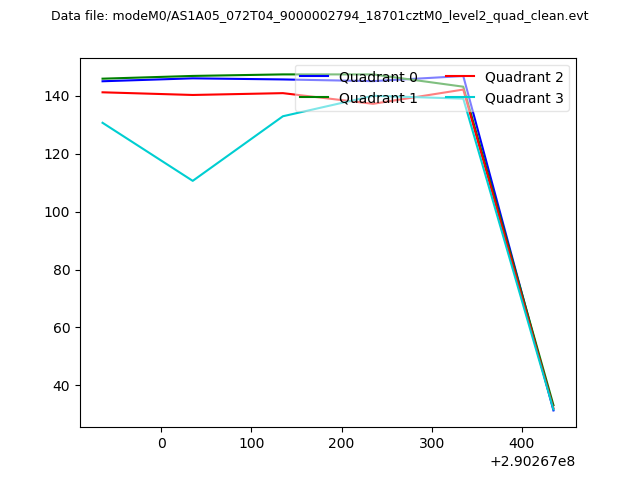 |
|
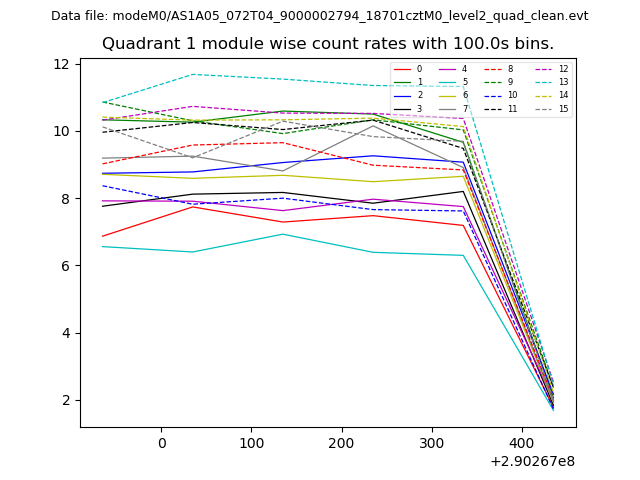
| Module-wise count rates for Quadrant A Data is divided into 100 sec bins |
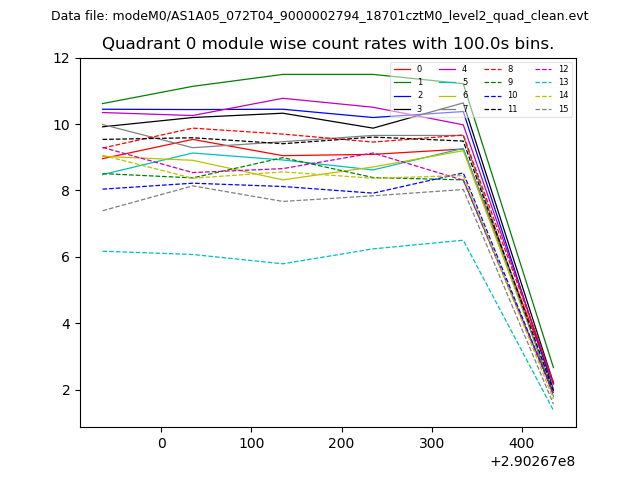 |
 |
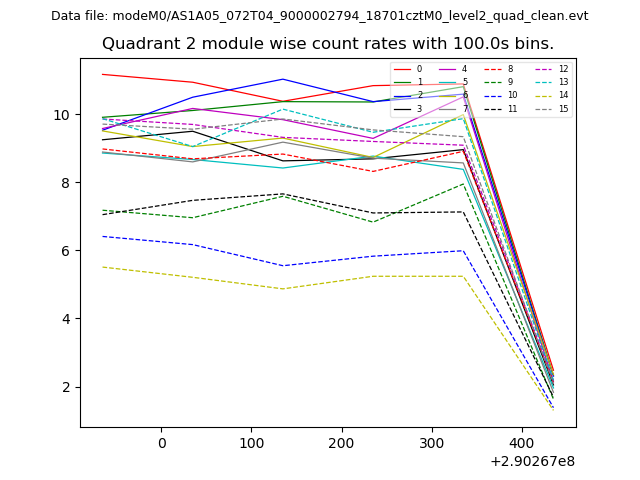
| Module-wise count rates for Quadrant B Data is divided into 100 sec bins |
 |
 |
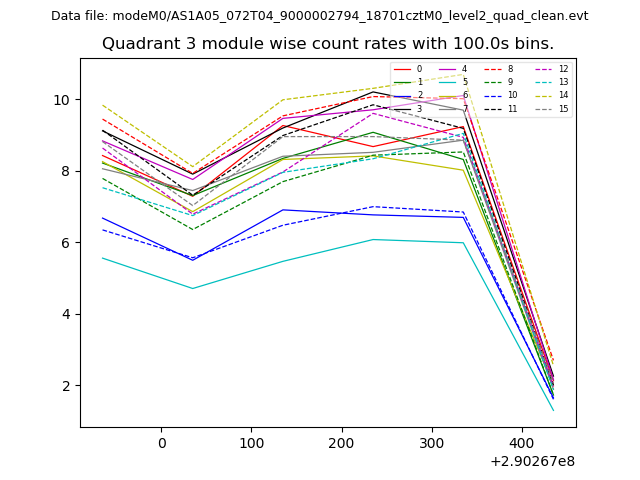
| Module-wise count rates for Quadrant C Data is divided into 100 sec bins |
 |
 |
| Module-wise count rates for Quadrant D Data is divided into 100 sec bins |
 |
 |
| Parameter | Plot |
|---|---|
| CZT HV Monitor | 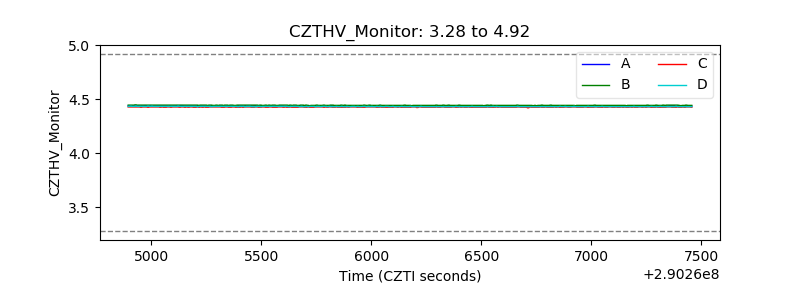 |
| D_VDD | 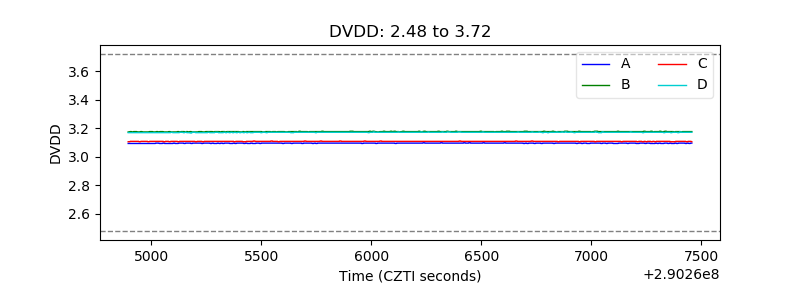 |
| Temperature 1 | 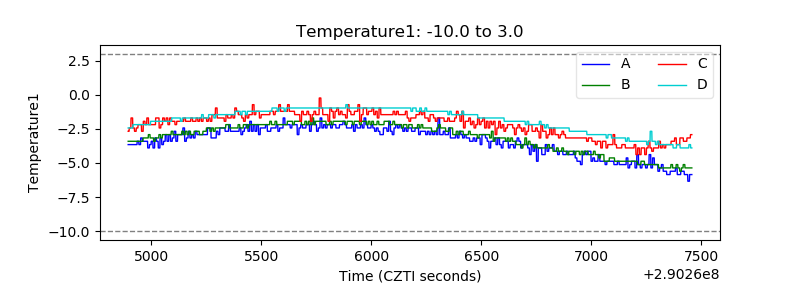 |
| Veto HV Monitor | 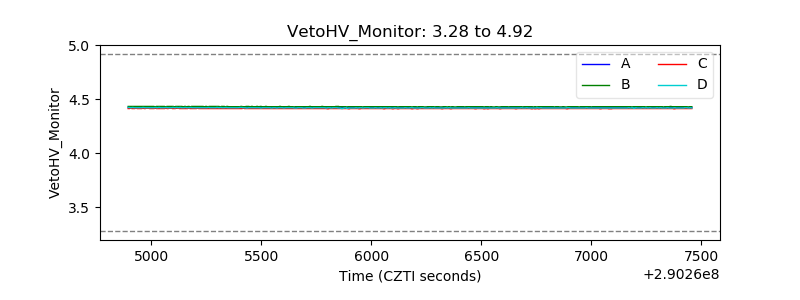 |
| Veto LLD | 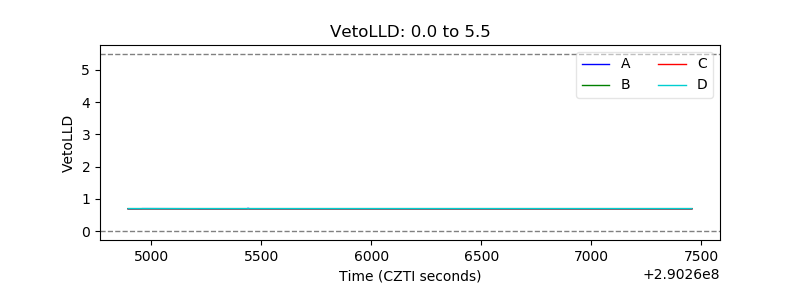 |
| Alpha Counter | 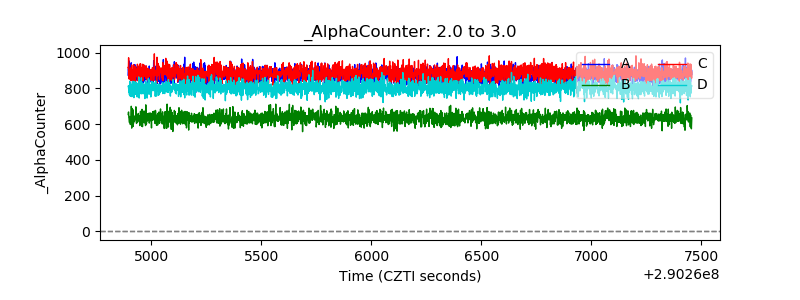 |
| _CPM_Rate | 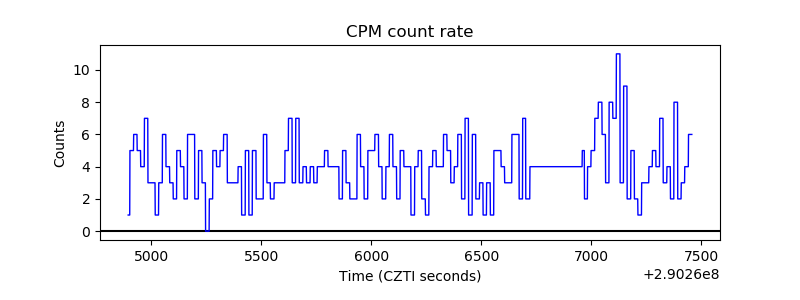 |
| CZT Counter | 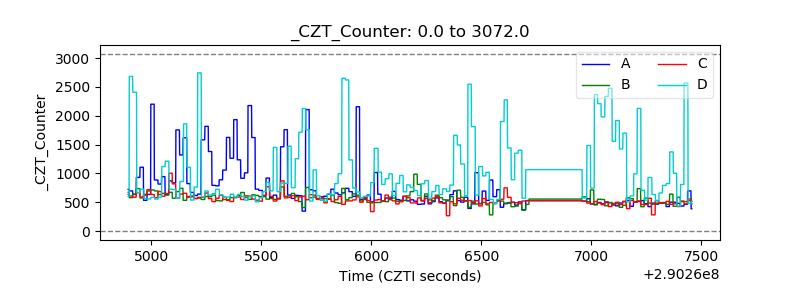 |
| +2.5 Volts monitor |  |
| +5 Volts monitor |  |
| _ROLL_ROT | 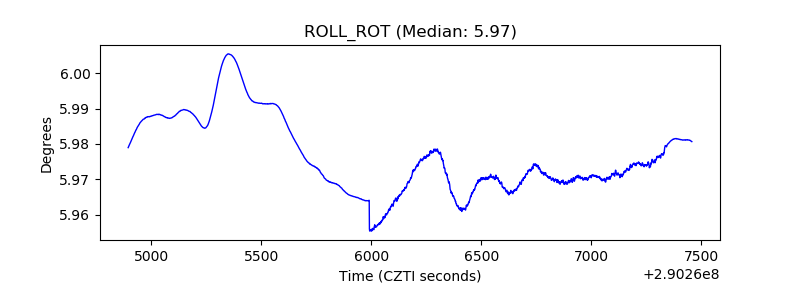 |
| _Roll_DEC | 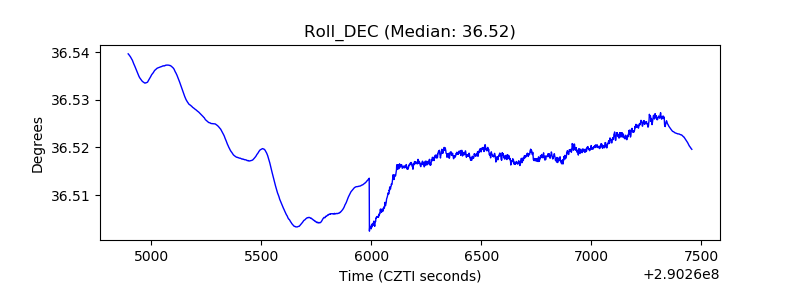 |
| _Roll_RA | 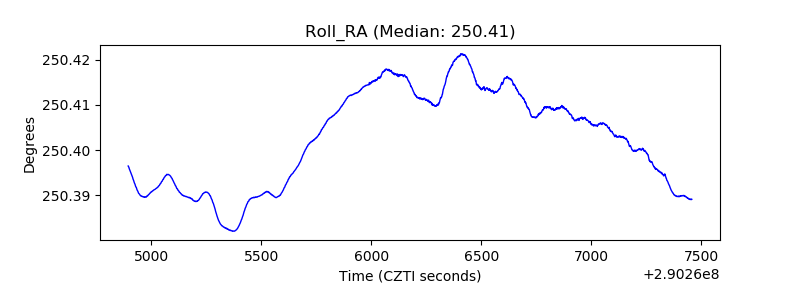 |
| Veto Counter | 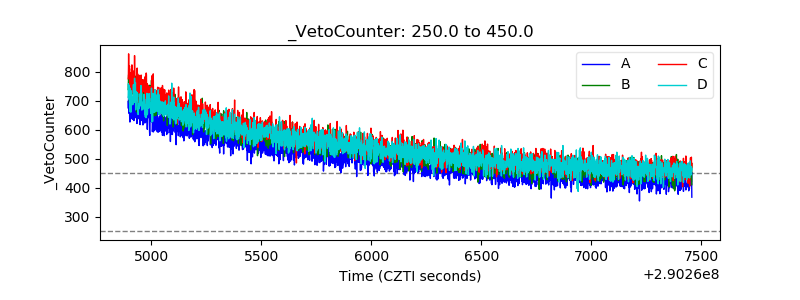 |