| Param | Original file | Final file |
|---|---|---|
| Filename | modeM0/AS1A05_226T06_9000002792cztM0_level2.fits | modeM0/AS1A05_226T06_9000002792cztM0_level2_quad_clean.evt |
| Size (bytes) | 201,072,960 | 170,262,720 |
| Size | 191.8 MB | 162.4 MB |
| Events in quadrant A | 1,275,910 | 1,024,479 |
| Events in quadrant B | 1,212,142 | 1,021,225 |
| Events in quadrant C | 1,216,264 | 951,079 |
| Events in quadrant D | 1,059,644 | 833,134 |
| Mode M9 | |||
|---|---|---|---|
| Quadrant | BADHDUFLAG | Total packets | Discarded packets |
| A | 0 | 44 | 0 |
| B | 0 | 44 | 0 |
| C | 0 | 44 | 0 |
| D | 0 | 44 | 0 |
| Mode SS | |||
|---|---|---|---|
| Quadrant | BADHDUFLAG | Total packets | Discarded packets |
| A | 0 | 392 | 0 |
| B | 0 | 392 | 0 |
| C | 0 | 392 | 0 |
| D | 0 | 392 | 0 |
| Mode M0 | |||
|---|---|---|---|
| Quadrant | BADHDUFLAG | Total packets | Discarded packets |
| A | 0 | 41146 | 0 |
| B | 0 | 41191 | 0 |
| C | 0 | 42366 | 0 |
| D | 0 | 54606 | 0 |
| Quadrant | Total seconds | Saturated seconds | Saturation percentage |
|---|---|---|---|
| A | 19245 | 233 | 1.210704% |
| B | 19245 | 250 | 1.299039% |
| C | 19245 | 382 | 1.984931% |
| D | 19245 | 932 | 4.842816% |
Noise dominated data is calculated using 1-second bins in cleaned event files. If a bin has >2000 counts, and if more than 50% of those come from <1% of pixels, then it is considered to be noise-dominated and hence unusable.
| Quadrant | # 1 sec bins | Bins with >0 counts | Bins with >2000 counts | High rate bins dominated by noise | Noise dominated (total time) | Noise dominated (detector-on time) | Marked lightcurve |
|---|---|---|---|---|---|---|---|
| A | 23595 | 19242 | 0 | 0 | 0.00% | 0.00% | 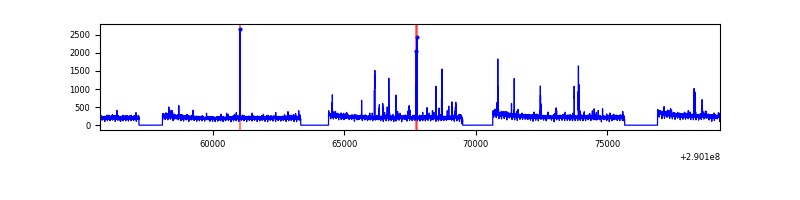 |
| B | 23595 | 19242 | 0 | 0 | 0.00% | 0.00% |  |
| C | 23595 | 19243 | 0 | 0 | 0.00% | 0.00% | 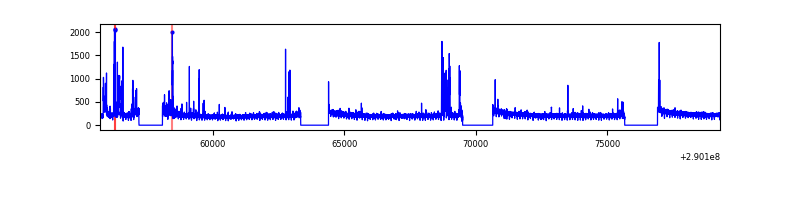 |
| D | 23595 | 19208 | 0 | 0 | 0.00% | 0.00% | 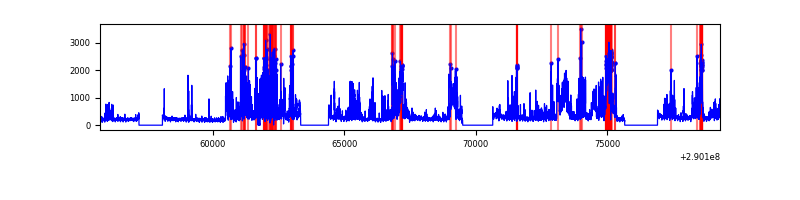 |
Top three noisy pixels from each quadrant. If the there are fewer than three noisy pixels in the level2.evt file, extra rows are filled as -1
| Pixel properties | Quadrant properties | ||||||
|---|---|---|---|---|---|---|---|
| Quadrant | DetID | PixID | Counts | Sigma | Mean | Median | Sigma |
| A | 7 | 110 | 1061 | 9.02 | 333 | 314 | 82.8 |
| A | 0 | 29 | 1030 | 8.65 | 333 | 314 | 82.8 |
| A | 9 | 19 | 955 | 7.74 | 333 | 314 | 82.8 |
| B | 2 | 9 | 926 | 9.66 | 320 | 306 | 64.2 |
| B | 2 | 8 | 818 | 7.98 | 320 | 306 | 64.2 |
| B | 5 | 225 | 805 | 7.77 | 320 | 306 | 64.2 |
| C | 3 | 126 | 841 | 6.55 | 321 | 302 | 82.2 |
| C | 12 | 249 | 806 | 6.13 | 321 | 302 | 82.2 |
| C | 12 | 250 | 804 | 6.1 | 321 | 302 | 82.2 |
| D | 10 | 190 | 760 | 6.05 | 302 | 276 | 80.0 |
| D | 3 | 14 | 757 | 6.01 | 302 | 276 | 80.0 |
| D | 7 | 3 | 740 | 5.8 | 302 | 276 | 80.0 |
Histogram calculated using DETX and DETY for each event in the final _common_clean file
| Quadrant A |  |
 |
Quadrant B |
|---|---|---|---|
| Quadrant D |  |
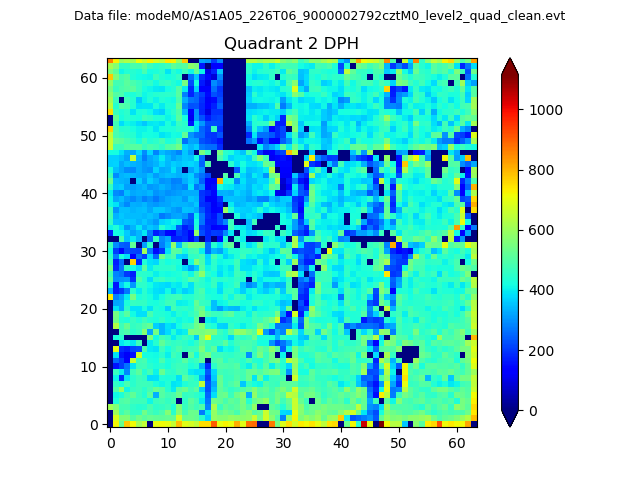 |
Quadrant C |
| Plot type | Count rate plots | Images |
|---|---|---|
| Comparison with Poisson distribution Blue bars denote a histogram of data divided into 1 sec bins. Red curve is a Poisson curve with rate = median count rate of data. |
 |
 |
| Quadrant-wise count rates Data is divided into 100 sec bins |
 |
|
| Module-wise count rates for Quadrant A Data is divided into 100 sec bins |
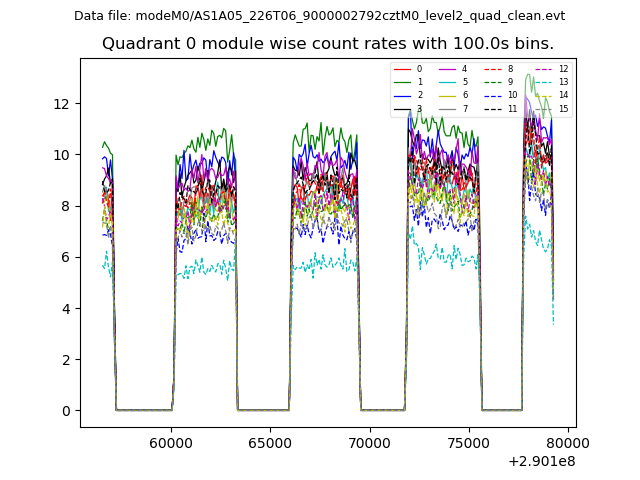 |
 |
| Module-wise count rates for Quadrant B Data is divided into 100 sec bins |
 |
 |
| Module-wise count rates for Quadrant C Data is divided into 100 sec bins |
 |
 |
| Module-wise count rates for Quadrant D Data is divided into 100 sec bins |
 |
 |
| Parameter | Plot |
|---|---|
| CZT HV Monitor |  |
| D_VDD | 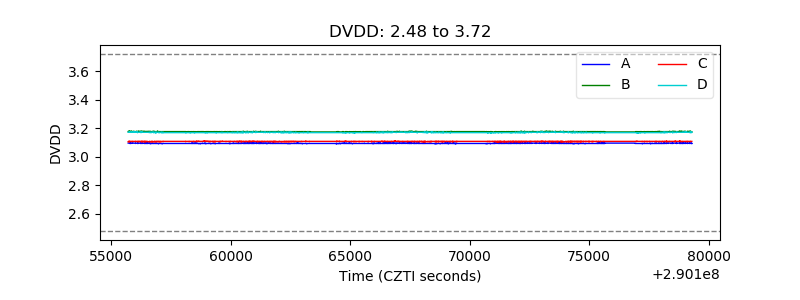 |
| Temperature 1 | 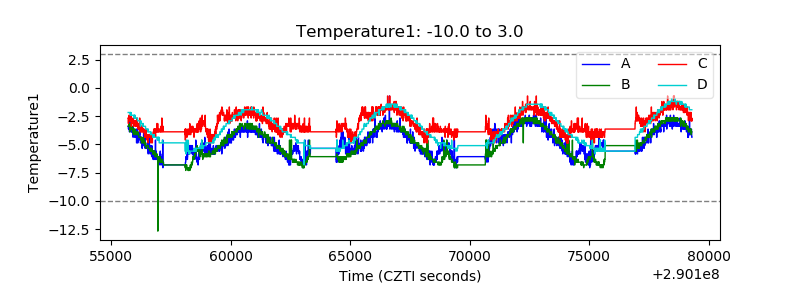 |
| Veto HV Monitor |  |
| Veto LLD | 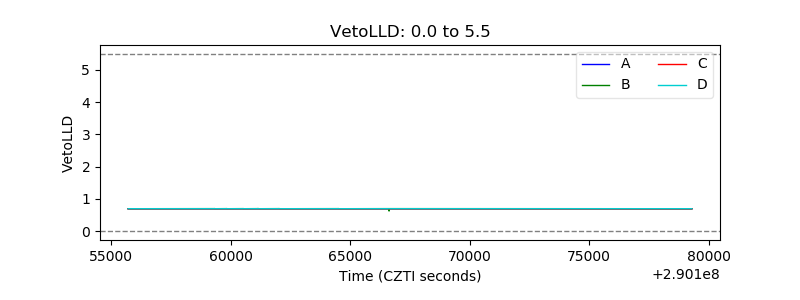 |
| Alpha Counter |  |
| _CPM_Rate |  |
| CZT Counter |  |
| +2.5 Volts monitor |  |
| +5 Volts monitor |  |
| _ROLL_ROT |  |
| _Roll_DEC |  |
| _Roll_RA | 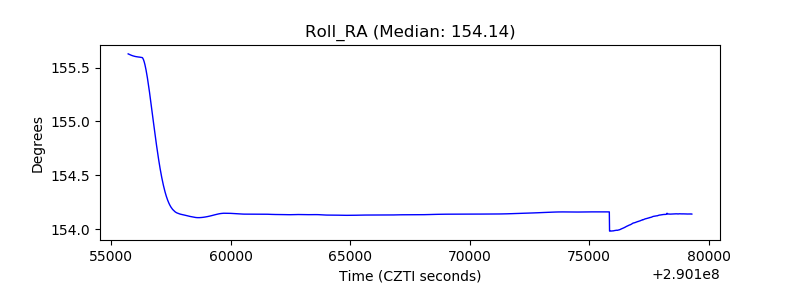 |
| Veto Counter |  |