| Param | Original file | Final file |
|---|---|---|
| Filename | modeM0/AS1A05_226T06_9000002792_18681cztM0_level2.evt | modeM0/AS1A05_226T06_9000002792_18681cztM0_level2_quad_clean.evt |
| Size (bytes) | 201,504,960 | 29,980,800 |
| Size | 192.2 MB | 28.6 MB |
| Events in quadrant A | 1,385,036 | 179,937 |
| Events in quadrant B | 1,431,143 | 182,502 |
| Events in quadrant C | 1,709,825 | 174,337 |
| Events in quadrant D | 1,387,597 | 173,683 |
| Mode M9 | |||
|---|---|---|---|
| Quadrant | BADHDUFLAG | Total packets | Discarded packets |
| A | 0 | 9 | 0 |
| B | 0 | 9 | 0 |
| C | 0 | 9 | 0 |
| D | 0 | 9 | 0 |
| Mode SS | |||
|---|---|---|---|
| Quadrant | BADHDUFLAG | Total packets | Discarded packets |
| A | 0 | 56 | 0 |
| B | 0 | 56 | 0 |
| C | 0 | 56 | 0 |
| D | 0 | 56 | 0 |
| Mode M0 | |||
|---|---|---|---|
| Quadrant | BADHDUFLAG | Total packets | Discarded packets |
| A | 0 | 5728 | 1 |
| B | 0 | 5835 | 1 |
| C | 0 | 6767 | 1 |
| D | 0 | 5866 | 1 |
| Quadrant | Total seconds | Saturated seconds | Saturation percentage |
|---|---|---|---|
| A | 2754 | 43 | 1.561365% |
| B | 2754 | 51 | 1.851852% |
| C | 2754 | 92 | 3.340595% |
| D | 2754 | 35 | 1.270879% |
Noise dominated data is calculated using 1-second bins in cleaned event files. If a bin has >2000 counts, and if more than 50% of those come from <1% of pixels, then it is considered to be noise-dominated and hence unusable.
| Quadrant | # 1 sec bins | Bins with >0 counts | Bins with >2000 counts | High rate bins dominated by noise | Noise dominated (total time) | Noise dominated (detector-on time) | Marked lightcurve |
|---|---|---|---|---|---|---|---|
| A | 3649 | 2755 | 0 | 0 | 0.00% | 0.00% | 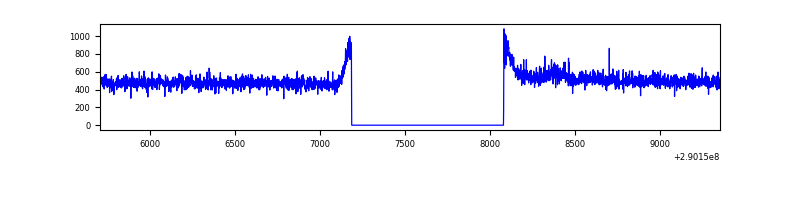 |
| B | 3649 | 2755 | 1 | 1 | 0.03% | 0.04% | 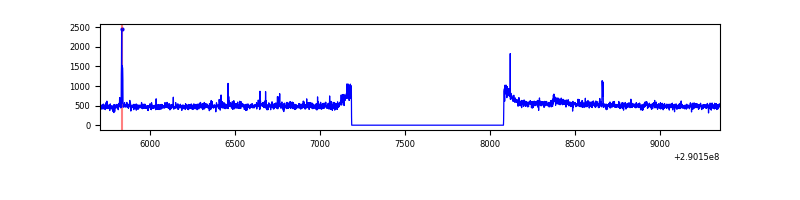 |
| C | 3649 | 2755 | 14 | 14 | 0.38% | 0.51% | 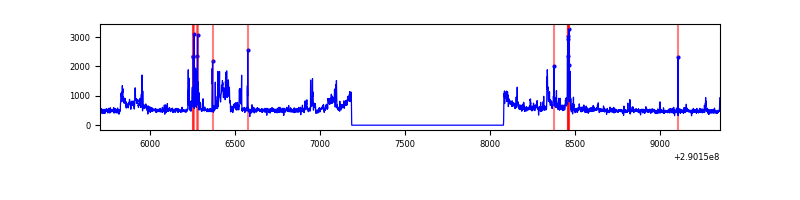 |
| D | 3649 | 2755 | 2 | 2 | 0.05% | 0.07% | 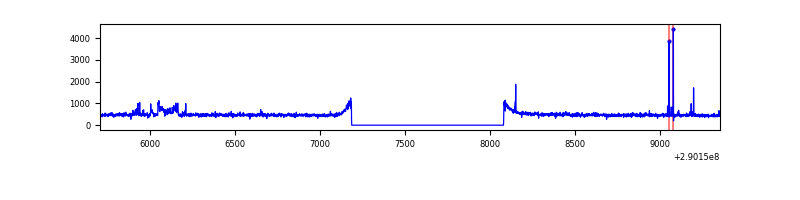 |
Top three noisy pixels from each quadrant. If the there are fewer than three noisy pixels in the level2.evt file, extra rows are filled as -1
| Pixel properties | Quadrant properties | ||||||
|---|---|---|---|---|---|---|---|
| Quadrant | DetID | PixID | Counts | Sigma | Mean | Median | Sigma |
| A | 9 | 143 | 7629 | 99.21 | 356 | 349 | 73.4 |
| A | 13 | 254 | 4523 | 56.88 | 356 | 349 | 73.4 |
| A | 0 | 226 | 3099 | 37.48 | 356 | 349 | 73.4 |
| B | 4 | 171 | 13863 | 193.94 | 355 | 347 | 69.7 |
| B | 0 | 229 | 10862 | 150.88 | 355 | 347 | 69.7 |
| B | 12 | 111 | 8404 | 115.61 | 355 | 347 | 69.7 |
| C | 9 | 54 | 307022 | 3744.45 | 341 | 343 | 81.9 |
| C | 14 | 238 | 51811 | 628.41 | 341 | 343 | 81.9 |
| C | 3 | 233 | 20032 | 240.4 | 341 | 343 | 81.9 |
| D | 1 | 52 | 62111 | 723.21 | 346 | 335 | 85.4 |
| D | 7 | 238 | 13063 | 149.01 | 346 | 335 | 85.4 |
| D | 2 | 234 | 12054 | 137.19 | 346 | 335 | 85.4 |
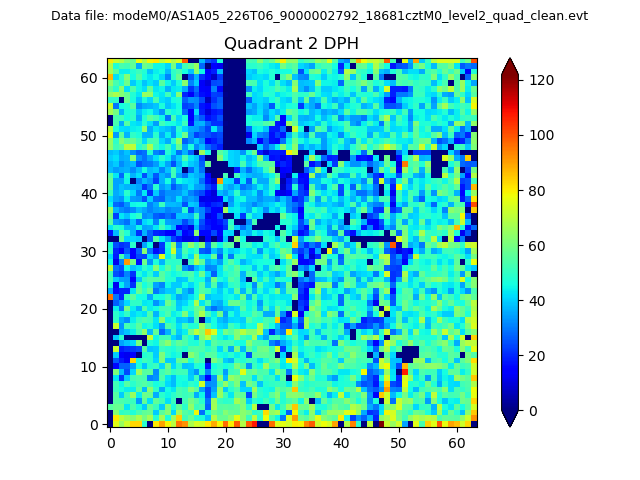
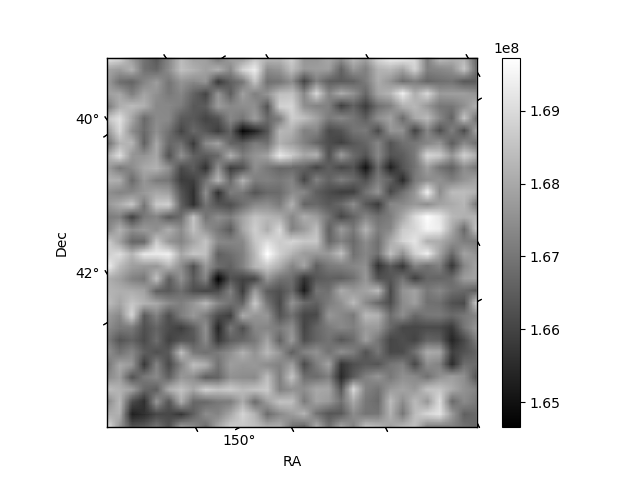
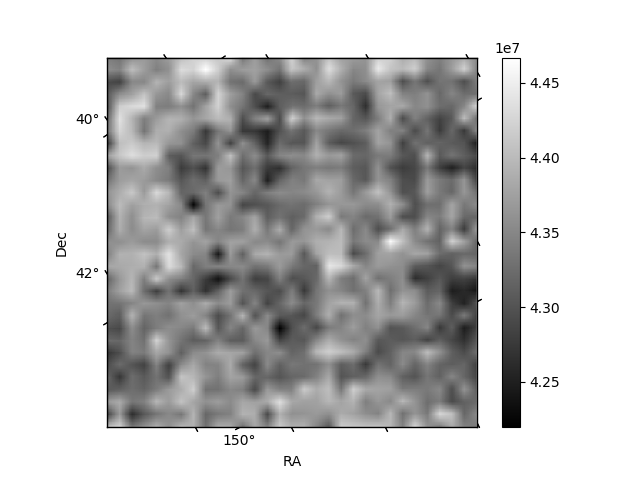
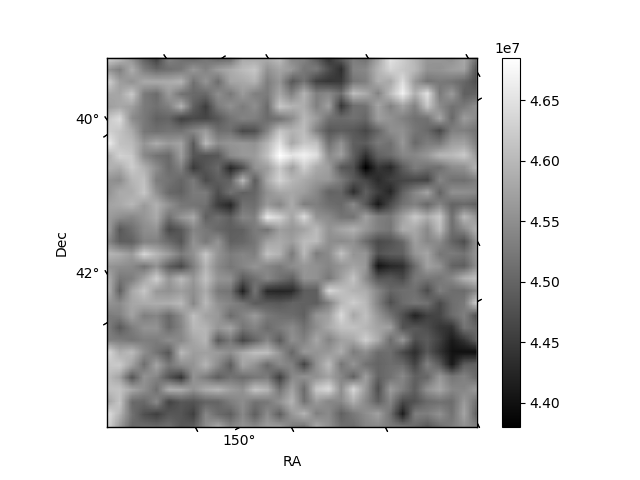
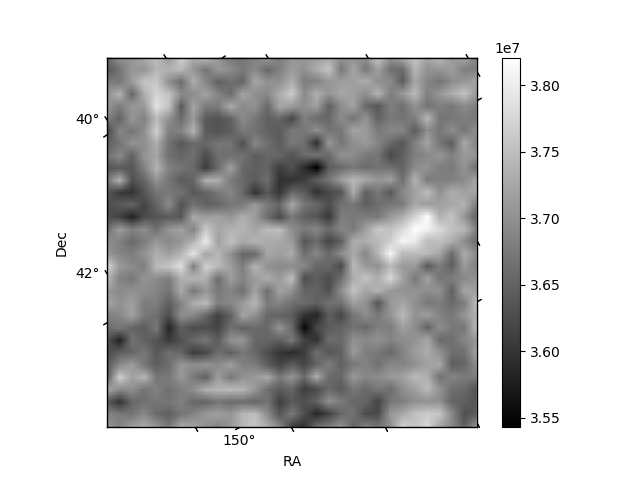
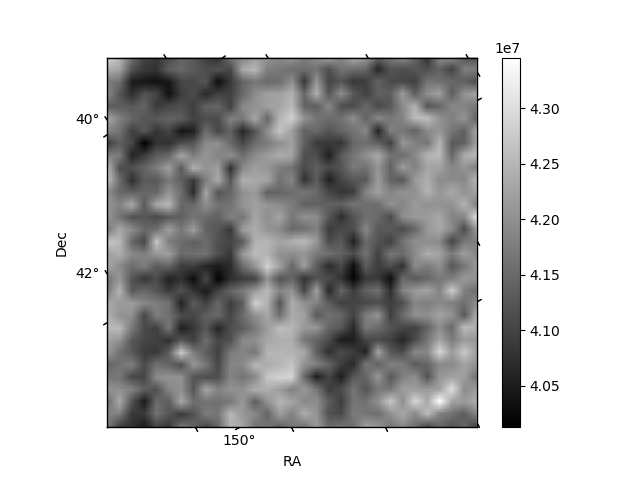
Histogram calculated using DETX and DETY for each event in the final _common_clean file
| Quadrant A | 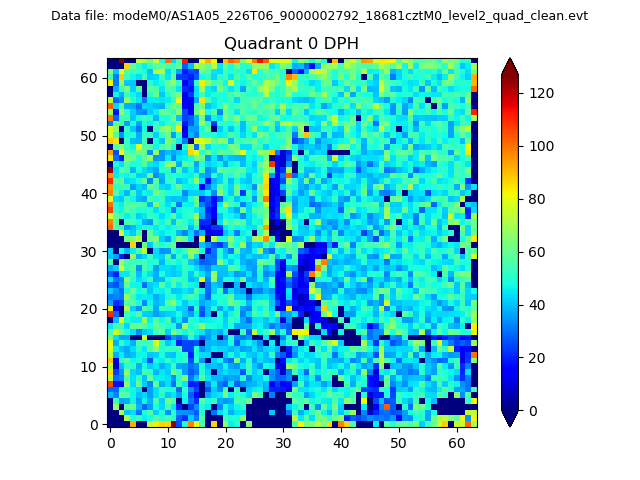 |
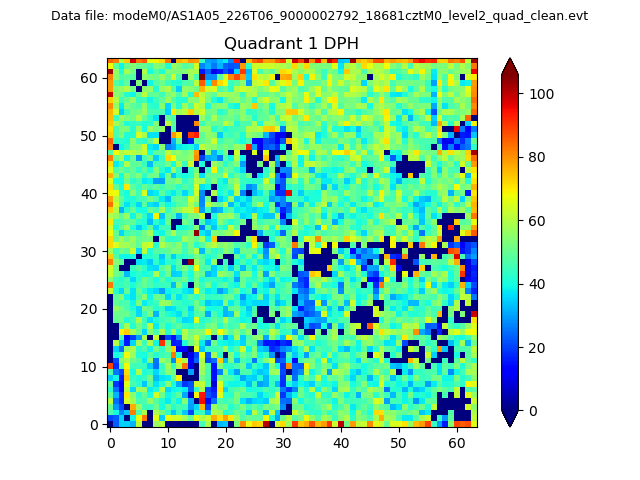 |
Quadrant B |
|---|---|---|---|
| Quadrant D | 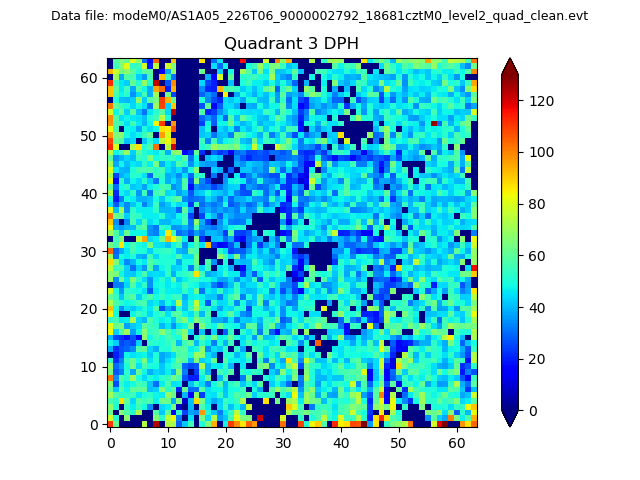 |
 |
Quadrant C |
| Plot type | Count rate plots | Images |
|---|---|---|
| Comparison with Poisson distribution Blue bars denote a histogram of data divided into 1 sec bins. Red curve is a Poisson curve with rate = median count rate of data. |
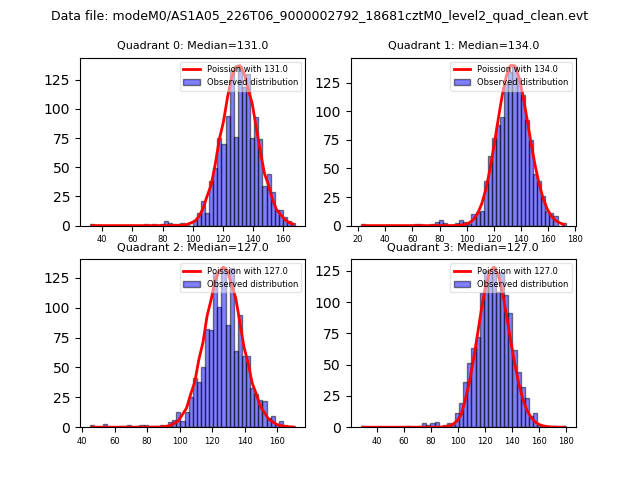 |
 |
| Quadrant-wise count rates Data is divided into 100 sec bins |
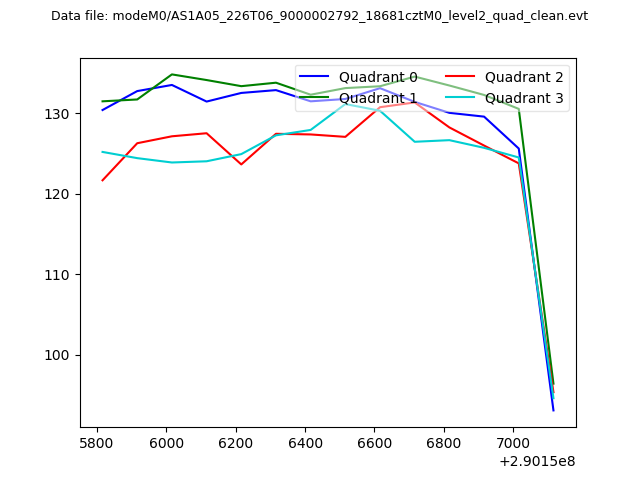 |
|
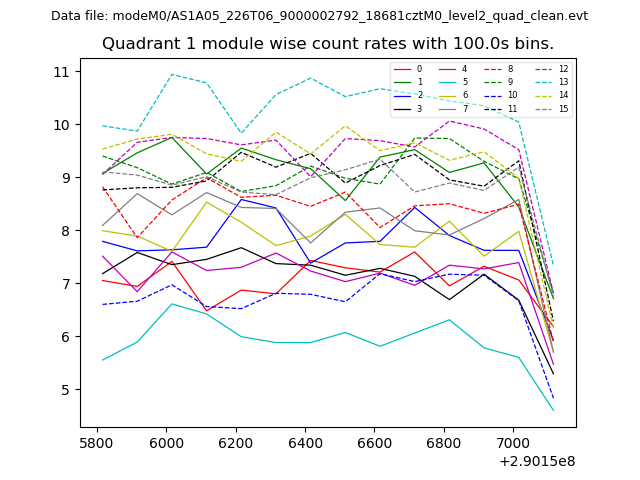
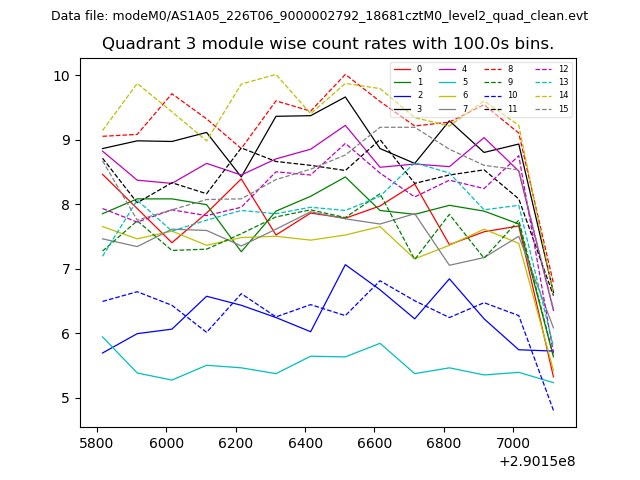
| Module-wise count rates for Quadrant A Data is divided into 100 sec bins |
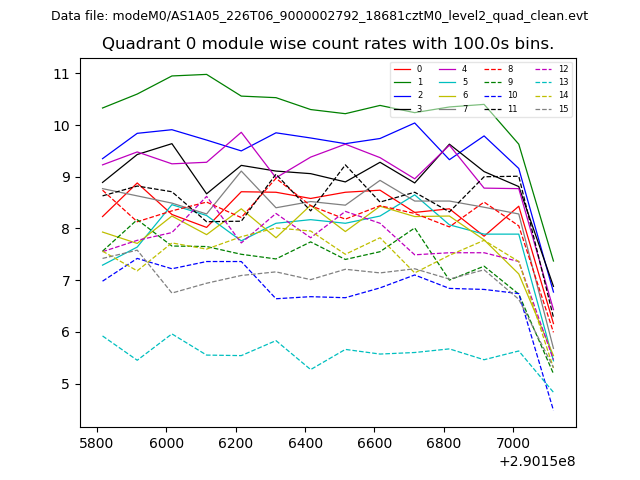 |
 |
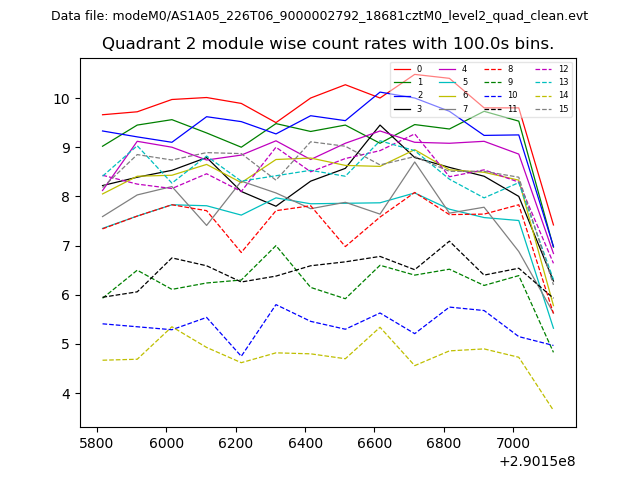
| Module-wise count rates for Quadrant B Data is divided into 100 sec bins |
 |
 |
| Module-wise count rates for Quadrant C Data is divided into 100 sec bins |
 |
 |
| Module-wise count rates for Quadrant D Data is divided into 100 sec bins |
 |
 |
| Parameter | Plot |
|---|---|
| CZT HV Monitor | 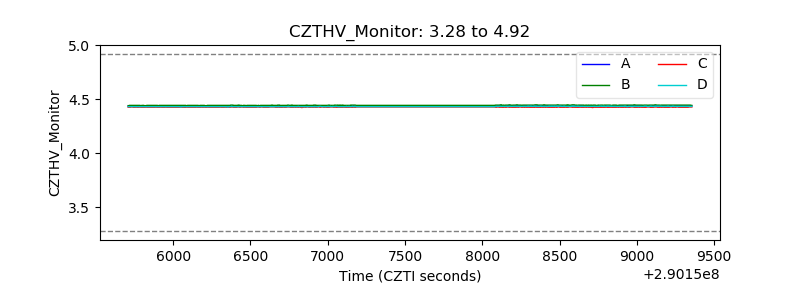 |
| D_VDD | 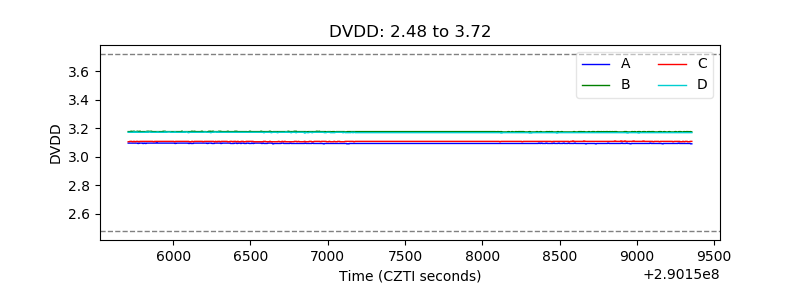 |
| Temperature 1 | 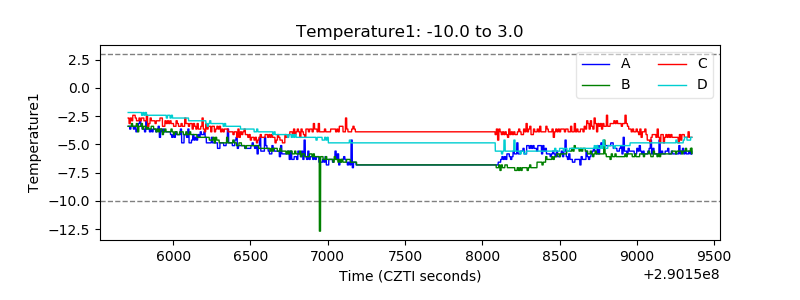 |
| Veto HV Monitor | 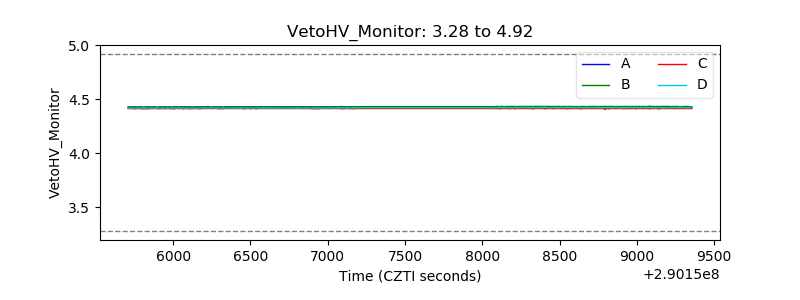 |
| Veto LLD | 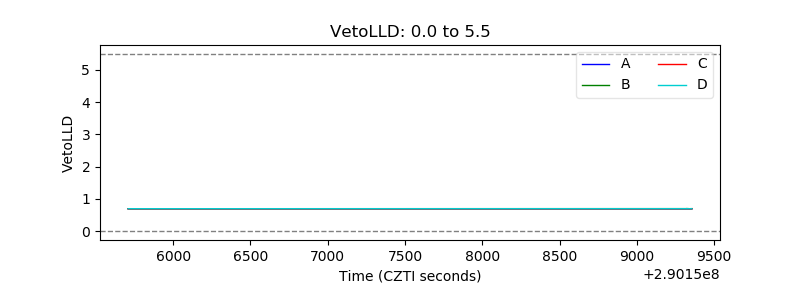 |
| Alpha Counter | 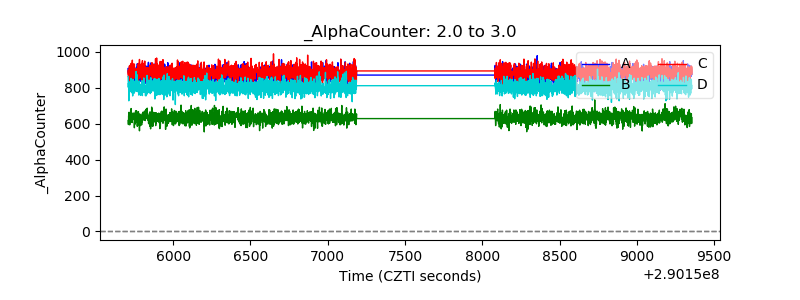 |
| _CPM_Rate | 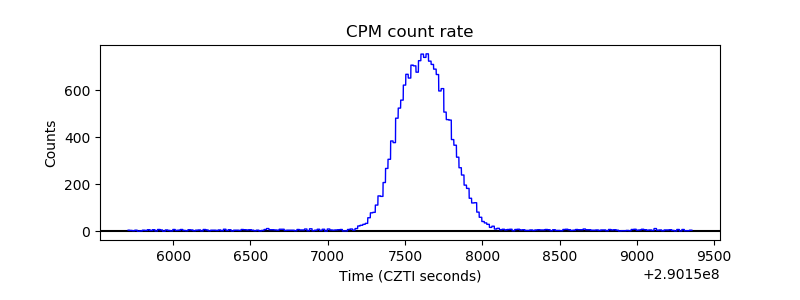 |
| CZT Counter | 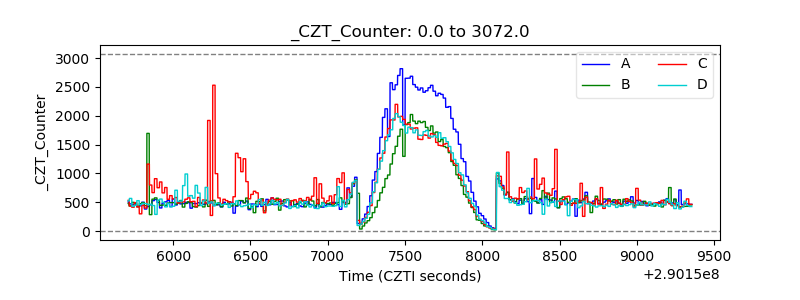 |
| +2.5 Volts monitor |  |
| +5 Volts monitor |  |
| _ROLL_ROT | 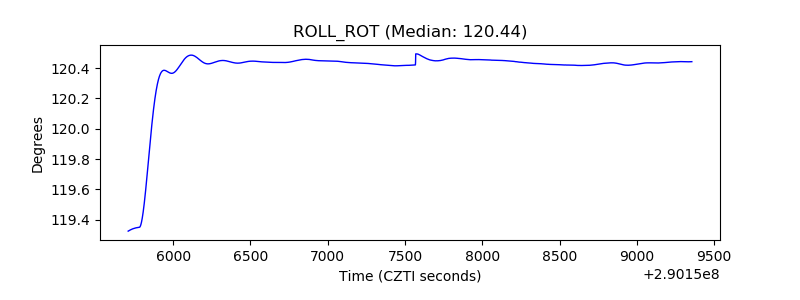 |
| _Roll_DEC | 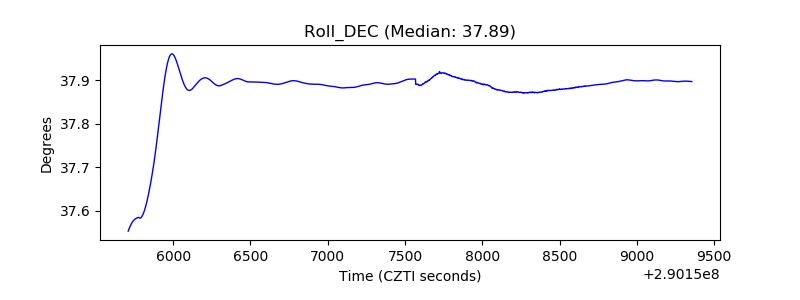 |
| _Roll_RA | 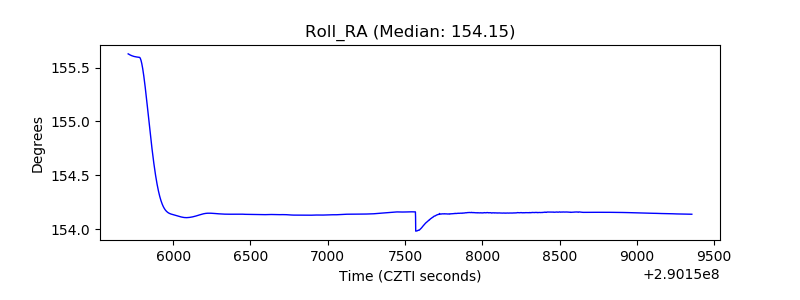 |
| Veto Counter | 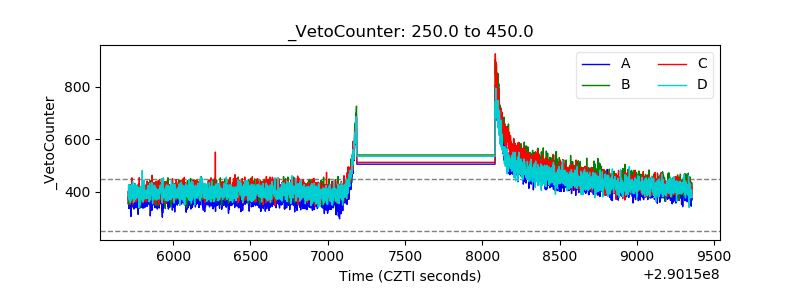 |