| Param | Original file | Final file |
|---|---|---|
| Filename | modeM0/AS1A05_226T06_9000002792_18682cztM0_level2.evt | modeM0/AS1A05_226T06_9000002792_18682cztM0_level2_quad_clean.evt |
| Size (bytes) | 530,184,960 | 72,858,240 |
| Size | 505.6 MB | 69.5 MB |
| Events in quadrant A | 3,422,005 | 447,448 |
| Events in quadrant B | 3,485,914 | 451,548 |
| Events in quadrant C | 3,610,092 | 427,727 |
| Events in quadrant D | 5,070,040 | 397,803 |
| Mode M9 | |||
|---|---|---|---|
| Quadrant | BADHDUFLAG | Total packets | Discarded packets |
| A | 0 | 20 | 0 |
| B | 0 | 20 | 0 |
| C | 0 | 20 | 0 |
| D | 0 | 20 | 0 |
| Mode SS | |||
|---|---|---|---|
| Quadrant | BADHDUFLAG | Total packets | Discarded packets |
| A | 0 | 142 | 0 |
| B | 0 | 142 | 0 |
| C | 0 | 142 | 0 |
| D | 0 | 142 | 0 |
| Mode M0 | |||
|---|---|---|---|
| Quadrant | BADHDUFLAG | Total packets | Discarded packets |
| A | 0 | 14446 | 2 |
| B | 0 | 14543 | 2 |
| C | 0 | 15007 | 2 |
| D | 0 | 19757 | 2 |
| Quadrant | Total seconds | Saturated seconds | Saturation percentage |
|---|---|---|---|
| A | 6907 | 84 | 1.216158% |
| B | 6908 | 90 | 1.302837% |
| C | 6908 | 142 | 2.055588% |
| D | 6908 | 453 | 6.557614% |
Noise dominated data is calculated using 1-second bins in cleaned event files. If a bin has >2000 counts, and if more than 50% of those come from <1% of pixels, then it is considered to be noise-dominated and hence unusable.
| Quadrant | # 1 sec bins | Bins with >0 counts | Bins with >2000 counts | High rate bins dominated by noise | Noise dominated (total time) | Noise dominated (detector-on time) | Marked lightcurve |
|---|---|---|---|---|---|---|---|
| A | 8862 | 6908 | 1 | 1 | 0.01% | 0.01% | 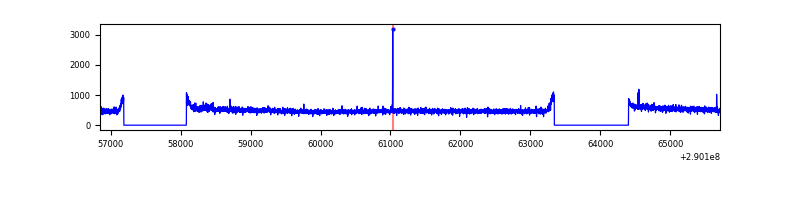 |
| B | 8863 | 6910 | 0 | 0 | 0.00% | 0.00% | 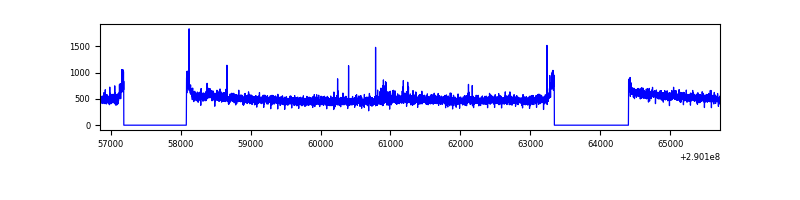 |
| C | 8863 | 6910 | 18 | 18 | 0.20% | 0.26% | 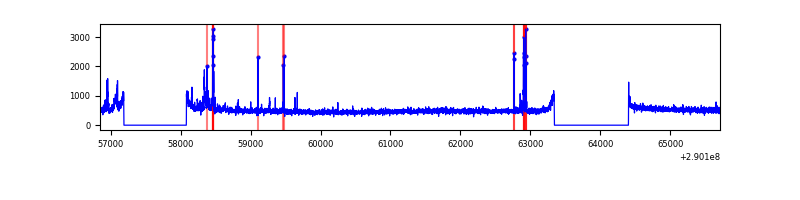 |
| D | 8863 | 6910 | 275 | 275 | 3.10% | 3.98% | 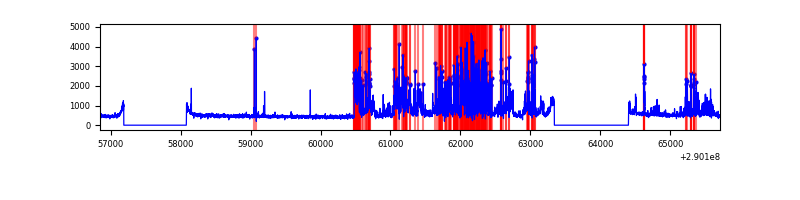 |
Top three noisy pixels from each quadrant. If the there are fewer than three noisy pixels in the level2.evt file, extra rows are filled as -1
| Pixel properties | Quadrant properties | ||||||
|---|---|---|---|---|---|---|---|
| Quadrant | DetID | PixID | Counts | Sigma | Mean | Median | Sigma |
| A | 9 | 143 | 16240 | 86.54 | 882 | 866 | 177.7 |
| A | 13 | 254 | 11085 | 57.52 | 882 | 866 | 177.7 |
| A | 0 | 226 | 7549 | 37.62 | 882 | 866 | 177.7 |
| B | 4 | 216 | 33046 | 195.01 | 874 | 854 | 165.1 |
| B | 12 | 111 | 20627 | 119.78 | 874 | 854 | 165.1 |
| B | 11 | 111 | 18146 | 104.75 | 874 | 854 | 165.1 |
| C | 9 | 54 | 196987 | 1006.25 | 834 | 839 | 194.9 |
| C | 14 | 238 | 128898 | 656.95 | 834 | 839 | 194.9 |
| C | 3 | 233 | 33849 | 169.34 | 834 | 839 | 194.9 |
| D | 1 | 52 | 1291131 | 6409.36 | 831 | 807 | 201.3 |
| D | 7 | 238 | 545643 | 2706.34 | 831 | 807 | 201.3 |
| D | 7 | 96 | 85809 | 422.23 | 831 | 807 | 201.3 |
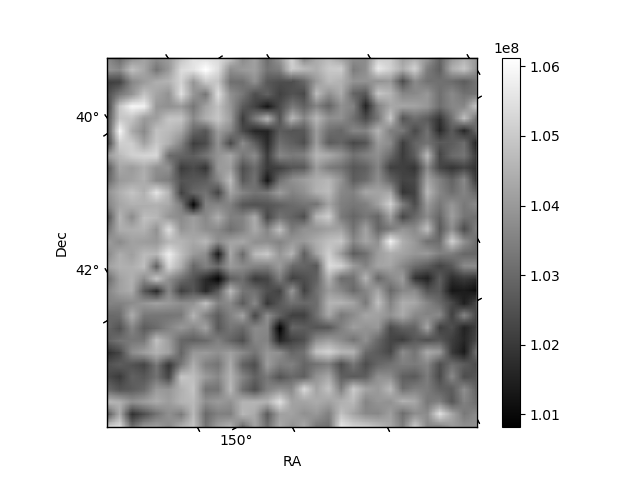
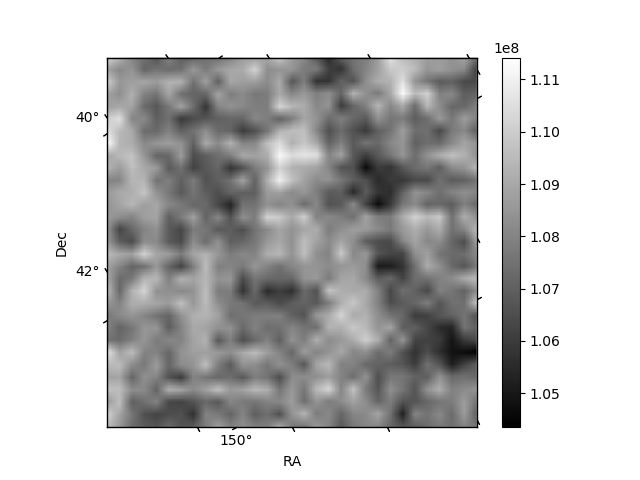
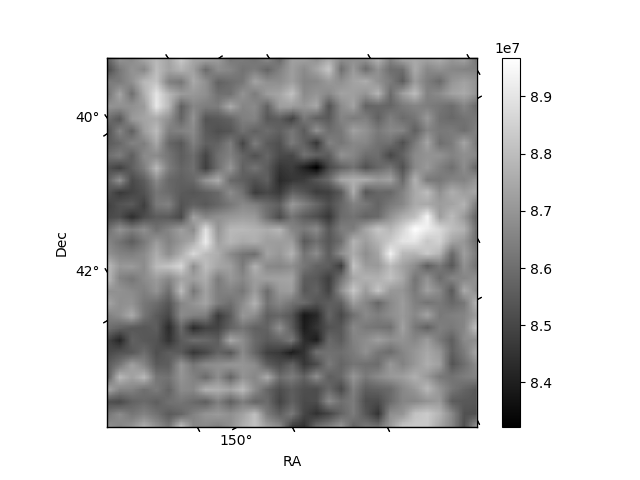
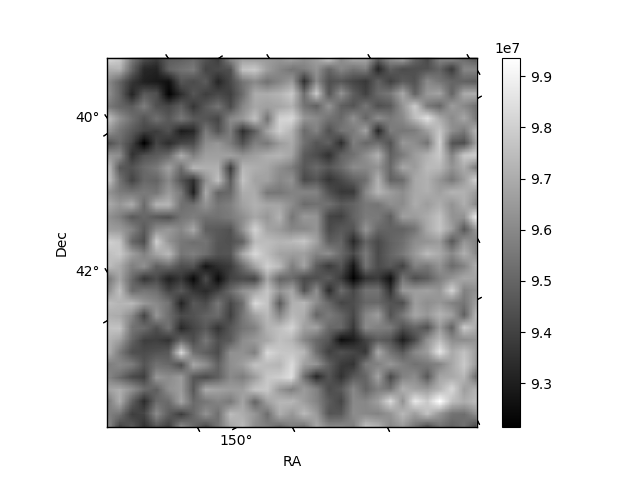
Histogram calculated using DETX and DETY for each event in the final _common_clean file
| Quadrant A | 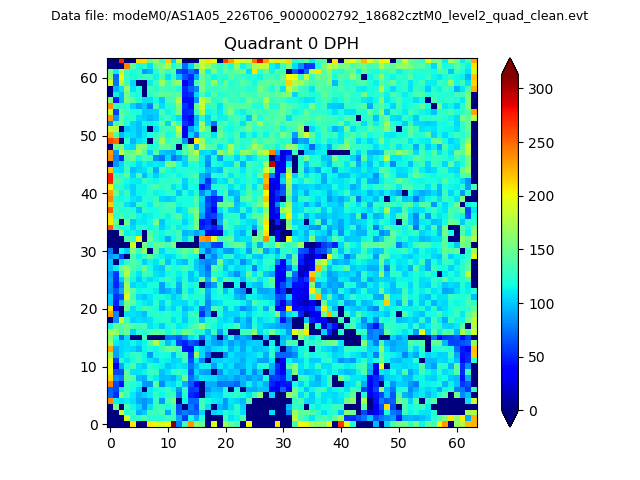 |
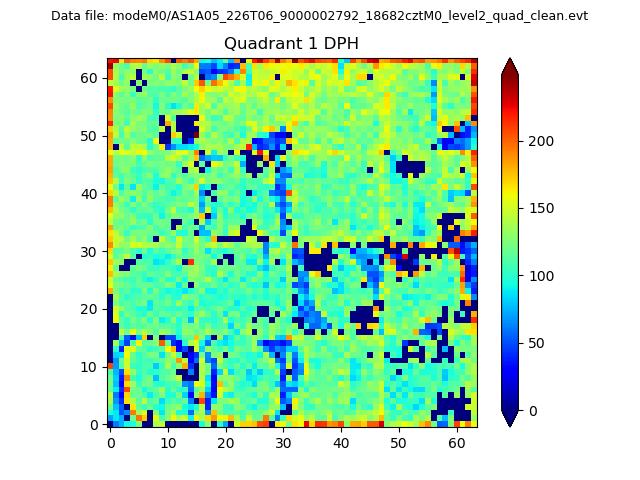 |
Quadrant B |
|---|---|---|---|
| Quadrant D |  |
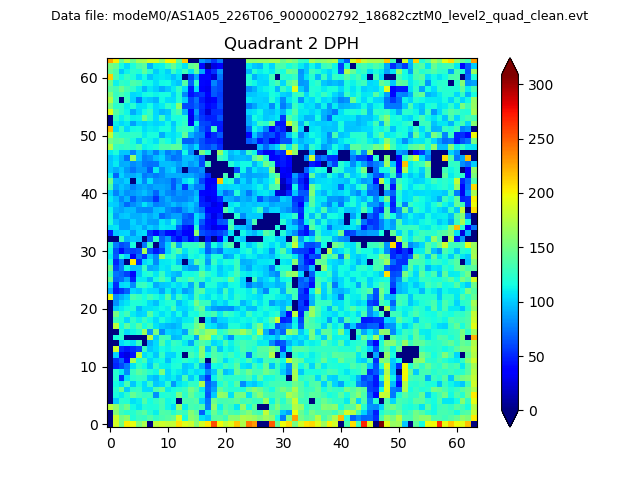 |
Quadrant C |
| Plot type | Count rate plots | Images |
|---|---|---|
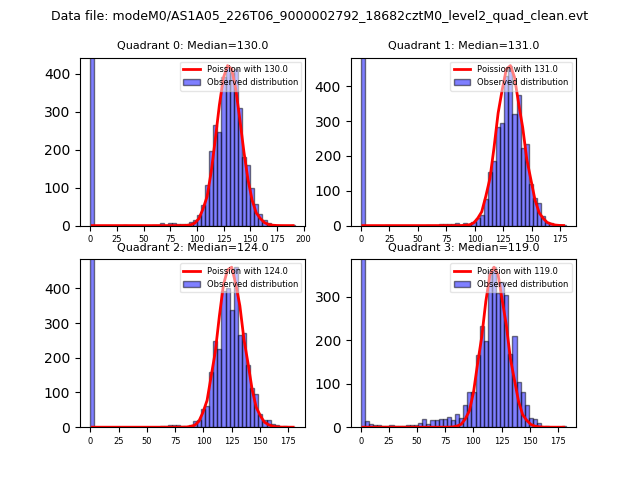
| Comparison with Poisson distribution Blue bars denote a histogram of data divided into 1 sec bins. Red curve is a Poisson curve with rate = median count rate of data. |
 |
 |
| Quadrant-wise count rates Data is divided into 100 sec bins |
 |
|
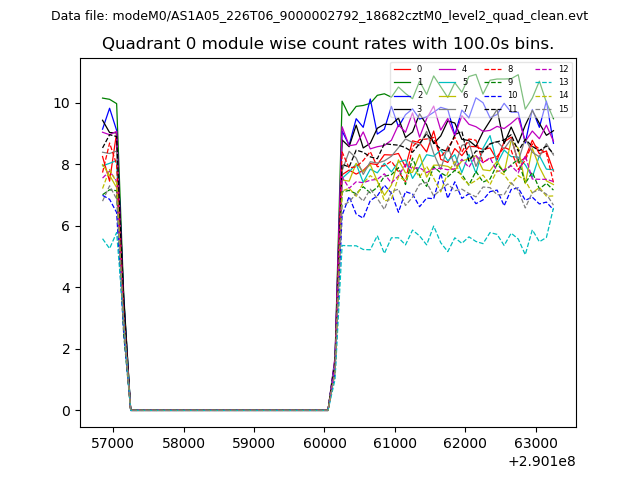
| Module-wise count rates for Quadrant A Data is divided into 100 sec bins |
 |
 |
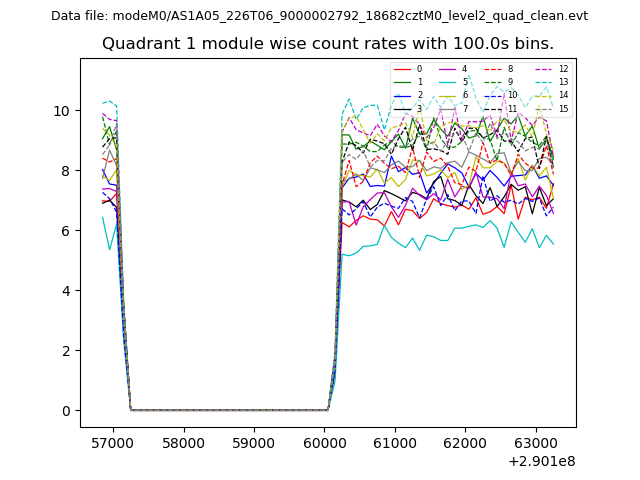
| Module-wise count rates for Quadrant B Data is divided into 100 sec bins |
 |
 |
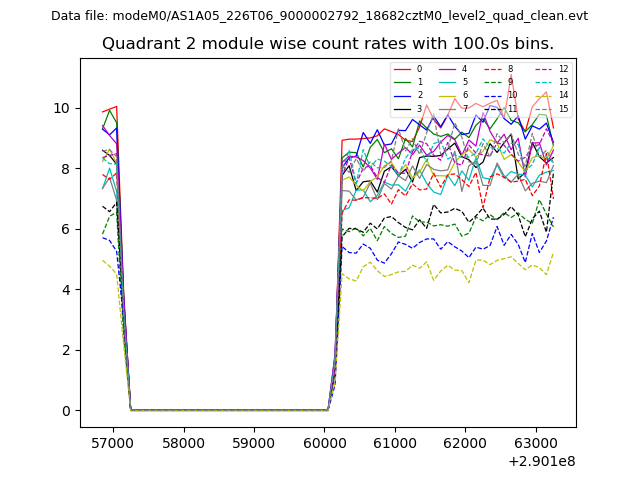
| Module-wise count rates for Quadrant C Data is divided into 100 sec bins |
 |
 |
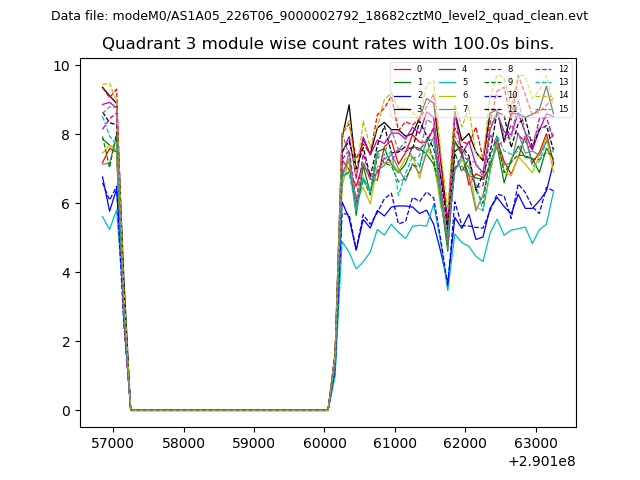
| Module-wise count rates for Quadrant D Data is divided into 100 sec bins |
 |
 |
| Parameter | Plot |
|---|---|
| CZT HV Monitor | 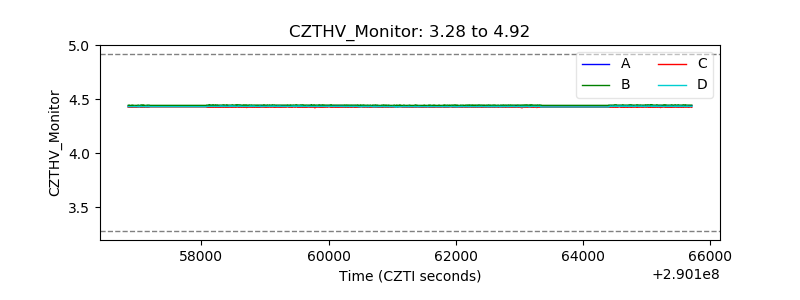 |
| D_VDD | 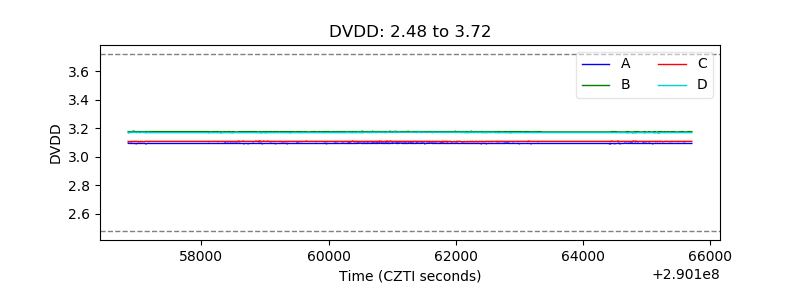 |
| Temperature 1 | 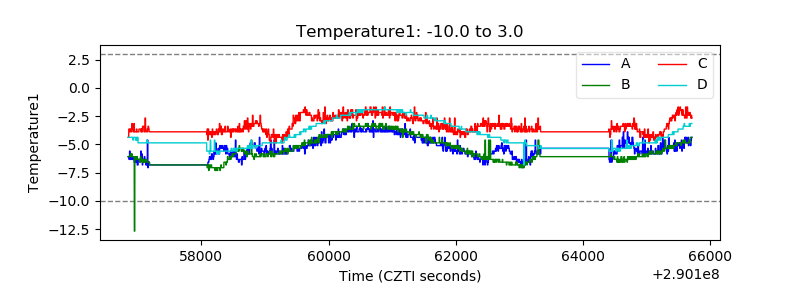 |
| Veto HV Monitor |  |
| Veto LLD | 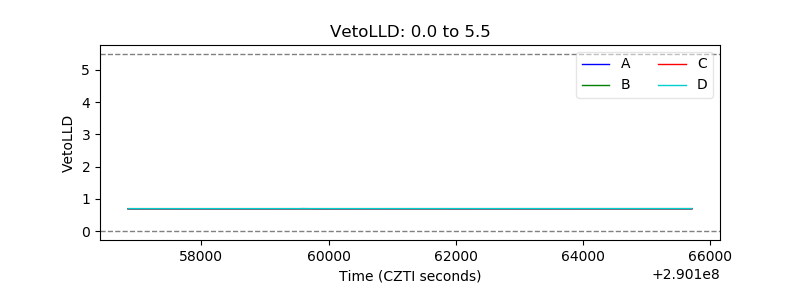 |
| Alpha Counter | 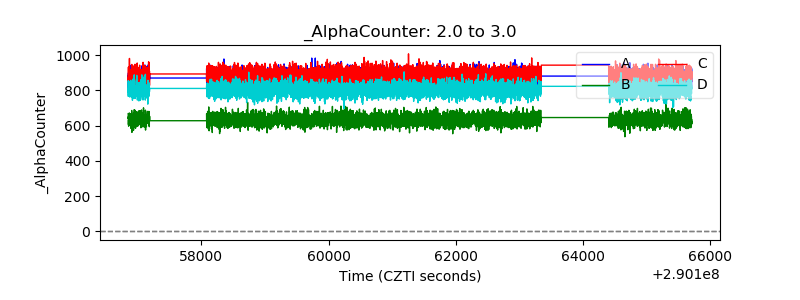 |
| _CPM_Rate | 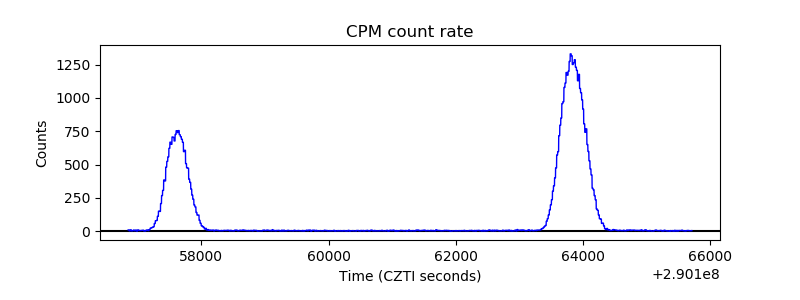 |
| CZT Counter | 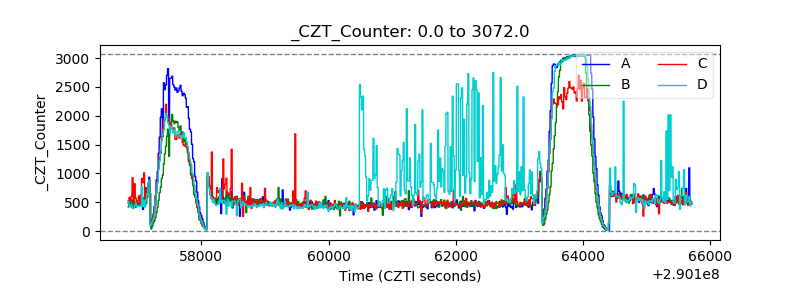 |
| +2.5 Volts monitor | 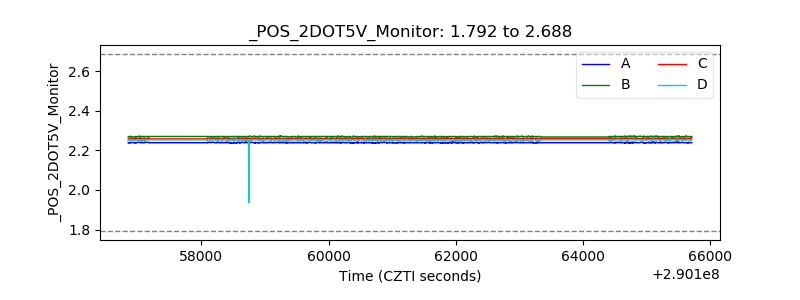 |
| +5 Volts monitor |  |
| _ROLL_ROT | 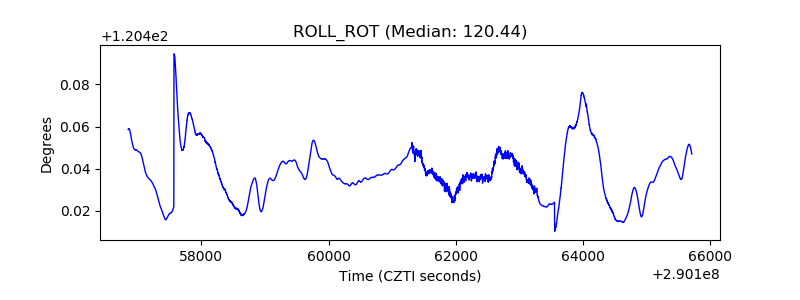 |
| _Roll_DEC | 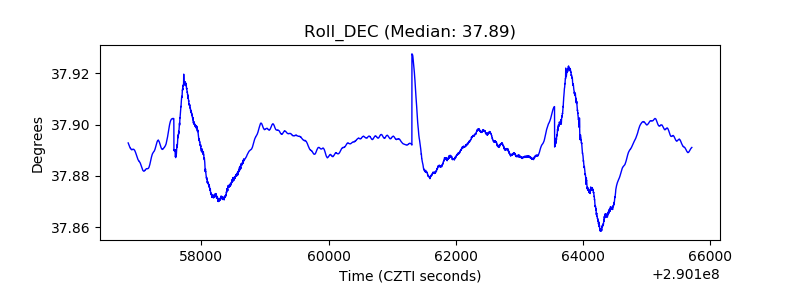 |
| _Roll_RA | 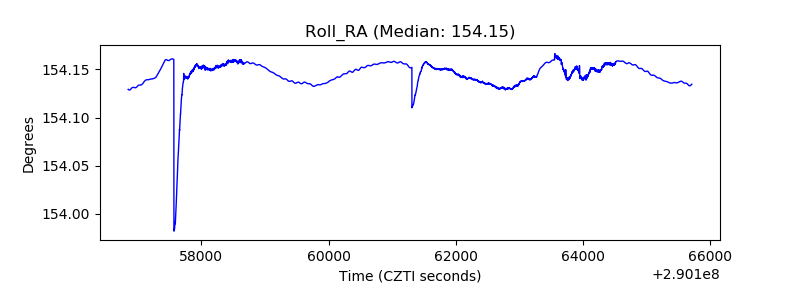 |
| Veto Counter | 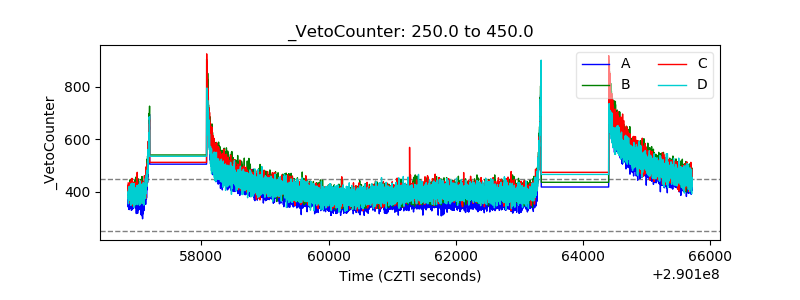 |