| Param | Original file | Final file |
|---|---|---|
| Filename | modeM0/AS1A05_226T06_9000002792_18684cztM0_level2.evt | modeM0/AS1A05_226T06_9000002792_18684cztM0_level2_quad_clean.evt |
| Size (bytes) | 506,468,160 | 77,843,520 |
| Size | 483.0 MB | 74.2 MB |
| Events in quadrant A | 3,448,657 | 488,397 |
| Events in quadrant B | 3,444,921 | 492,206 |
| Events in quadrant C | 3,562,242 | 464,070 |
| Events in quadrant D | 4,436,914 | 454,379 |
| Mode M9 | |||
|---|---|---|---|
| Quadrant | BADHDUFLAG | Total packets | Discarded packets |
| A | 0 | 17 | 0 |
| B | 0 | 18 | 0 |
| C | 0 | 18 | 0 |
| D | 0 | 18 | 0 |
| Mode SS | |||
|---|---|---|---|
| Quadrant | BADHDUFLAG | Total packets | Discarded packets |
| A | 0 | 134 | 0 |
| B | 0 | 134 | 0 |
| C | 0 | 134 | 0 |
| D | 0 | 134 | 0 |
| Mode M0 | |||
|---|---|---|---|
| Quadrant | BADHDUFLAG | Total packets | Discarded packets |
| A | 0 | 14351 | 2 |
| B | 0 | 14261 | 2 |
| C | 0 | 14588 | 2 |
| D | 0 | 17463 | 3 |
| Quadrant | Total seconds | Saturated seconds | Saturation percentage |
|---|---|---|---|
| A | 6566 | 81 | 1.233628% |
| B | 6566 | 75 | 1.142248% |
| C | 6566 | 124 | 1.888517% |
| D | 6565 | 190 | 2.894136% |
Noise dominated data is calculated using 1-second bins in cleaned event files. If a bin has >2000 counts, and if more than 50% of those come from <1% of pixels, then it is considered to be noise-dominated and hence unusable.
| Quadrant | # 1 sec bins | Bins with >0 counts | Bins with >2000 counts | High rate bins dominated by noise | Noise dominated (total time) | Noise dominated (detector-on time) | Marked lightcurve |
|---|---|---|---|---|---|---|---|
| A | 7711 | 6566 | 3 | 3 | 0.04% | 0.05% |  |
| B | 7711 | 6566 | 3 | 3 | 0.04% | 0.05% |  |
| C | 7711 | 6566 | 17 | 17 | 0.22% | 0.26% | 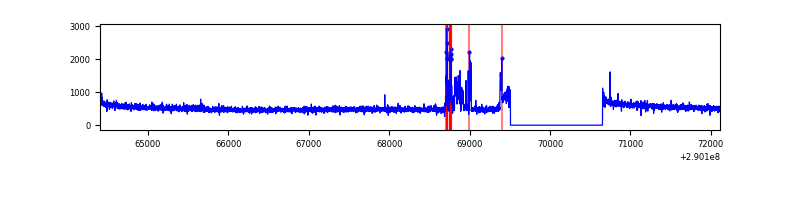 |
| D | 7710 | 6565 | 136 | 136 | 1.76% | 2.07% | 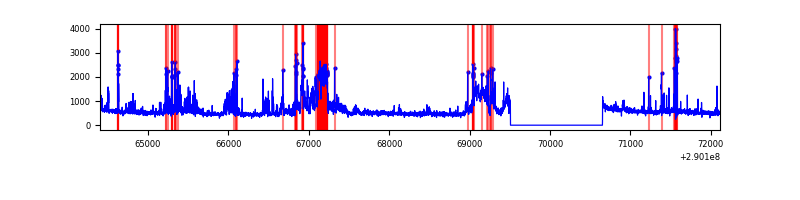 |
Top three noisy pixels from each quadrant. If the there are fewer than three noisy pixels in the level2.evt file, extra rows are filled as -1
| Pixel properties | Quadrant properties | ||||||
|---|---|---|---|---|---|---|---|
| Quadrant | DetID | PixID | Counts | Sigma | Mean | Median | Sigma |
| A | 6 | 16 | 56953 | 319.5 | 879 | 863 | 175.6 |
| A | 13 | 254 | 10577 | 55.33 | 879 | 863 | 175.6 |
| A | 0 | 226 | 7726 | 39.09 | 879 | 863 | 175.6 |
| B | 3 | 64 | 25795 | 152.45 | 865 | 846 | 163.7 |
| B | 12 | 111 | 19716 | 115.3 | 865 | 846 | 163.7 |
| B | 11 | 111 | 17284 | 100.44 | 865 | 846 | 163.7 |
| C | 9 | 54 | 199378 | 1032.78 | 825 | 832 | 192.2 |
| C | 14 | 238 | 129970 | 671.74 | 825 | 832 | 192.2 |
| C | 3 | 233 | 19940 | 99.39 | 825 | 832 | 192.2 |
| D | 7 | 238 | 867765 | 4299.51 | 838 | 814 | 201.6 |
| D | 1 | 52 | 322407 | 1594.89 | 838 | 814 | 201.6 |
| D | 7 | 96 | 42750 | 207.97 | 838 | 814 | 201.6 |
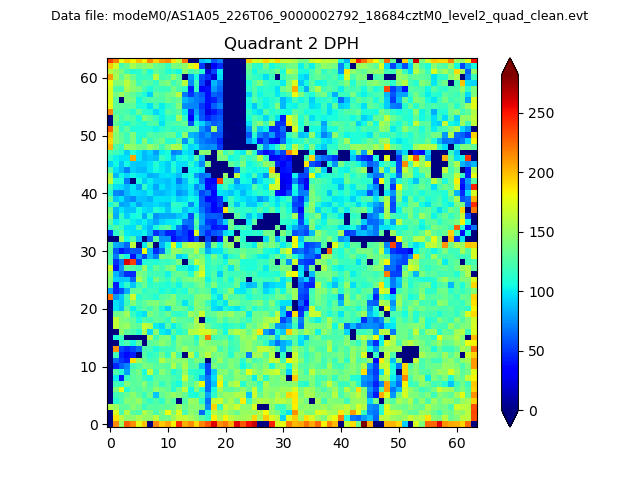
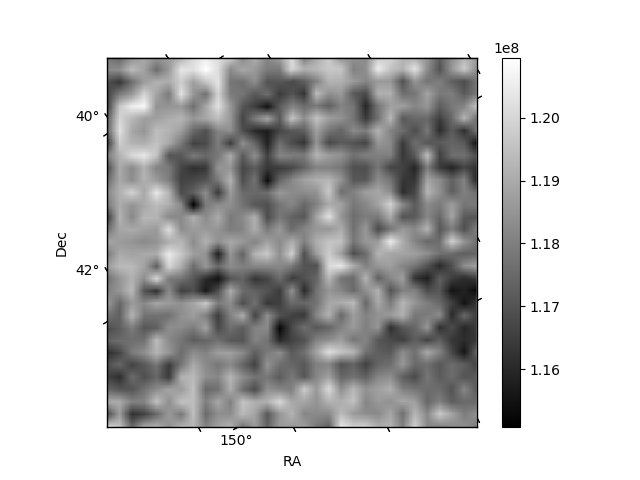
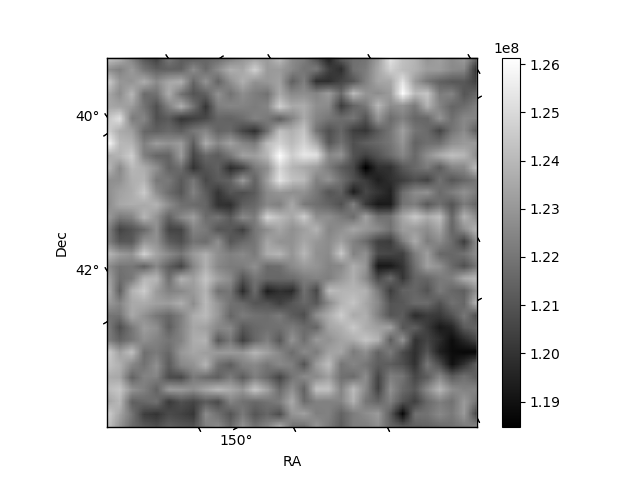
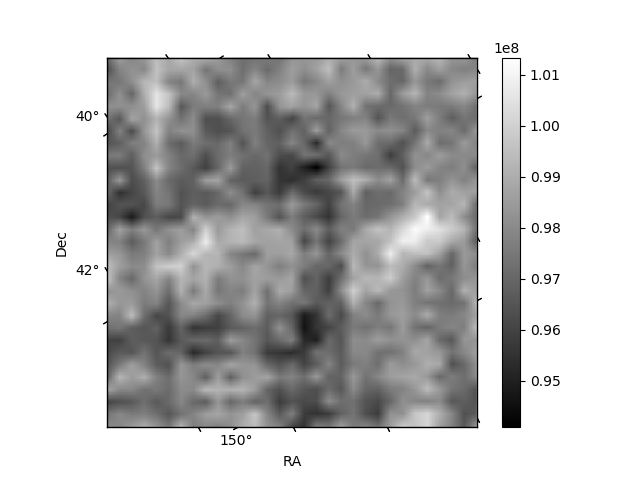
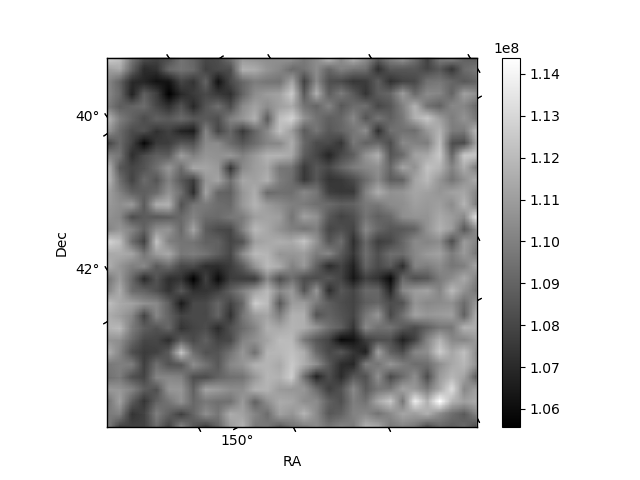
Histogram calculated using DETX and DETY for each event in the final _common_clean file
| Quadrant A | 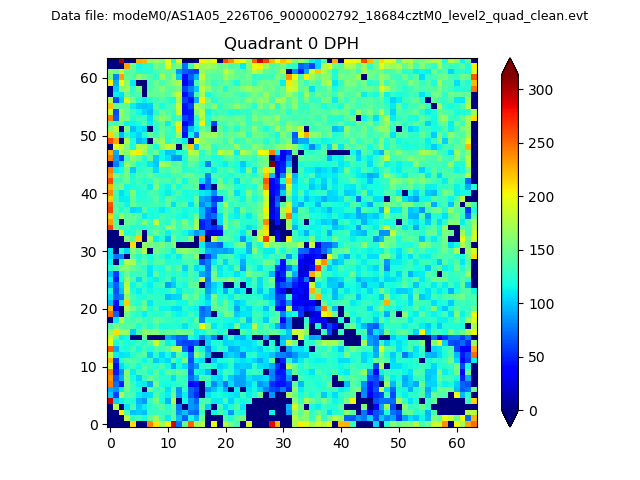 |
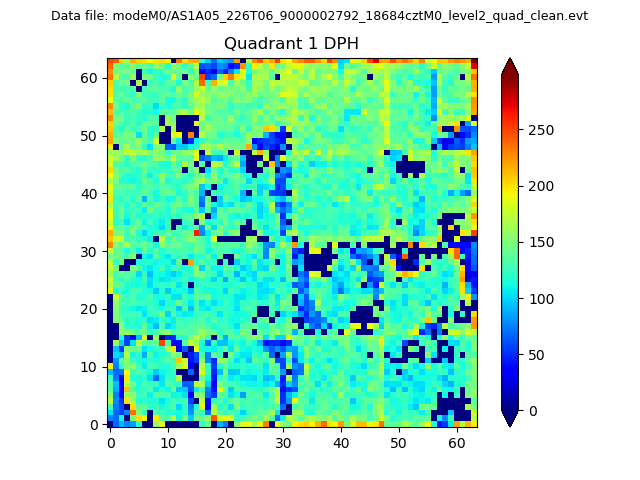 |
Quadrant B |
|---|---|---|---|
| Quadrant D | 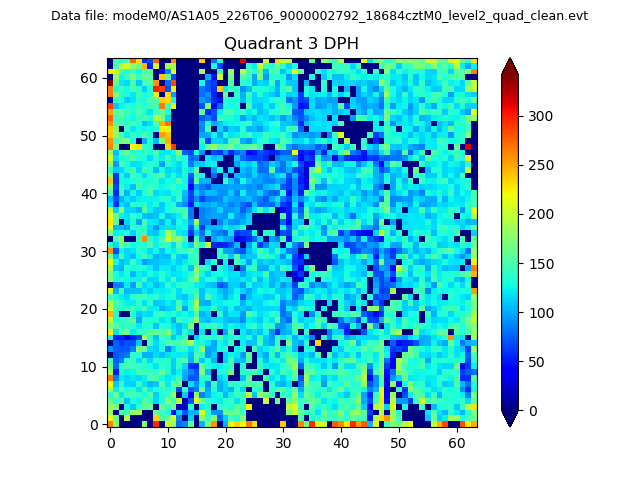 |
 |
Quadrant C |
| Plot type | Count rate plots | Images |
|---|---|---|
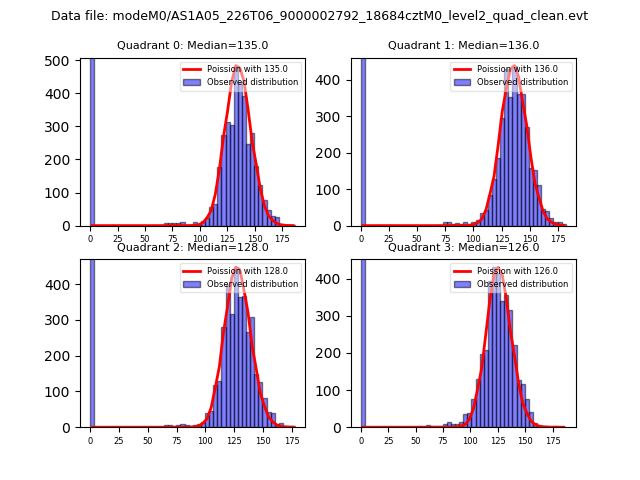
| Comparison with Poisson distribution Blue bars denote a histogram of data divided into 1 sec bins. Red curve is a Poisson curve with rate = median count rate of data. |
 |
 |
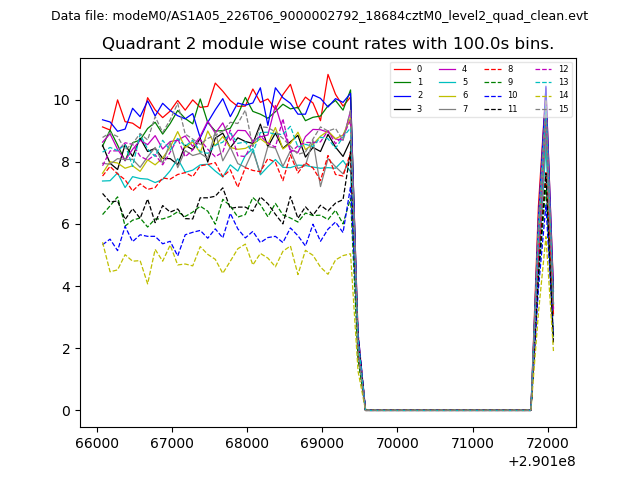
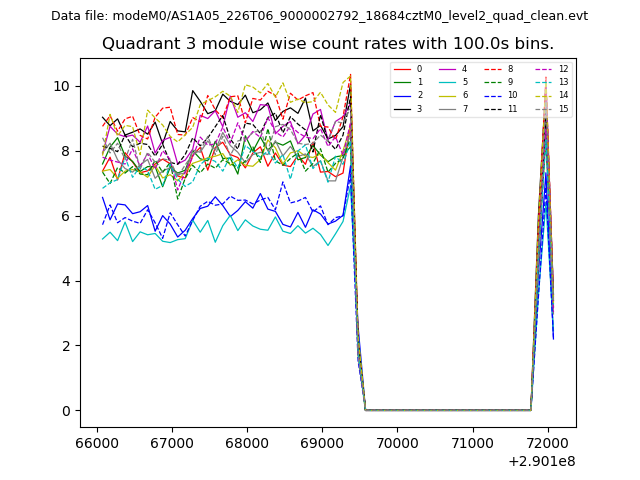
| Quadrant-wise count rates Data is divided into 100 sec bins |
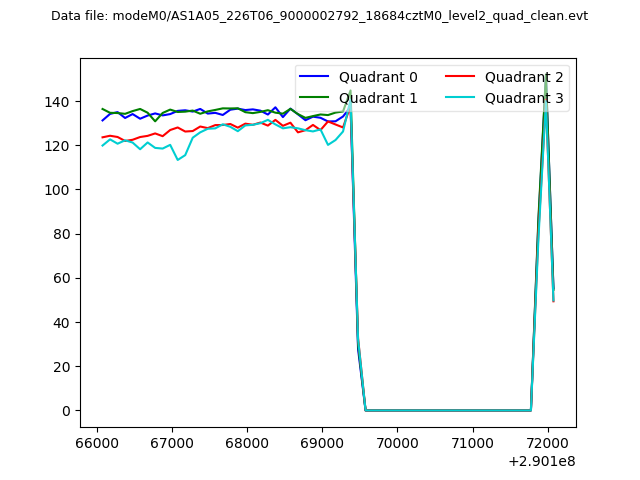 |
|
| Module-wise count rates for Quadrant A Data is divided into 100 sec bins |
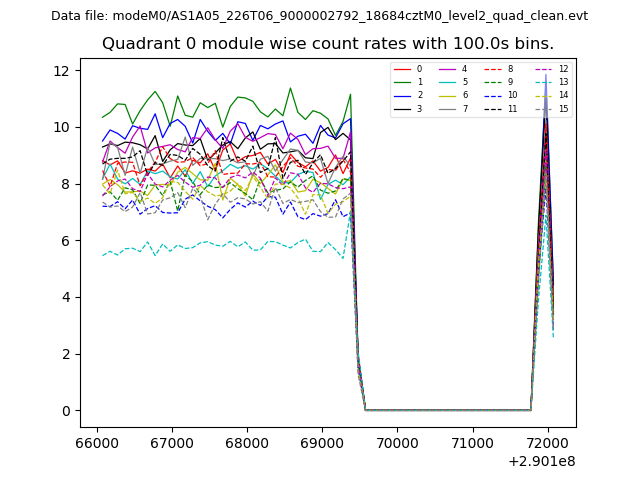 |
 |
| Module-wise count rates for Quadrant B Data is divided into 100 sec bins |
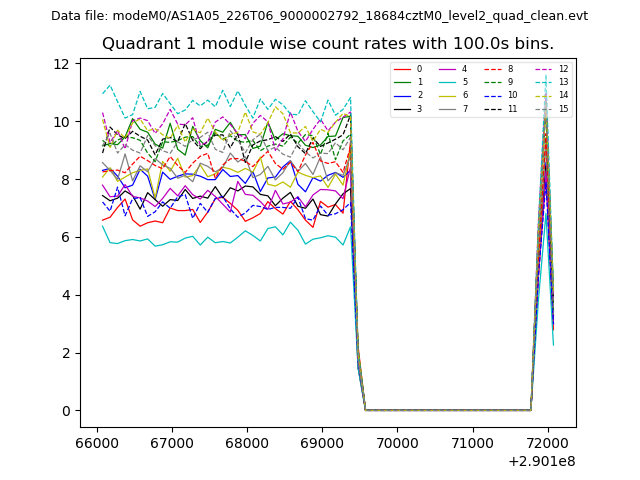 |
 |
| Module-wise count rates for Quadrant C Data is divided into 100 sec bins |
 |
 |
| Module-wise count rates for Quadrant D Data is divided into 100 sec bins |
 |
 |
| Parameter | Plot |
|---|---|
| CZT HV Monitor | 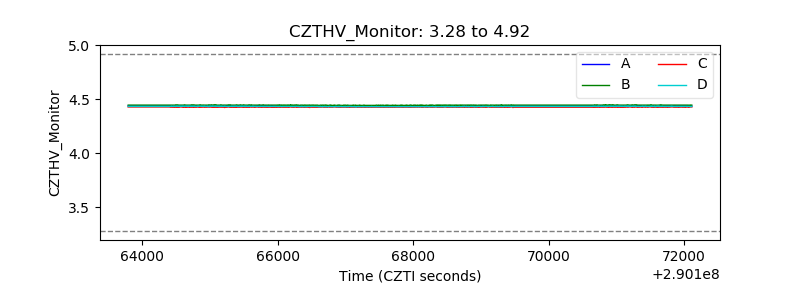 |
| D_VDD | 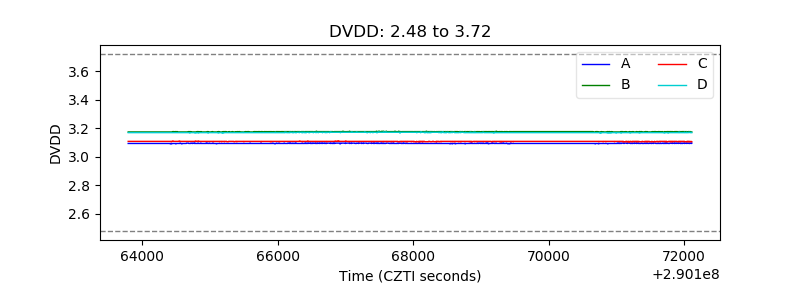 |
| Temperature 1 | 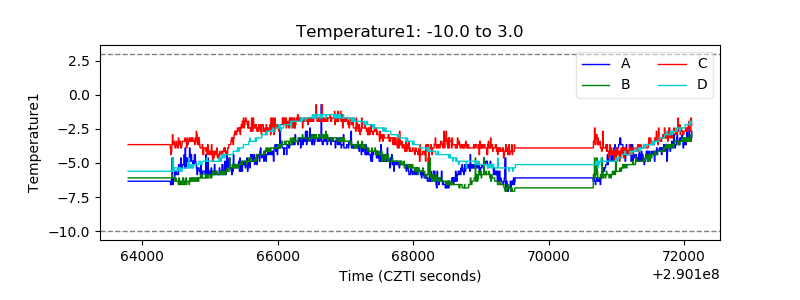 |
| Veto HV Monitor | 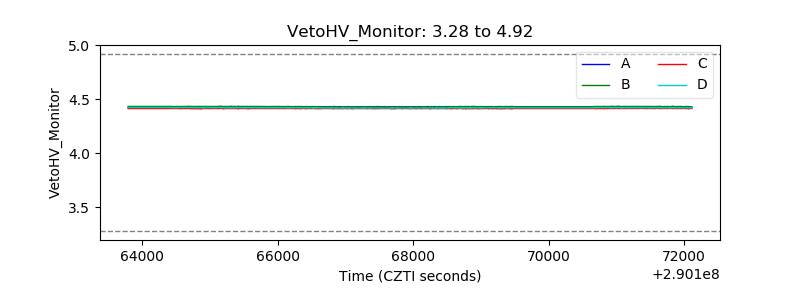 |
| Veto LLD | 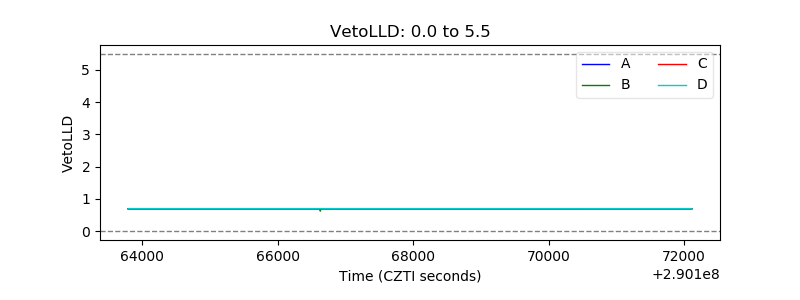 |
| Alpha Counter | 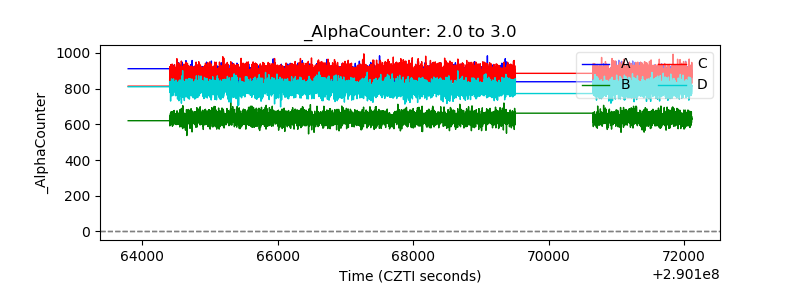 |
| _CPM_Rate | 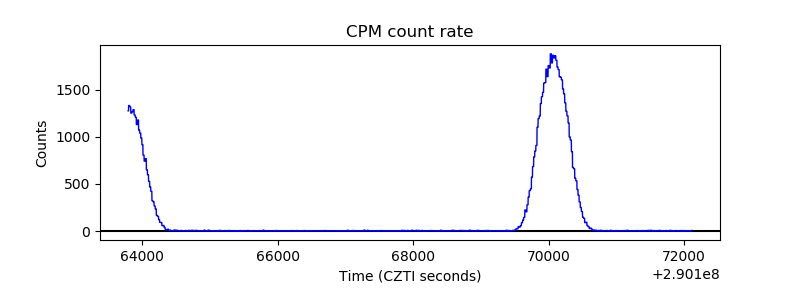 |
| CZT Counter | 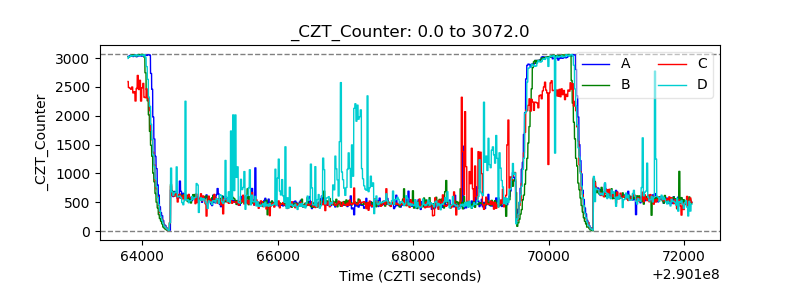 |
| +2.5 Volts monitor | 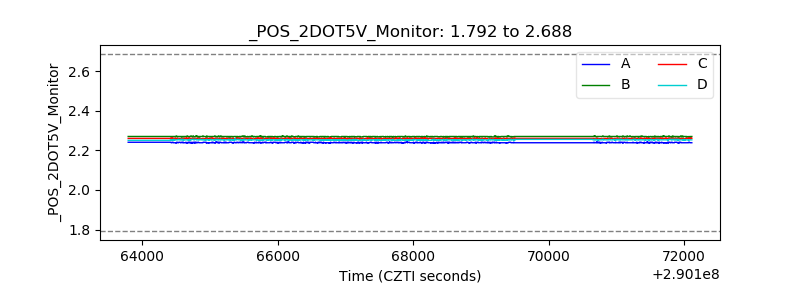 |
| +5 Volts monitor | 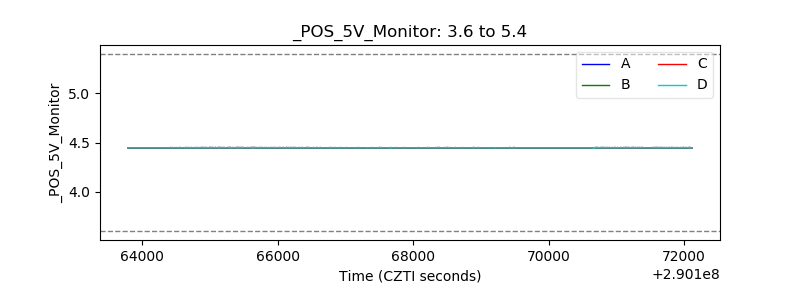 |
| _ROLL_ROT | 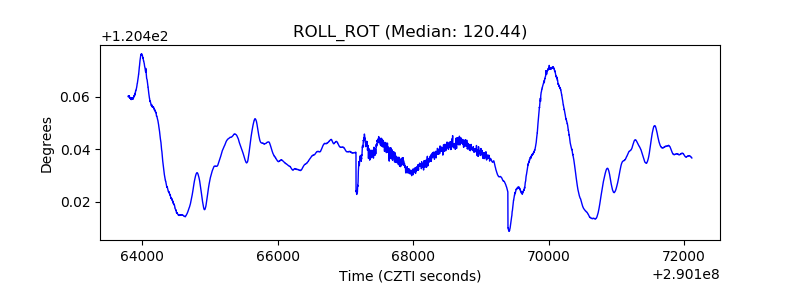 |
| _Roll_DEC | 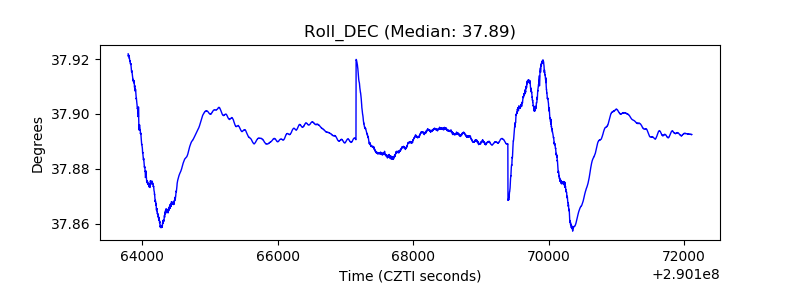 |
| _Roll_RA | 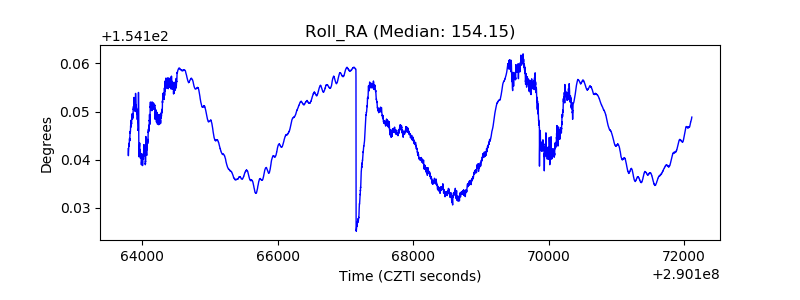 |
| Veto Counter |  |