| Param | Original file | Final file |
|---|---|---|
| Filename | modeM0/AS1A05_226T06_9000002792_18685cztM0_level2.evt | modeM0/AS1A05_226T06_9000002792_18685cztM0_level2_quad_clean.evt |
| Size (bytes) | 545,806,080 | 97,369,920 |
| Size | 520.5 MB | 92.9 MB |
| Events in quadrant A | 3,644,809 | 642,580 |
| Events in quadrant B | 3,641,236 | 646,056 |
| Events in quadrant C | 3,604,120 | 610,632 |
| Events in quadrant D | 5,189,809 | 586,978 |
| Mode M9 | |||
|---|---|---|---|
| Quadrant | BADHDUFLAG | Total packets | Discarded packets |
| A | 0 | 24 | 0 |
| B | 0 | 24 | 0 |
| C | 0 | 24 | 0 |
| D | 0 | 24 | 0 |
| Mode SS | |||
|---|---|---|---|
| Quadrant | BADHDUFLAG | Total packets | Discarded packets |
| A | 0 | 138 | 0 |
| B | 0 | 138 | 0 |
| C | 0 | 138 | 0 |
| D | 0 | 138 | 0 |
| Mode M0 | |||
|---|---|---|---|
| Quadrant | BADHDUFLAG | Total packets | Discarded packets |
| A | 0 | 15085 | 2 |
| B | 0 | 15016 | 2 |
| C | 0 | 14781 | 2 |
| D | 0 | 19742 | 2 |
| Quadrant | Total seconds | Saturated seconds | Saturation percentage |
|---|---|---|---|
| A | 6630 | 144 | 2.171946% |
| B | 6631 | 153 | 2.307344% |
| C | 6630 | 181 | 2.730015% |
| D | 6630 | 340 | 5.128205% |
Noise dominated data is calculated using 1-second bins in cleaned event files. If a bin has >2000 counts, and if more than 50% of those come from <1% of pixels, then it is considered to be noise-dominated and hence unusable.
| Quadrant | # 1 sec bins | Bins with >0 counts | Bins with >2000 counts | High rate bins dominated by noise | Noise dominated (total time) | Noise dominated (detector-on time) | Marked lightcurve |
|---|---|---|---|---|---|---|---|
| A | 9025 | 6630 | 1 | 1 | 0.01% | 0.02% | 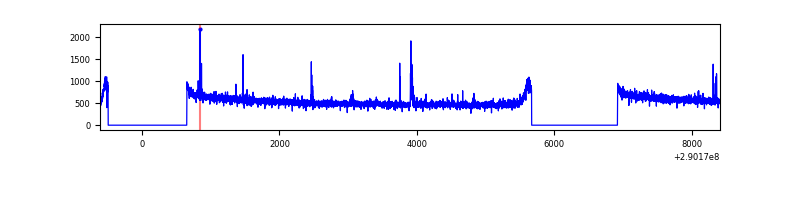 |
| B | 9026 | 6631 | 5 | 5 | 0.06% | 0.08% | 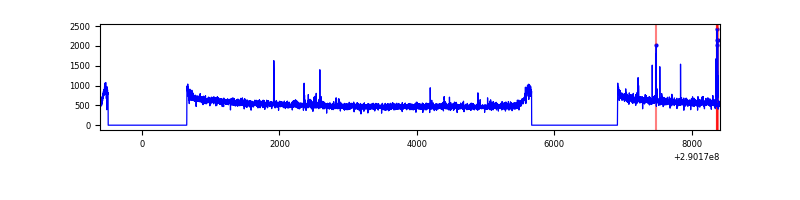 |
| C | 9025 | 6630 | 2 | 2 | 0.02% | 0.03% | 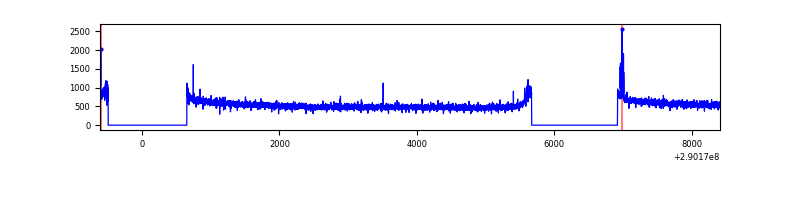 |
| D | 9025 | 6630 | 254 | 254 | 2.81% | 3.83% | 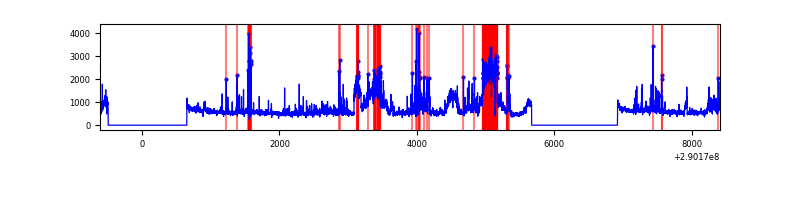 |
Top three noisy pixels from each quadrant. If the there are fewer than three noisy pixels in the level2.evt file, extra rows are filled as -1
| Pixel properties | Quadrant properties | ||||||
|---|---|---|---|---|---|---|---|
| Quadrant | DetID | PixID | Counts | Sigma | Mean | Median | Sigma |
| A | 6 | 16 | 48586 | 257.54 | 932 | 916 | 185.1 |
| A | 13 | 254 | 10624 | 52.45 | 932 | 916 | 185.1 |
| A | 0 | 226 | 8246 | 39.6 | 932 | 916 | 185.1 |
| B | 10 | 245 | 20874 | 115.95 | 913 | 893 | 172.3 |
| B | 12 | 111 | 19954 | 110.61 | 913 | 893 | 172.3 |
| B | 10 | 247 | 19122 | 105.78 | 913 | 893 | 172.3 |
| C | 14 | 238 | 138597 | 680.68 | 875 | 884 | 202.3 |
| C | 9 | 54 | 49217 | 238.9 | 875 | 884 | 202.3 |
| C | 13 | 61 | 6069 | 25.63 | 875 | 884 | 202.3 |
| D | 7 | 238 | 1346831 | 6355.14 | 888 | 865 | 211.8 |
| D | 1 | 52 | 357418 | 1683.51 | 888 | 865 | 211.8 |
| D | 7 | 96 | 102723 | 480.94 | 888 | 865 | 211.8 |
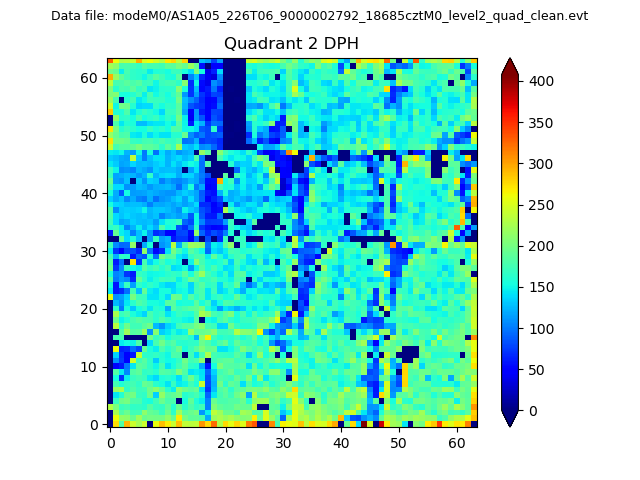
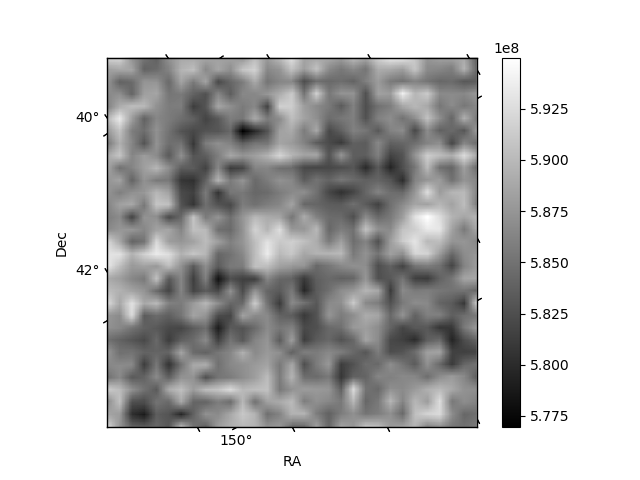
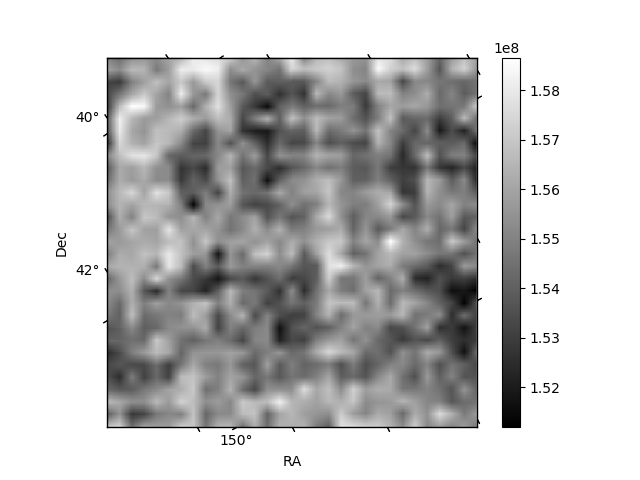
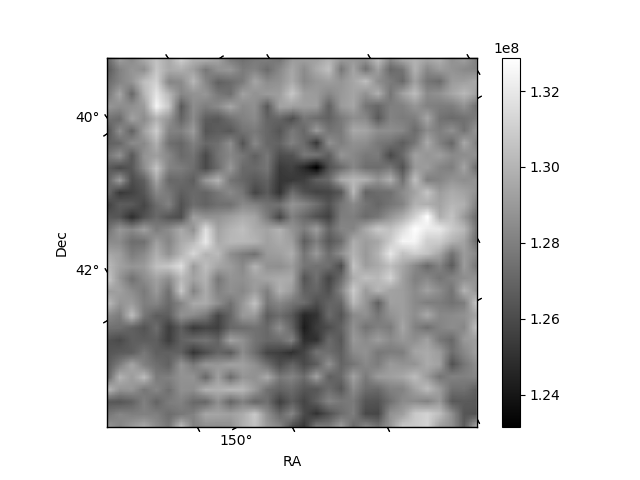
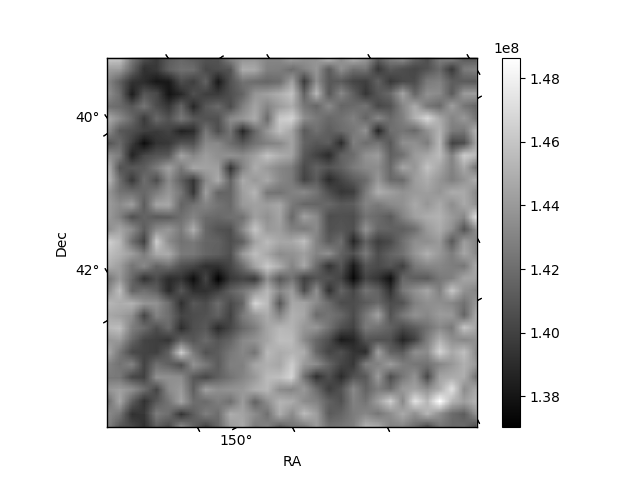
Histogram calculated using DETX and DETY for each event in the final _common_clean file
| Quadrant A | 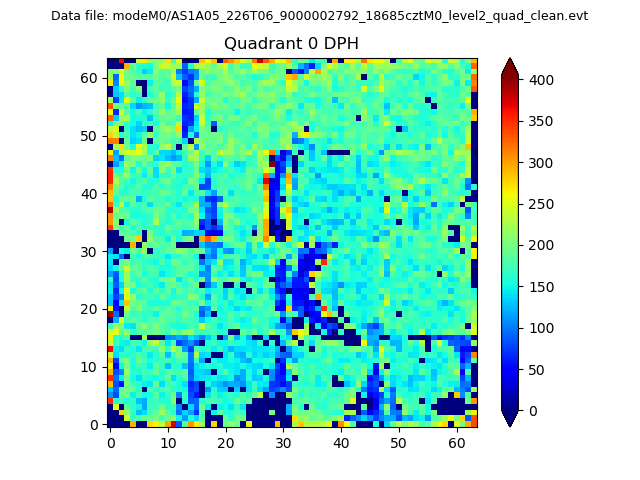 |
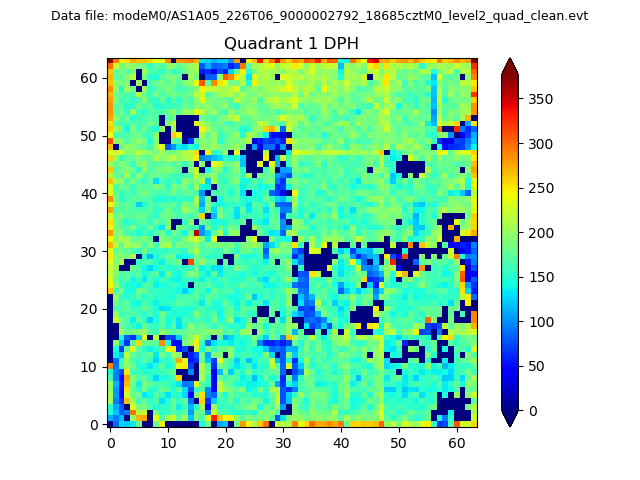 |
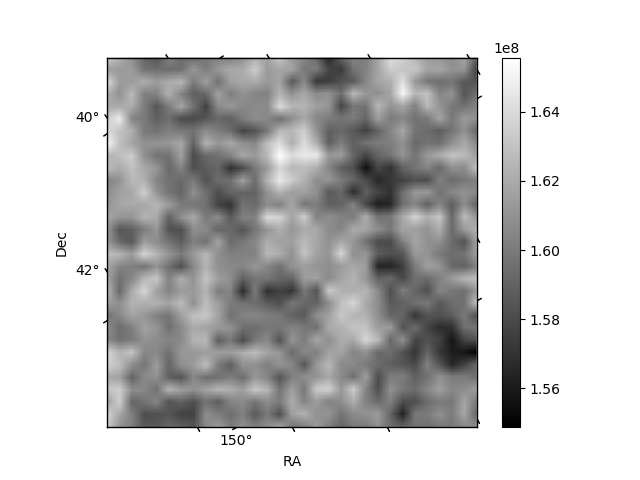
Quadrant B |
|---|---|---|---|
| Quadrant D | 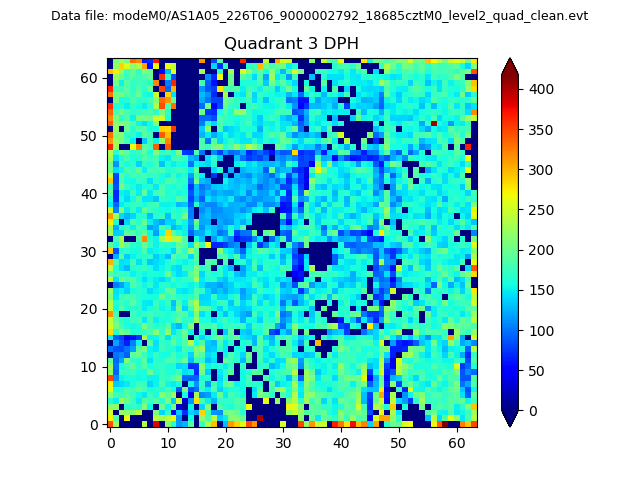 |
 |
Quadrant C |
| Plot type | Count rate plots | Images |
|---|---|---|
| Comparison with Poisson distribution Blue bars denote a histogram of data divided into 1 sec bins. Red curve is a Poisson curve with rate = median count rate of data. |
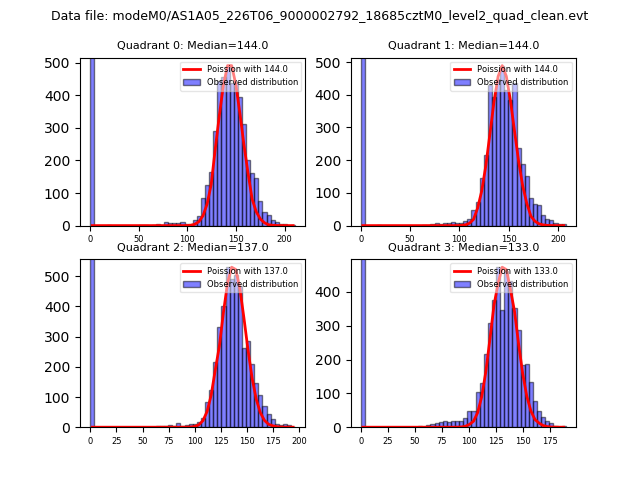 |
 |
| Quadrant-wise count rates Data is divided into 100 sec bins |
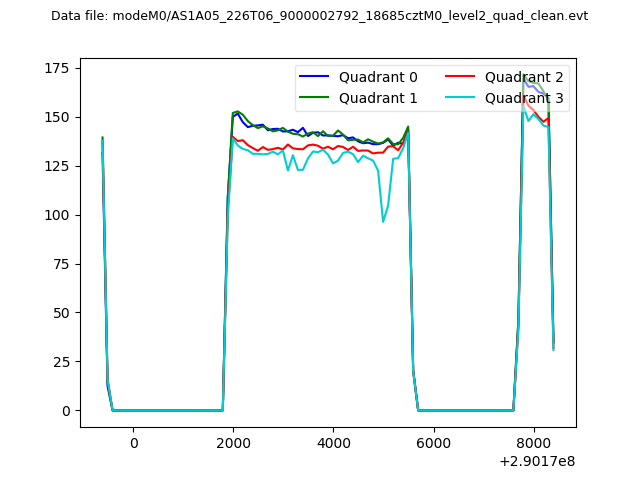 |
|
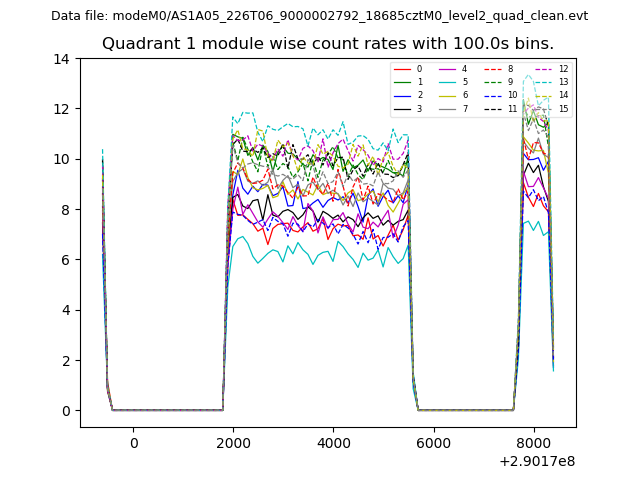
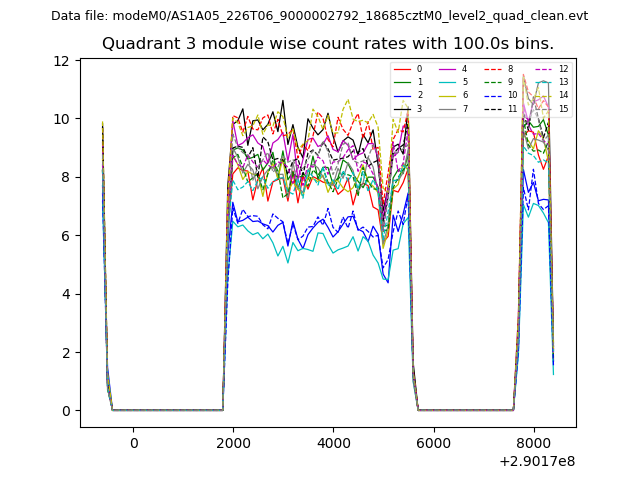
| Module-wise count rates for Quadrant A Data is divided into 100 sec bins |
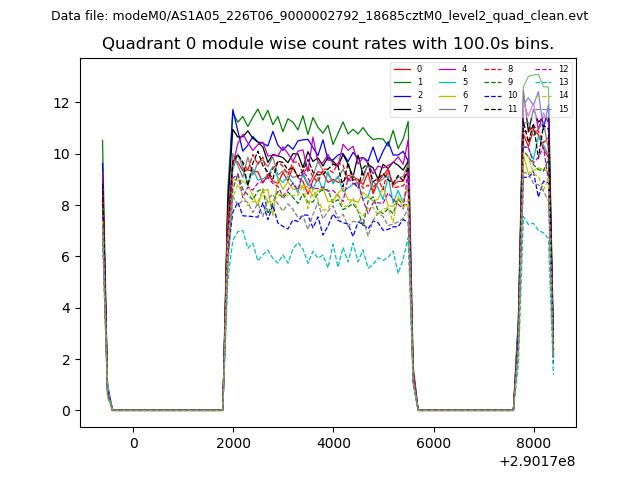 |
 |
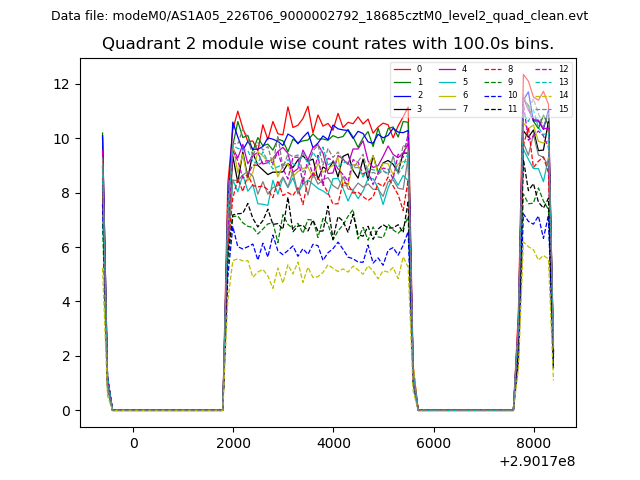
| Module-wise count rates for Quadrant B Data is divided into 100 sec bins |
 |
 |
| Module-wise count rates for Quadrant C Data is divided into 100 sec bins |
 |
 |
| Module-wise count rates for Quadrant D Data is divided into 100 sec bins |
 |
 |
| Parameter | Plot |
|---|---|
| CZT HV Monitor | 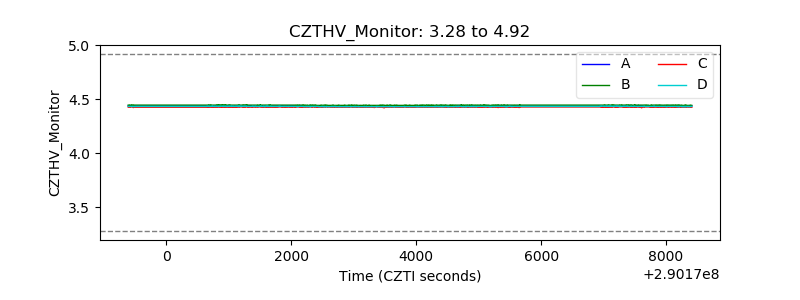 |
| D_VDD | 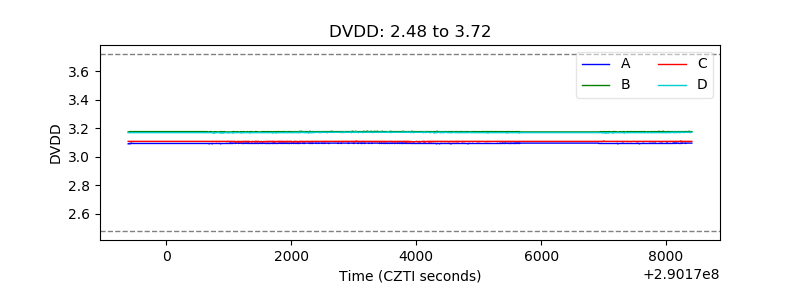 |
| Temperature 1 | 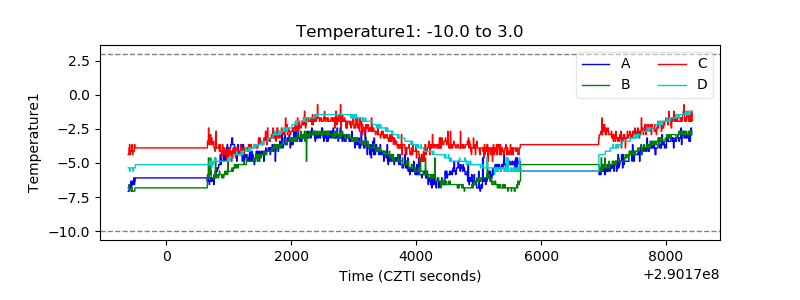 |
| Veto HV Monitor |  |
| Veto LLD | 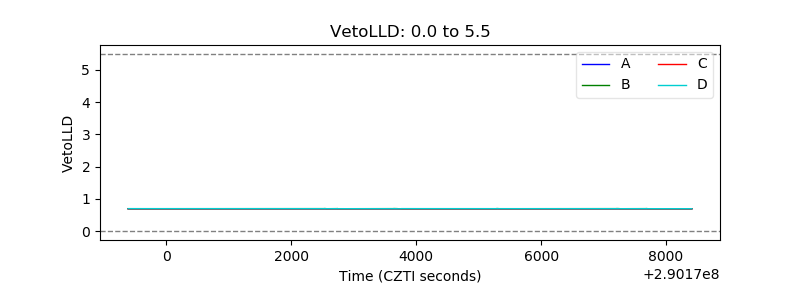 |
| Alpha Counter | 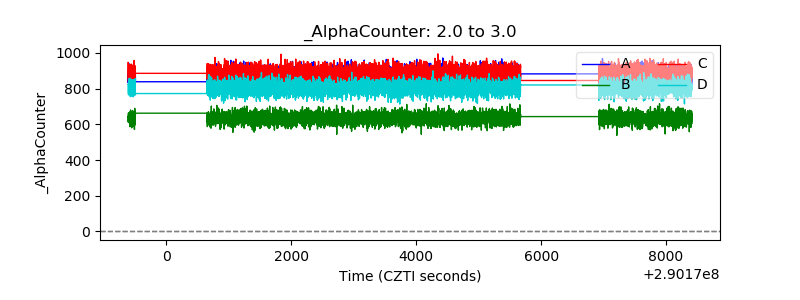 |
| _CPM_Rate | 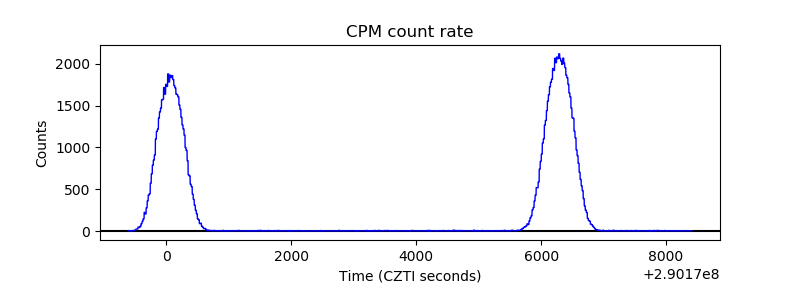 |
| CZT Counter |  |
| +2.5 Volts monitor | 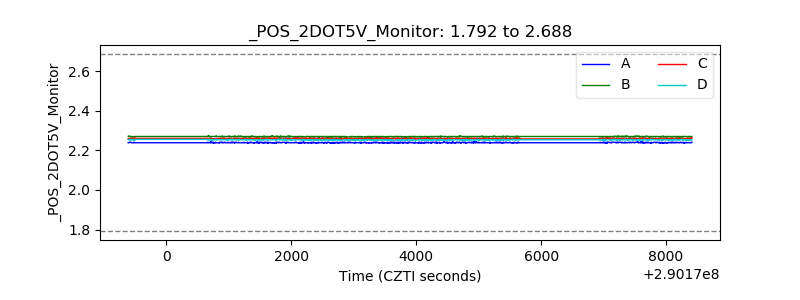 |
| +5 Volts monitor |  |
| _ROLL_ROT | 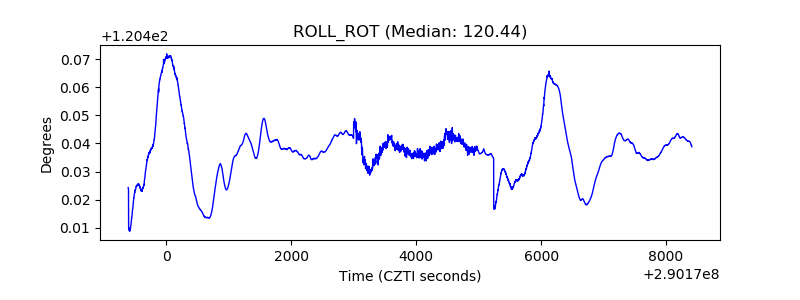 |
| _Roll_DEC | 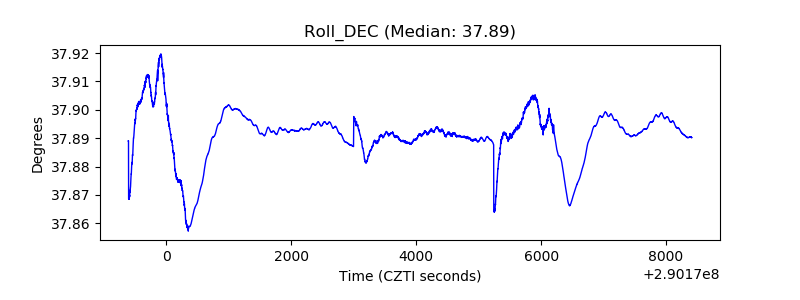 |
| _Roll_RA | 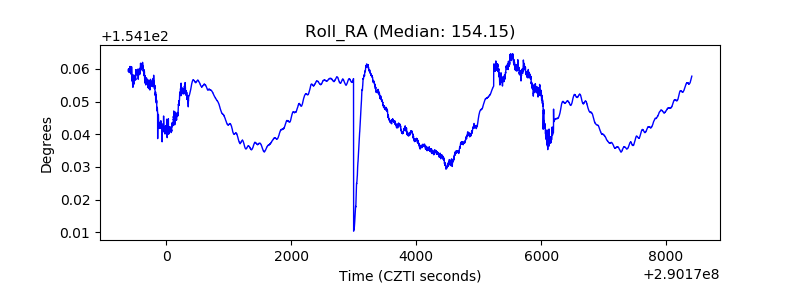 |
| Veto Counter | 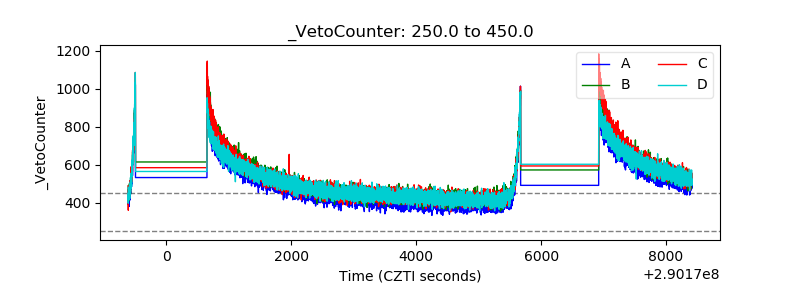 |