| Param | Original file | Final file |
|---|---|---|
| Filename | modeM0/AS1A05_226T06_9000002792_18686cztM0_level2.evt | modeM0/AS1A05_226T06_9000002792_18686cztM0_level2_quad_clean.evt |
| Size (bytes) | 169,110,720 | 35,588,160 |
| Size | 161.3 MB | 33.9 MB |
| Events in quadrant A | 1,159,478 | 241,343 |
| Events in quadrant B | 1,181,284 | 241,485 |
| Events in quadrant C | 1,121,993 | 225,422 |
| Events in quadrant D | 1,515,138 | 218,025 |
| Mode SS | |||
|---|---|---|---|
| Quadrant | BADHDUFLAG | Total packets | Discarded packets |
| A | 0 | 42 | 0 |
| B | 0 | 42 | 0 |
| C | 0 | 42 | 0 |
| D | 0 | 42 | 0 |
| Mode M0 | |||
|---|---|---|---|
| Quadrant | BADHDUFLAG | Total packets | Discarded packets |
| A | 0 | 4709 | 0 |
| B | 0 | 4779 | 0 |
| C | 0 | 4522 | 0 |
| D | 0 | 5847 | 0 |
| Quadrant | Total seconds | Saturated seconds | Saturation percentage |
|---|---|---|---|
| A | 2079 | 2 | 0.096200% |
| B | 2080 | 9 | 0.432692% |
| C | 2080 | 11 | 0.528846% |
| D | 2080 | 63 | 3.028846% |
Noise dominated data is calculated using 1-second bins in cleaned event files. If a bin has >2000 counts, and if more than 50% of those come from <1% of pixels, then it is considered to be noise-dominated and hence unusable.
| Quadrant | # 1 sec bins | Bins with >0 counts | Bins with >2000 counts | High rate bins dominated by noise | Noise dominated (total time) | Noise dominated (detector-on time) | Marked lightcurve |
|---|---|---|---|---|---|---|---|
| A | 2079 | 2079 | 0 | 0 | 0.00% | 0.00% | 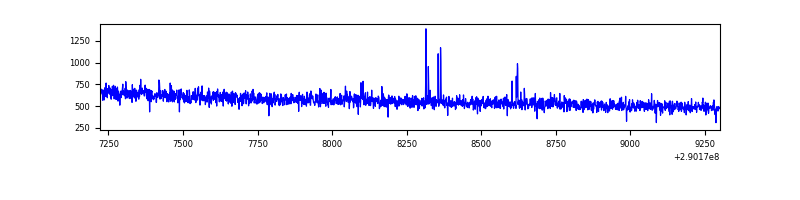 |
| B | 2080 | 2080 | 5 | 5 | 0.24% | 0.24% | 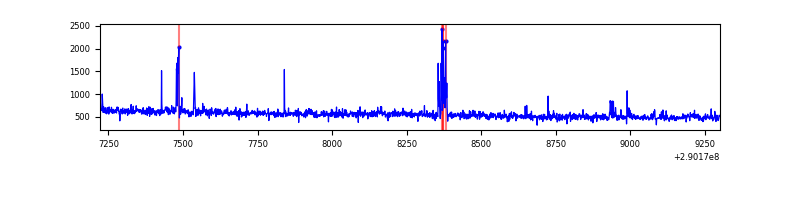 |
| C | 2080 | 2080 | 0 | 0 | 0.00% | 0.00% | 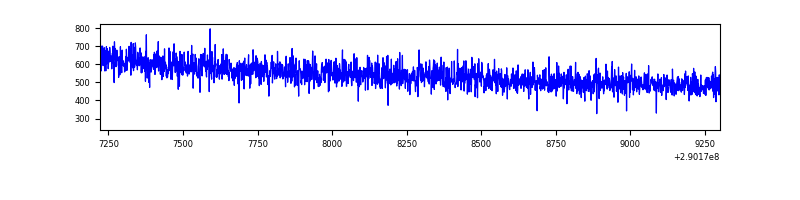 |
| D | 2080 | 2080 | 44 | 44 | 2.12% | 2.12% | 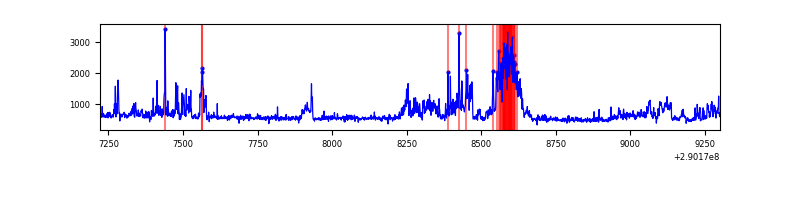 |
Top three noisy pixels from each quadrant. If the there are fewer than three noisy pixels in the level2.evt file, extra rows are filled as -1
| Pixel properties | Quadrant properties | ||||||
|---|---|---|---|---|---|---|---|
| Quadrant | DetID | PixID | Counts | Sigma | Mean | Median | Sigma |
| A | 6 | 16 | 8486 | 135.59 | 296 | 292 | 60.4 |
| A | 3 | 1 | 6477 | 102.35 | 296 | 292 | 60.4 |
| A | 13 | 254 | 3212 | 48.32 | 296 | 292 | 60.4 |
| B | 10 | 245 | 21329 | 381.62 | 287 | 281 | 55.2 |
| B | 10 | 247 | 11617 | 205.53 | 287 | 281 | 55.2 |
| B | 12 | 111 | 5978 | 103.29 | 287 | 281 | 55.2 |
| C | 14 | 238 | 45342 | 698.71 | 276 | 278 | 64.5 |
| C | 13 | 61 | 1956 | 26.02 | 276 | 278 | 64.5 |
| C | 14 | 111 | 713 | 6.74 | 276 | 278 | 64.5 |
| D | 7 | 238 | 325445 | 4712.68 | 282 | 274 | 69.0 |
| D | 7 | 96 | 113977 | 1647.89 | 282 | 274 | 69.0 |
| D | 2 | 234 | 8782 | 123.31 | 282 | 274 | 69.0 |
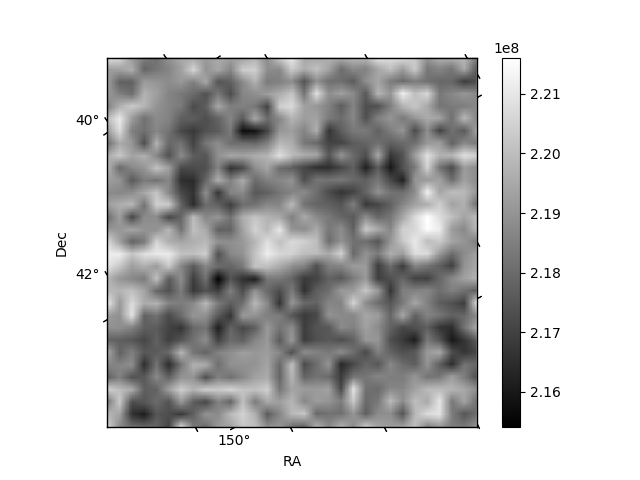
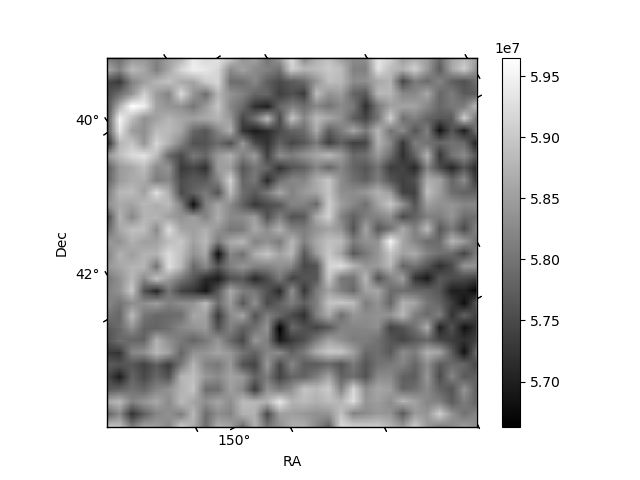
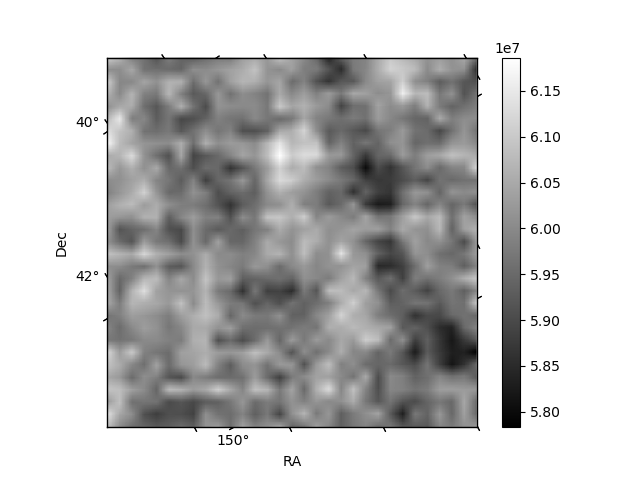
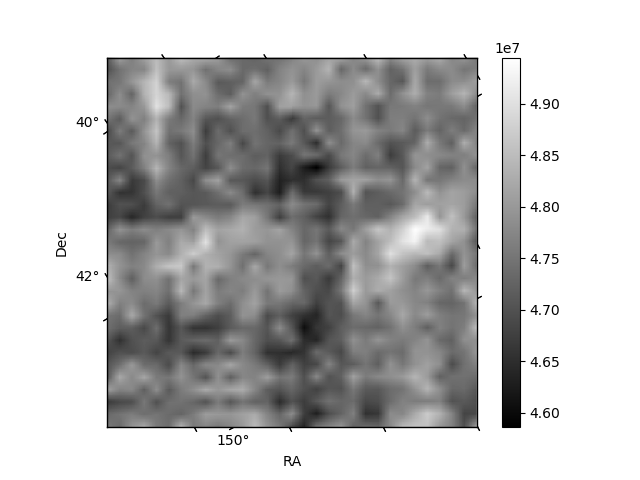
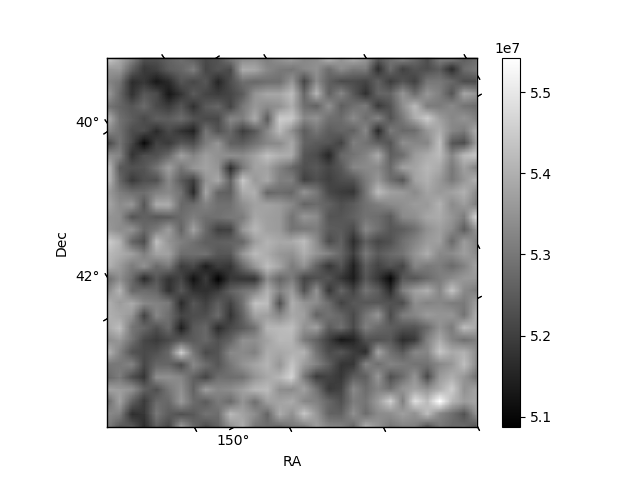
Histogram calculated using DETX and DETY for each event in the final _common_clean file
| Quadrant A |  |
 |
Quadrant B |
|---|---|---|---|
| Quadrant D |  |
 |
Quadrant C |
| Plot type | Count rate plots | Images |
|---|---|---|
| Comparison with Poisson distribution Blue bars denote a histogram of data divided into 1 sec bins. Red curve is a Poisson curve with rate = median count rate of data. |
 |
 |
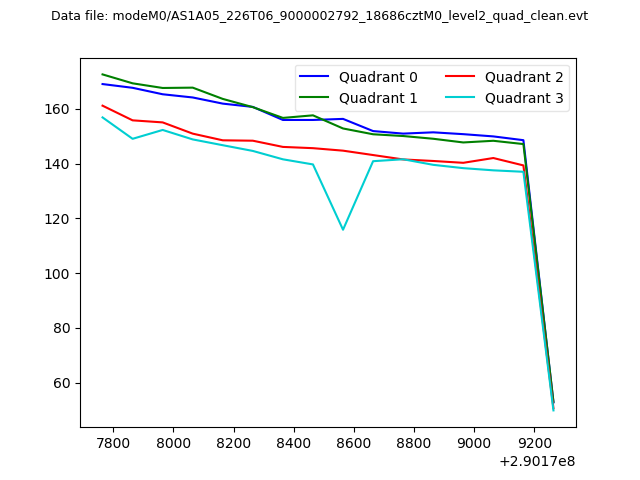
| Quadrant-wise count rates Data is divided into 100 sec bins |
 |
|
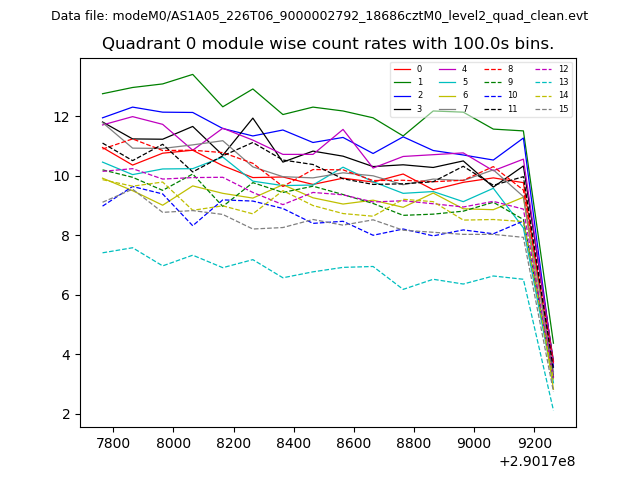
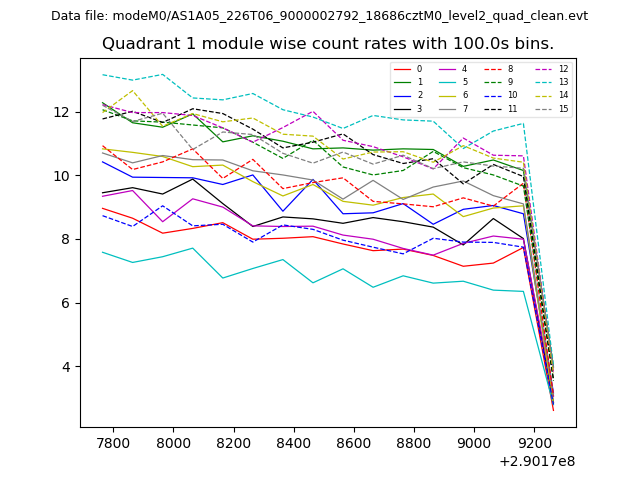
| Module-wise count rates for Quadrant A Data is divided into 100 sec bins |
 |
 |
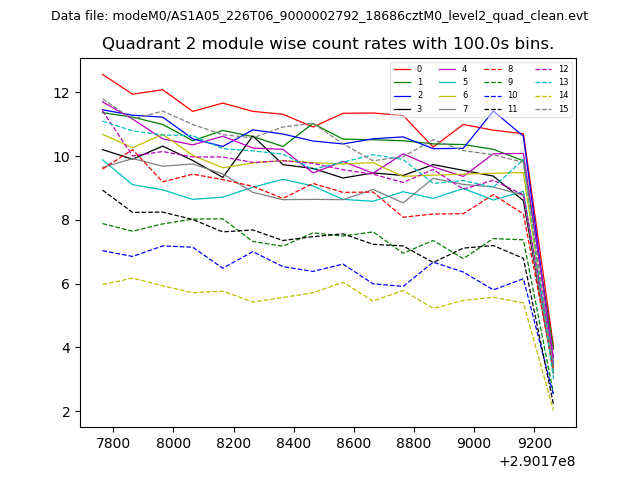
| Module-wise count rates for Quadrant B Data is divided into 100 sec bins |
 |
 |
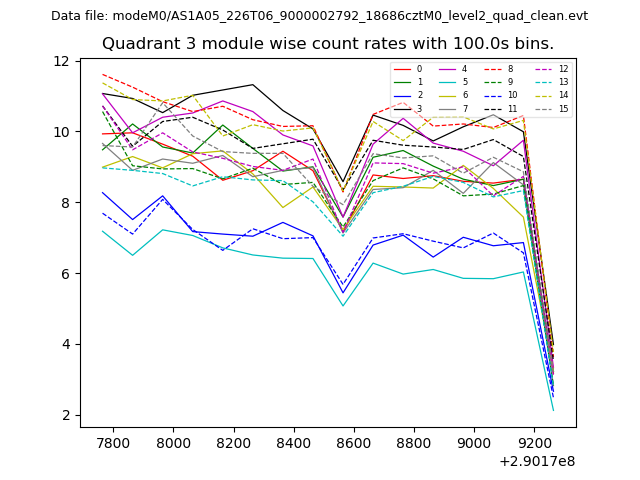
| Module-wise count rates for Quadrant C Data is divided into 100 sec bins |
 |
 |
| Module-wise count rates for Quadrant D Data is divided into 100 sec bins |
 |
 |
| Parameter | Plot |
|---|---|
| CZT HV Monitor | 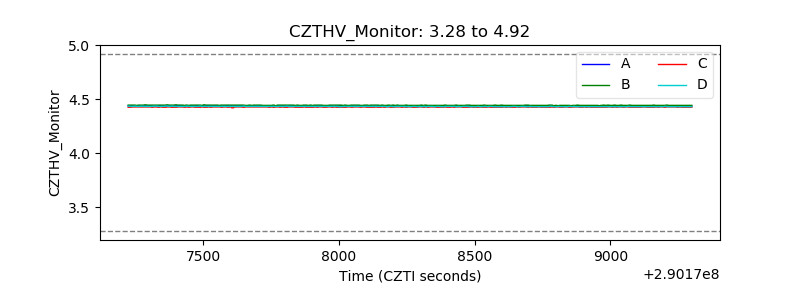 |
| D_VDD | 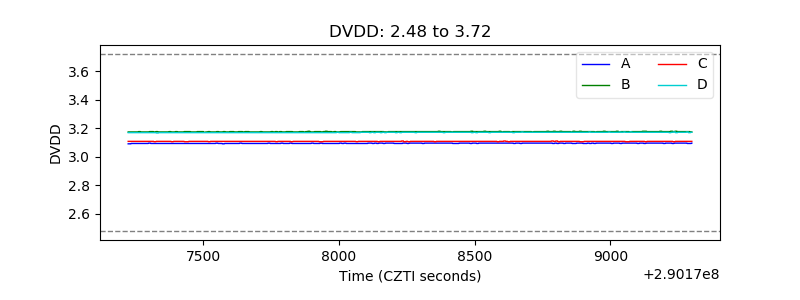 |
| Temperature 1 | 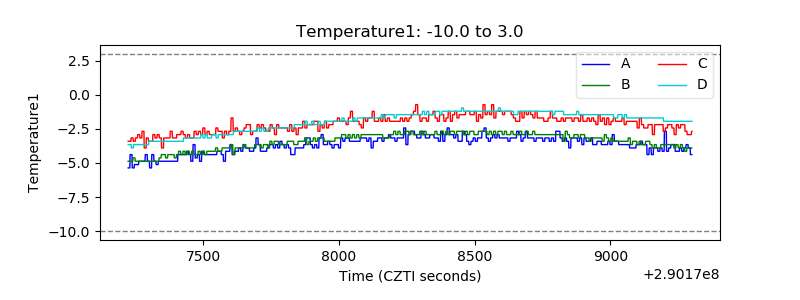 |
| Veto HV Monitor |  |
| Veto LLD | 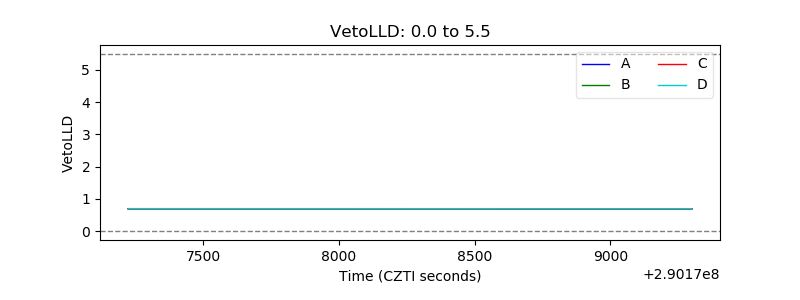 |
| Alpha Counter | 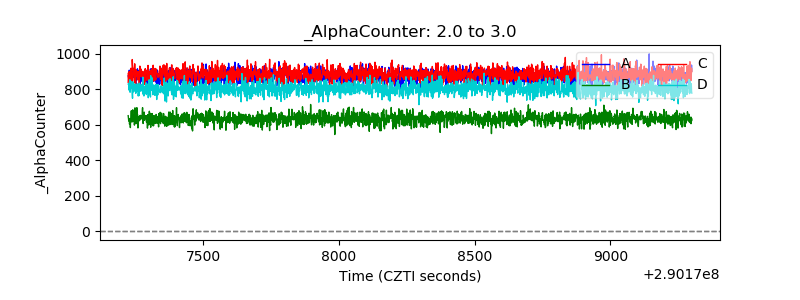 |
| _CPM_Rate | 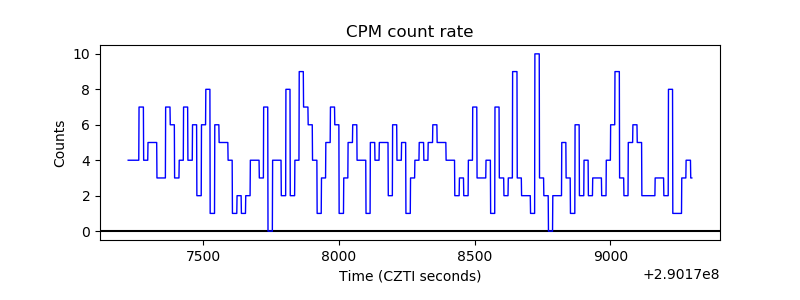 |
| CZT Counter |  |
| +2.5 Volts monitor |  |
| +5 Volts monitor | 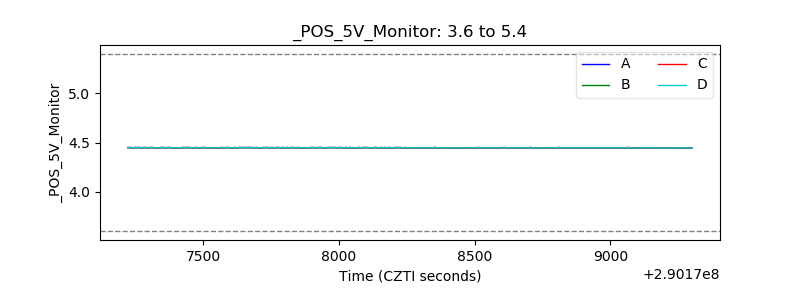 |
| _ROLL_ROT | 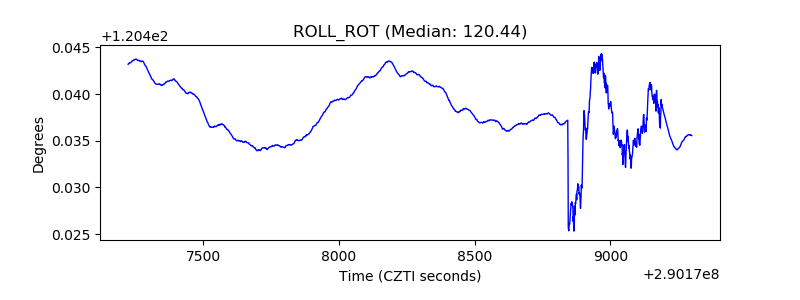 |
| _Roll_DEC |  |
| _Roll_RA | 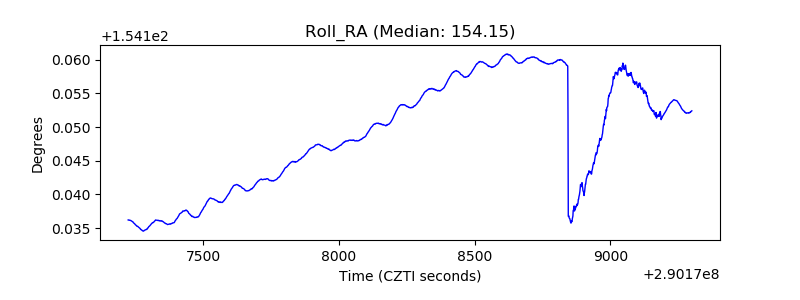 |
| Veto Counter | 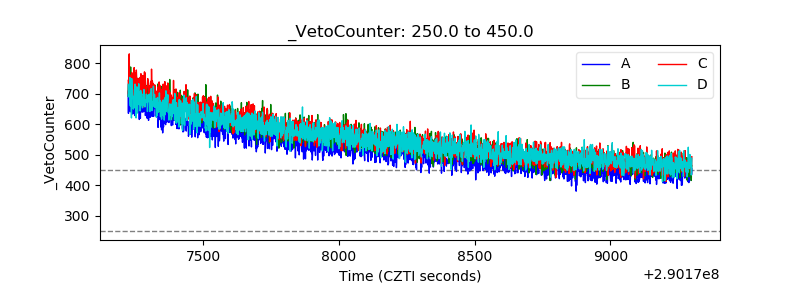 |