| Param | Original file | Final file |
|---|---|---|
| Filename | modeM0/AS1A05_165T07_9000002796_18702cztM0_level2.evt | modeM0/AS1A05_165T07_9000002796_18702cztM0_level2_quad_clean.evt |
| Size (bytes) | 699,442,560 | 89,550,720 |
| Size | 667.0 MB | 85.4 MB |
| Events in quadrant A | 3,878,020 | 604,041 |
| Events in quadrant B | 3,395,241 | 617,024 |
| Events in quadrant C | 4,404,692 | 578,692 |
| Events in quadrant D | 9,073,566 | 466,406 |
| Mode M9 | |||
|---|---|---|---|
| Quadrant | BADHDUFLAG | Total packets | Discarded packets |
| A | 0 | 24 | 0 |
| B | 0 | 25 | 0 |
| C | 0 | 25 | 0 |
| D | 0 | 25 | 0 |
| Mode M0 | |||
|---|---|---|---|
| Quadrant | BADHDUFLAG | Total packets | Discarded packets |
| A | 0 | 15756 | 2 |
| B | 0 | 14060 | 2 |
| C | 0 | 17431 | 4 |
| D | 0 | 31235 | 2 |
| Mode SS | |||
|---|---|---|---|
| Quadrant | BADHDUFLAG | Total packets | Discarded packets |
| A | 0 | 128 | 0 |
| B | 0 | 128 | 0 |
| C | 0 | 128 | 0 |
| D | 0 | 128 | 0 |
| Quadrant | Total seconds | Saturated seconds | Saturation percentage |
|---|---|---|---|
| A | 6382 | 305 | 4.779066% |
| B | 6382 | 117 | 1.833281% |
| C | 6381 | 208 | 3.259677% |
| D | 6381 | 2232 | 34.978843% |
Noise dominated data is calculated using 1-second bins in cleaned event files. If a bin has >2000 counts, and if more than 50% of those come from <1% of pixels, then it is considered to be noise-dominated and hence unusable.
| Quadrant | # 1 sec bins | Bins with >0 counts | Bins with >2000 counts | High rate bins dominated by noise | Noise dominated (total time) | Noise dominated (detector-on time) | Marked lightcurve |
|---|---|---|---|---|---|---|---|
| A | 7642 | 6383 | 102 | 102 | 1.33% | 1.60% | 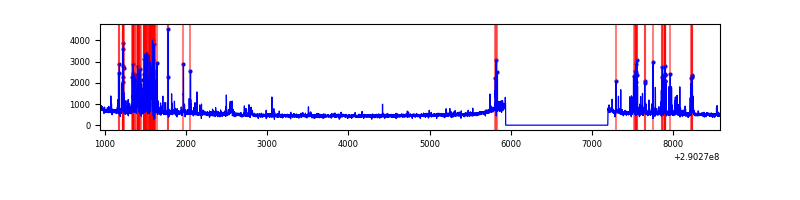 |
| B | 7642 | 6382 | 0 | 0 | 0.00% | 0.00% | 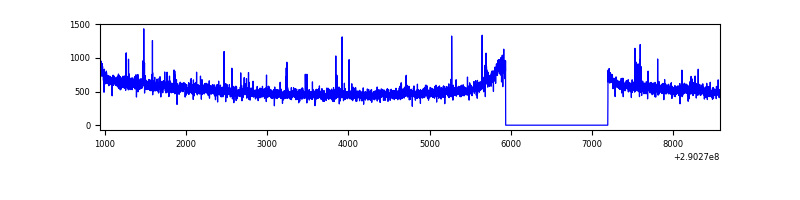 |
| C | 7641 | 6381 | 6 | 6 | 0.08% | 0.09% |  |
| D | 7641 | 6382 | 2229 | 2229 | 29.17% | 34.93% | 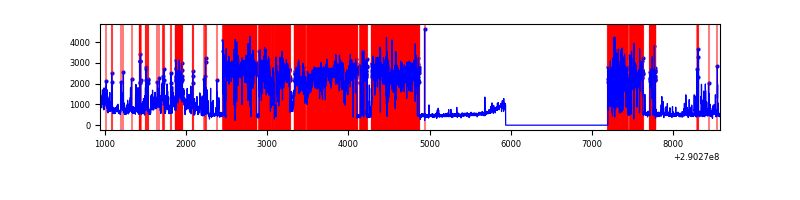 |
Top three noisy pixels from each quadrant. If the there are fewer than three noisy pixels in the level2.evt file, extra rows are filled as -1
| Pixel properties | Quadrant properties | ||||||
|---|---|---|---|---|---|---|---|
| Quadrant | DetID | PixID | Counts | Sigma | Mean | Median | Sigma |
| A | 0 | 13 | 585184 | 3453.63 | 847 | 833 | 169.2 |
| A | 9 | 143 | 20449 | 115.93 | 847 | 833 | 169.2 |
| A | 11 | 29 | 10639 | 57.96 | 847 | 833 | 169.2 |
| B | 12 | 111 | 18517 | 111.13 | 854 | 834 | 159.1 |
| B | 11 | 111 | 16129 | 96.12 | 854 | 834 | 159.1 |
| B | 0 | 197 | 15268 | 90.71 | 854 | 834 | 159.1 |
| C | 3 | 233 | 1061979 | 5721.77 | 809 | 818 | 185.5 |
| C | 14 | 238 | 128387 | 687.85 | 809 | 818 | 185.5 |
| C | 0 | 207 | 53140 | 282.12 | 809 | 818 | 185.5 |
| D | 1 | 52 | 5954475 | 33619.58 | 729 | 709 | 177.1 |
| D | 7 | 238 | 333365 | 1878.43 | 729 | 709 | 177.1 |
| D | 2 | 234 | 24181 | 132.54 | 729 | 709 | 177.1 |
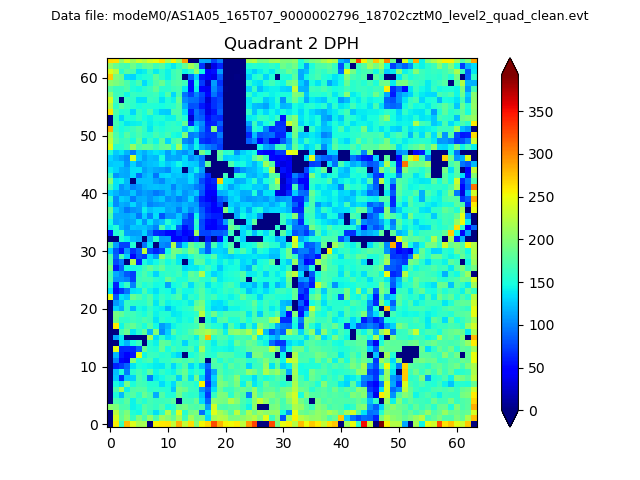
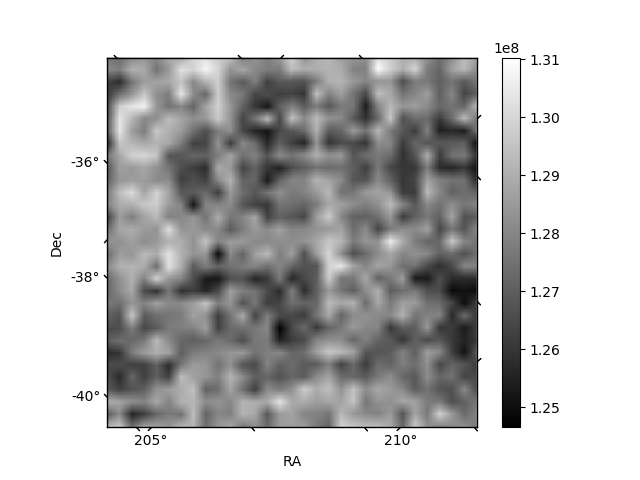
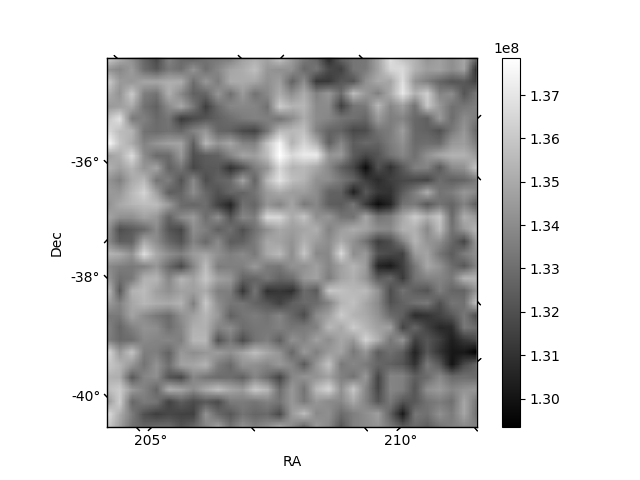
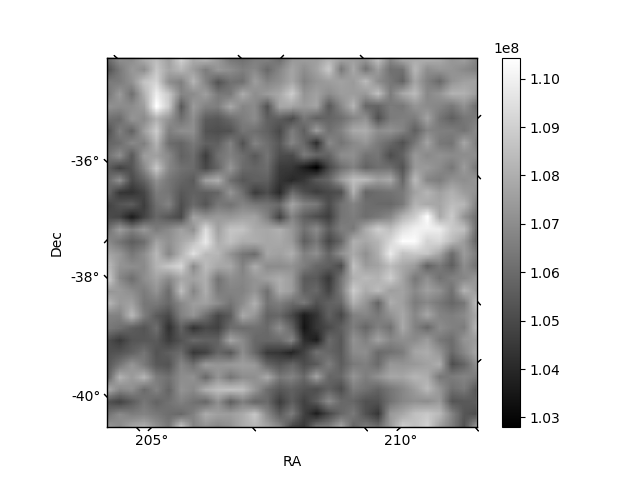
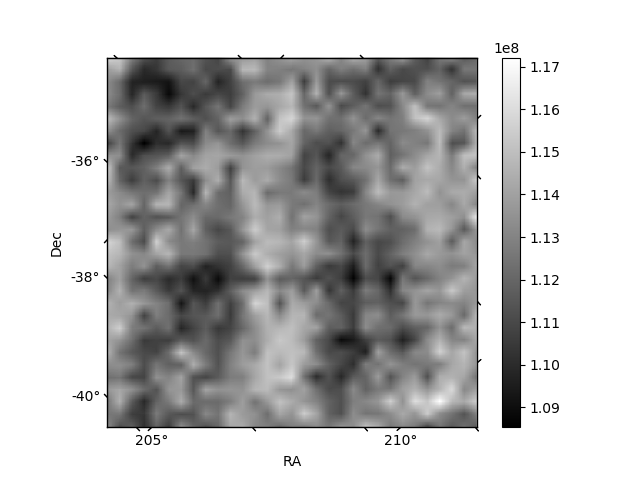
Histogram calculated using DETX and DETY for each event in the final _common_clean file
| Quadrant A | 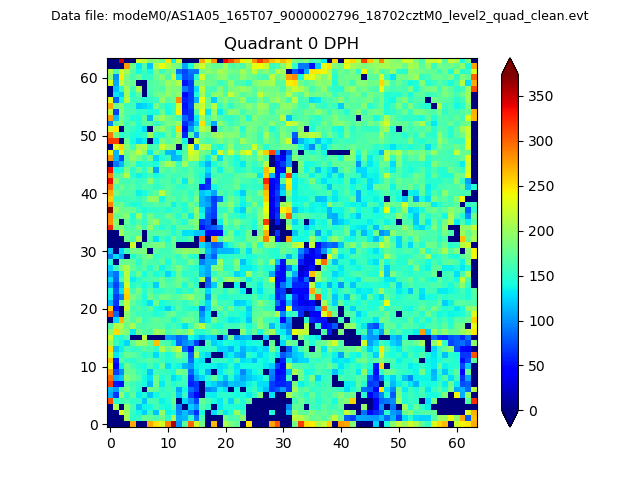 |
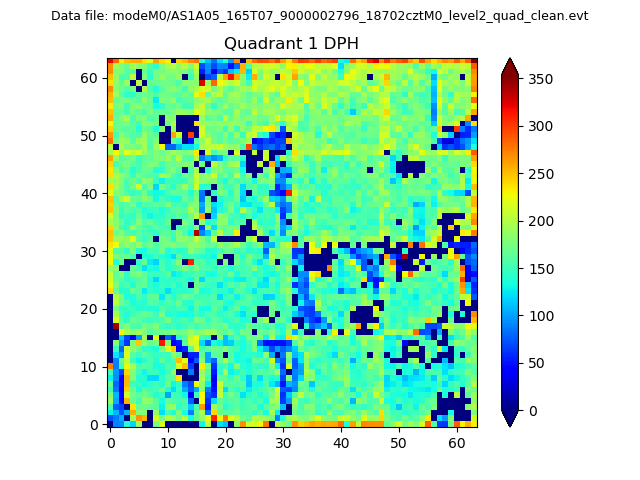 |
Quadrant B |
|---|---|---|---|
| Quadrant D | 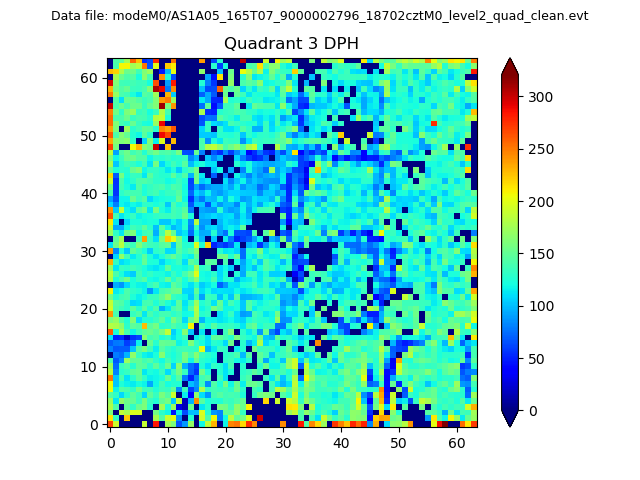 |
 |
Quadrant C |
| Plot type | Count rate plots | Images |
|---|---|---|
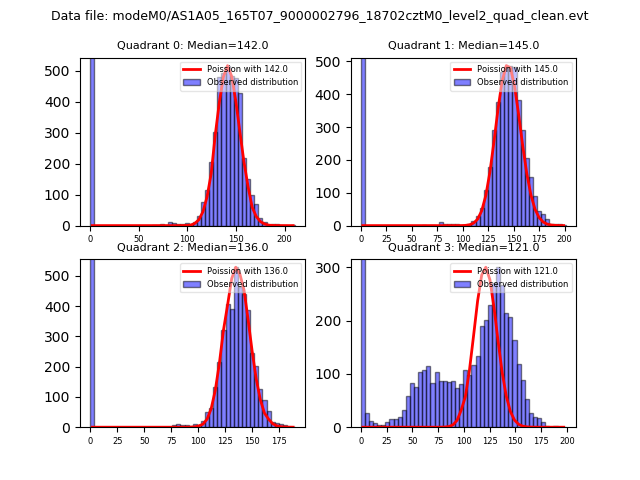
| Comparison with Poisson distribution Blue bars denote a histogram of data divided into 1 sec bins. Red curve is a Poisson curve with rate = median count rate of data. |
 |
 |
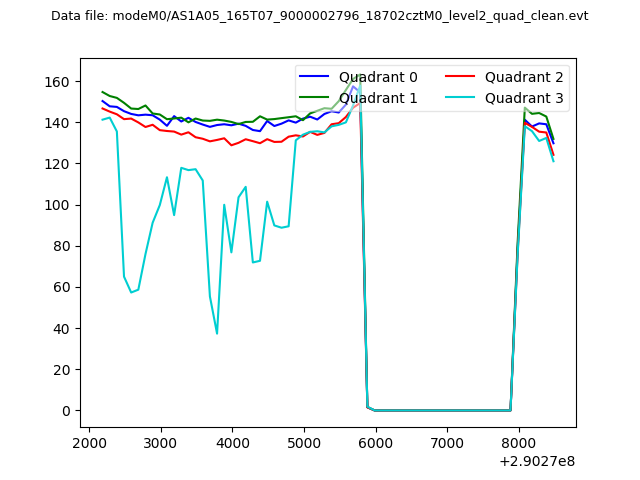
| Quadrant-wise count rates Data is divided into 100 sec bins |
 |
|
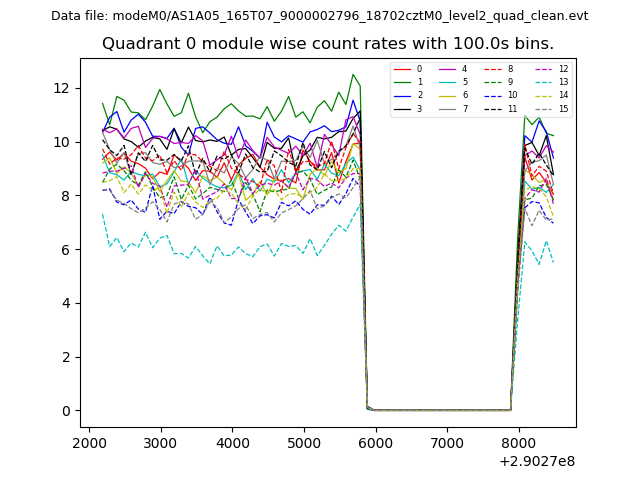
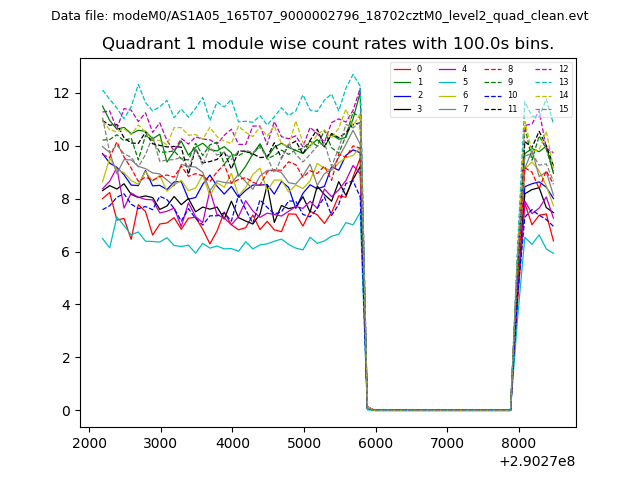
| Module-wise count rates for Quadrant A Data is divided into 100 sec bins |
 |
 |
| Module-wise count rates for Quadrant B Data is divided into 100 sec bins |
 |
 |
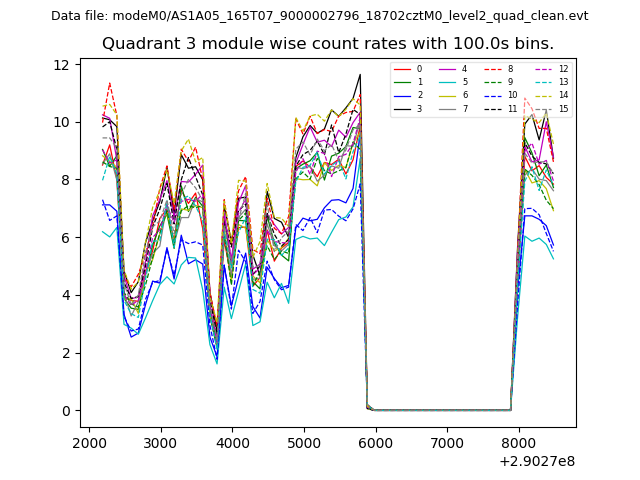
| Module-wise count rates for Quadrant C Data is divided into 100 sec bins |
 |
 |
| Module-wise count rates for Quadrant D Data is divided into 100 sec bins |
 |
 |
| Parameter | Plot |
|---|---|
| CZT HV Monitor |  |
| D_VDD | 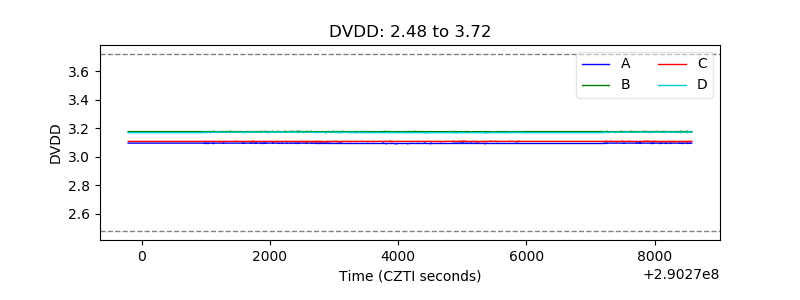 |
| Temperature 1 | 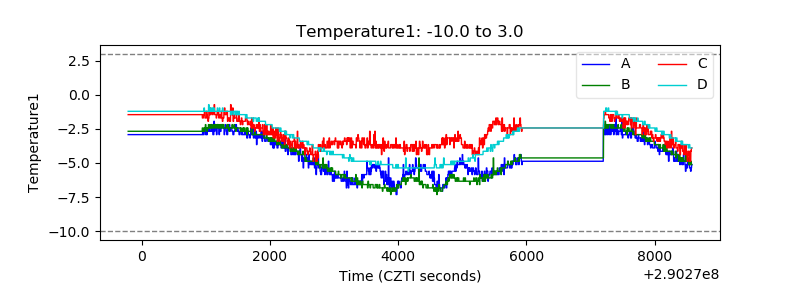 |
| Veto HV Monitor | 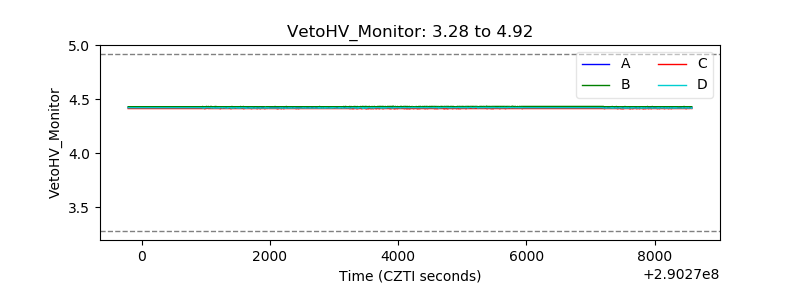 |
| Veto LLD | 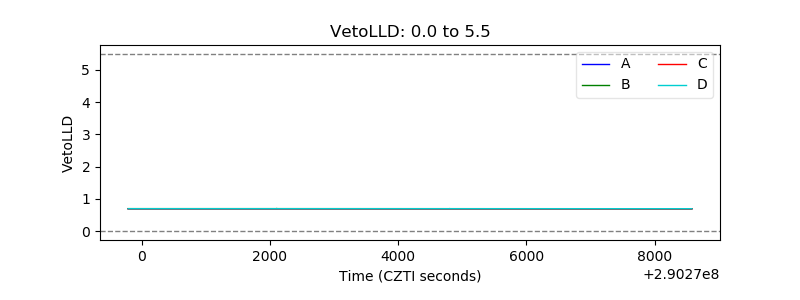 |
| Alpha Counter | 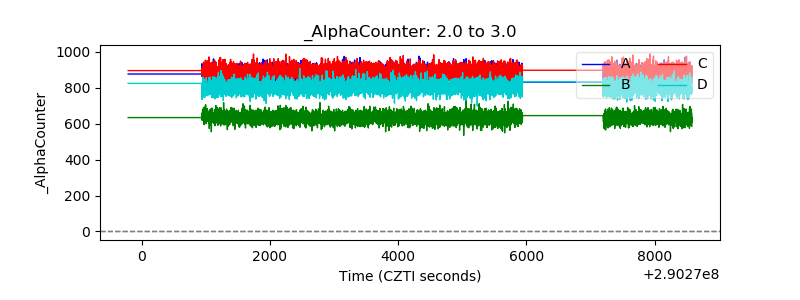 |
| _CPM_Rate | 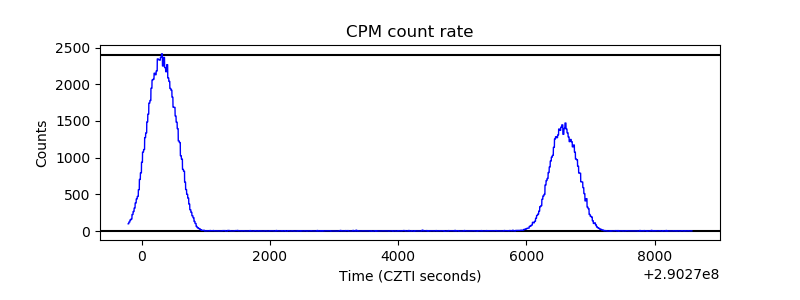 |
| CZT Counter | 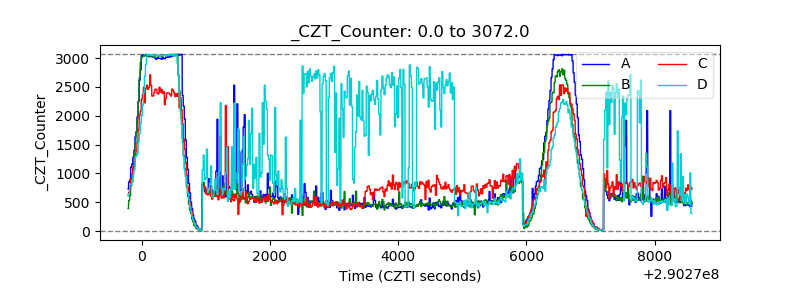 |
| +2.5 Volts monitor | 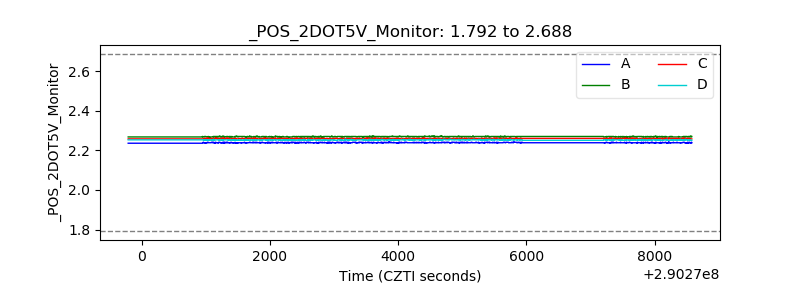 |
| +5 Volts monitor |  |
| _ROLL_ROT | 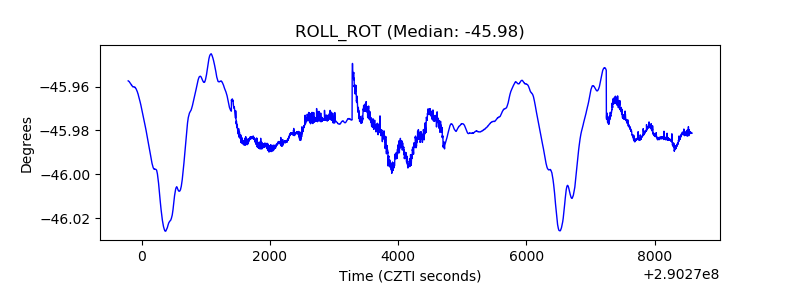 |
| _Roll_DEC | 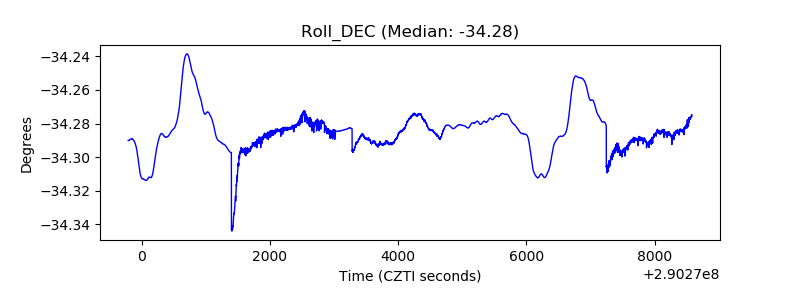 |
| _Roll_RA | 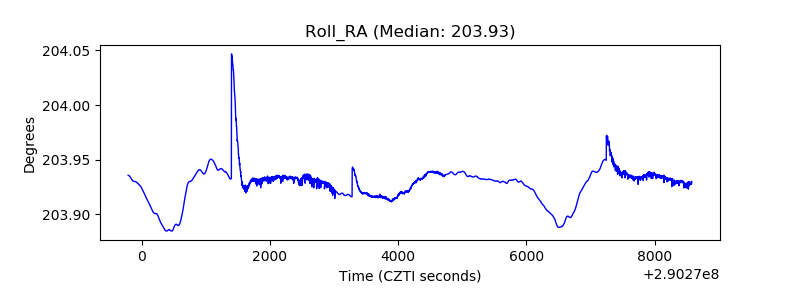 |
| Veto Counter | 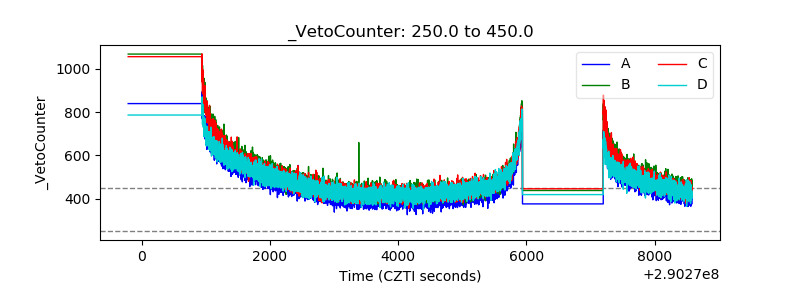 |