| Param | Original file | Final file |
|---|---|---|
| Filename | modeM0/AS1A05_165T07_9000002796_18704cztM0_level2.evt | modeM0/AS1A05_165T07_9000002796_18704cztM0_level2_quad_clean.evt |
| Size (bytes) | 623,629,440 | 102,571,200 |
| Size | 594.7 MB | 97.8 MB |
| Events in quadrant A | 3,800,430 | 655,266 |
| Events in quadrant B | 3,871,887 | 665,609 |
| Events in quadrant C | 6,096,542 | 631,457 |
| Events in quadrant D | 4,603,527 | 625,512 |
| Mode M9 | |||
|---|---|---|---|
| Quadrant | BADHDUFLAG | Total packets | Discarded packets |
| A | 0 | 18 | 0 |
| B | 0 | 18 | 0 |
| C | 0 | 18 | 0 |
| D | 0 | 18 | 0 |
| Mode M0 | |||
|---|---|---|---|
| Quadrant | BADHDUFLAG | Total packets | Discarded packets |
| A | 0 | 16171 | 2 |
| B | 0 | 16334 | 2 |
| C | 0 | 23487 | 2 |
| D | 0 | 19013 | 3 |
| Mode SS | |||
|---|---|---|---|
| Quadrant | BADHDUFLAG | Total packets | Discarded packets |
| A | 0 | 156 | 0 |
| B | 0 | 156 | 0 |
| C | 0 | 156 | 0 |
| D | 0 | 156 | 0 |
| Quadrant | Total seconds | Saturated seconds | Saturation percentage |
|---|---|---|---|
| A | 7597 | 75 | 0.987232% |
| B | 7597 | 81 | 1.066210% |
| C | 7598 | 229 | 3.013951% |
| D | 7597 | 293 | 3.856786% |
Noise dominated data is calculated using 1-second bins in cleaned event files. If a bin has >2000 counts, and if more than 50% of those come from <1% of pixels, then it is considered to be noise-dominated and hence unusable.
| Quadrant | # 1 sec bins | Bins with >0 counts | Bins with >2000 counts | High rate bins dominated by noise | Noise dominated (total time) | Noise dominated (detector-on time) | Marked lightcurve |
|---|---|---|---|---|---|---|---|
| A | 9407 | 7599 | 9 | 9 | 0.10% | 0.12% | 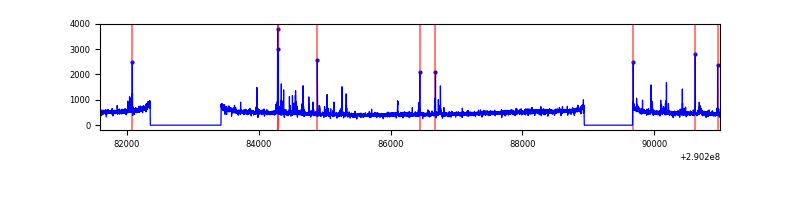 |
| B | 9407 | 7599 | 7 | 7 | 0.07% | 0.09% | 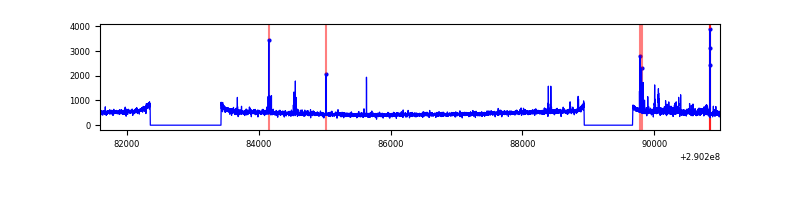 |
| C | 9408 | 7600 | 0 | 0 | 0.00% | 0.00% | 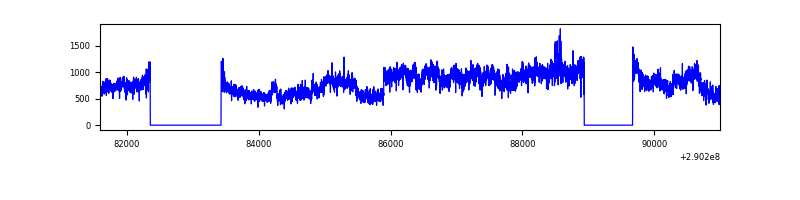 |
| D | 9407 | 7599 | 183 | 183 | 1.95% | 2.41% | 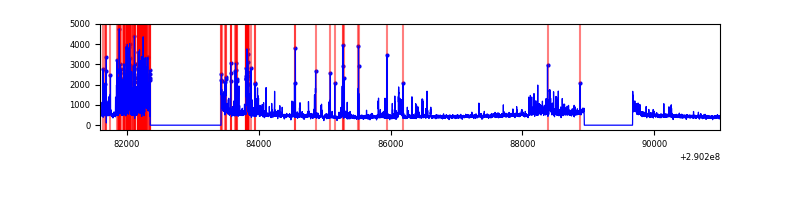 |
Top three noisy pixels from each quadrant. If the there are fewer than three noisy pixels in the level2.evt file, extra rows are filled as -1
| Pixel properties | Quadrant properties | ||||||
|---|---|---|---|---|---|---|---|
| Quadrant | DetID | PixID | Counts | Sigma | Mean | Median | Sigma |
| A | 9 | 143 | 123222 | 644.24 | 945 | 924 | 189.8 |
| A | 11 | 29 | 17475 | 87.19 | 945 | 924 | 189.8 |
| A | 6 | 16 | 13516 | 66.33 | 945 | 924 | 189.8 |
| B | 10 | 245 | 66856 | 362.2 | 946 | 922 | 182.0 |
| B | 0 | 197 | 52788 | 284.92 | 946 | 922 | 182.0 |
| B | 0 | 189 | 21918 | 115.34 | 946 | 922 | 182.0 |
| C | 3 | 233 | 2418655 | 11382.39 | 904 | 909 | 212.4 |
| C | 14 | 238 | 140579 | 657.55 | 904 | 909 | 212.4 |
| C | 0 | 207 | 15739 | 69.82 | 904 | 909 | 212.4 |
| D | 1 | 52 | 915673 | 4146.38 | 902 | 873 | 220.6 |
| D | 7 | 238 | 207159 | 935.0 | 902 | 873 | 220.6 |
| D | 2 | 234 | 32317 | 142.52 | 902 | 873 | 220.6 |
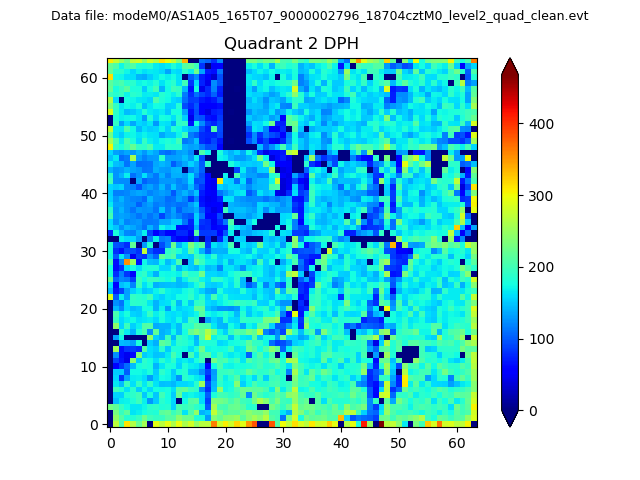
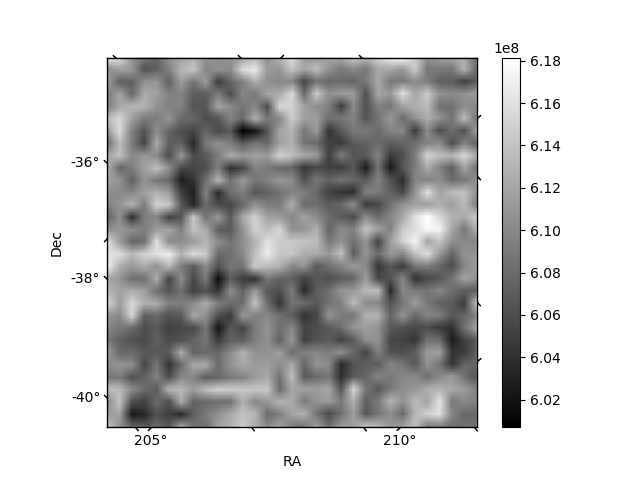
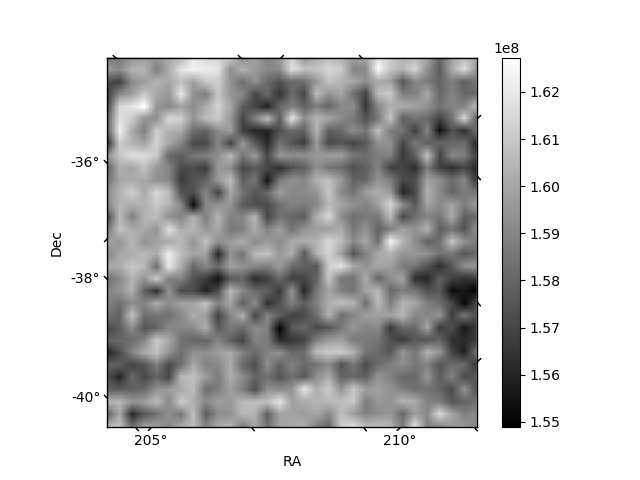
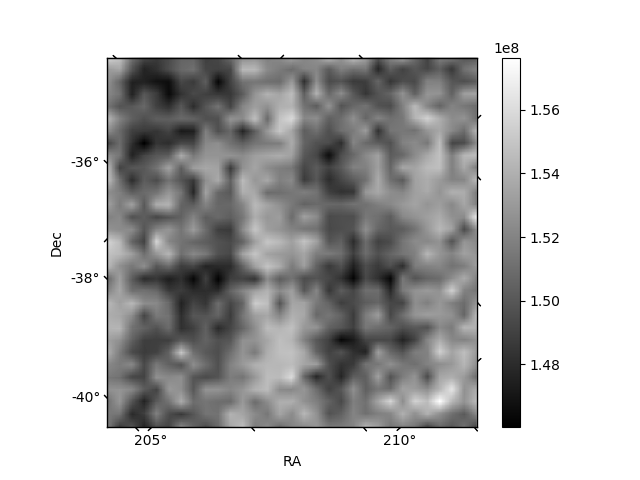
Histogram calculated using DETX and DETY for each event in the final _common_clean file
| Quadrant A | 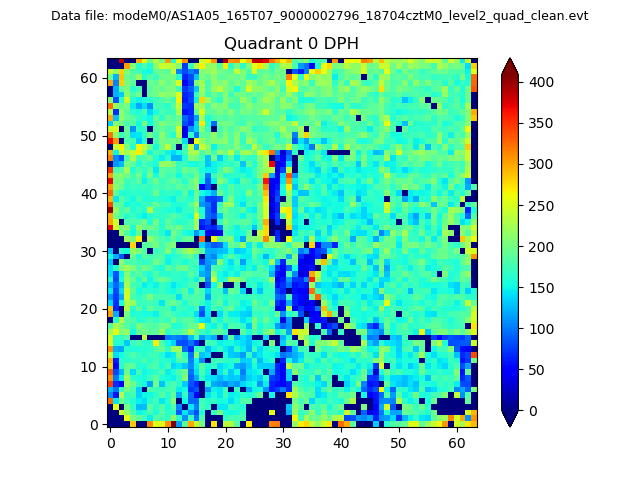 |
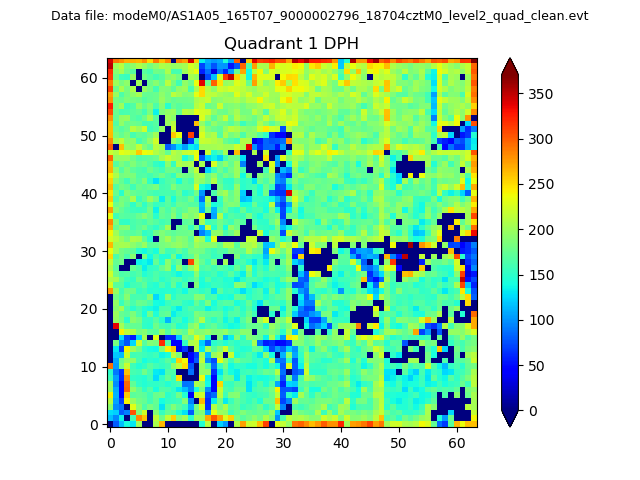 |
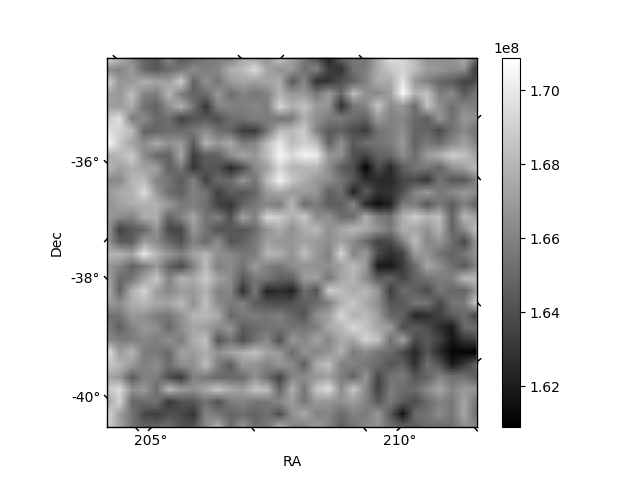
Quadrant B |
|---|---|---|---|
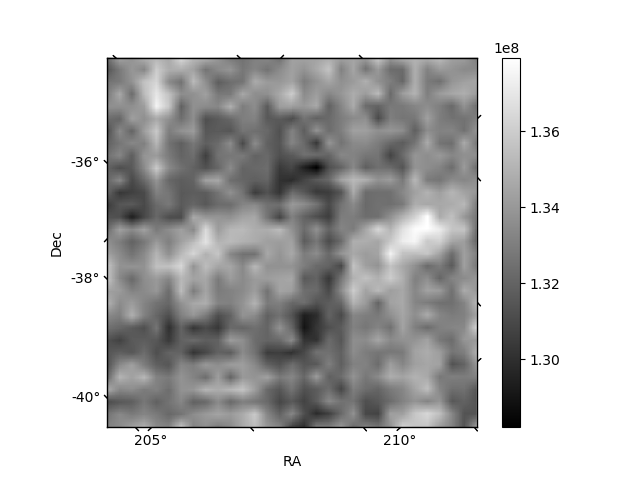
| Quadrant D | 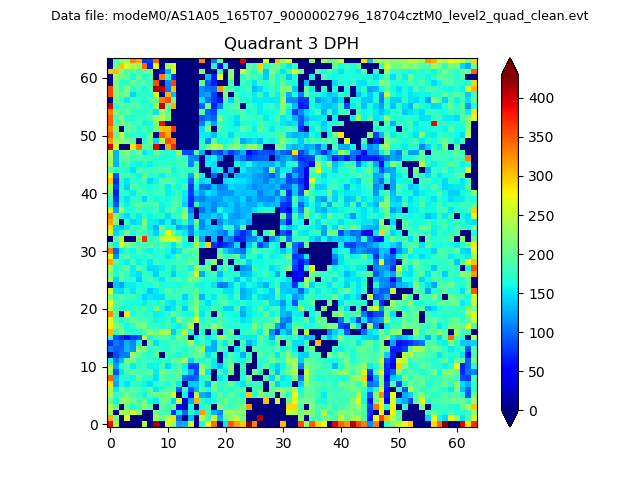 |
 |
Quadrant C |
| Plot type | Count rate plots | Images |
|---|---|---|
| Comparison with Poisson distribution Blue bars denote a histogram of data divided into 1 sec bins. Red curve is a Poisson curve with rate = median count rate of data. |
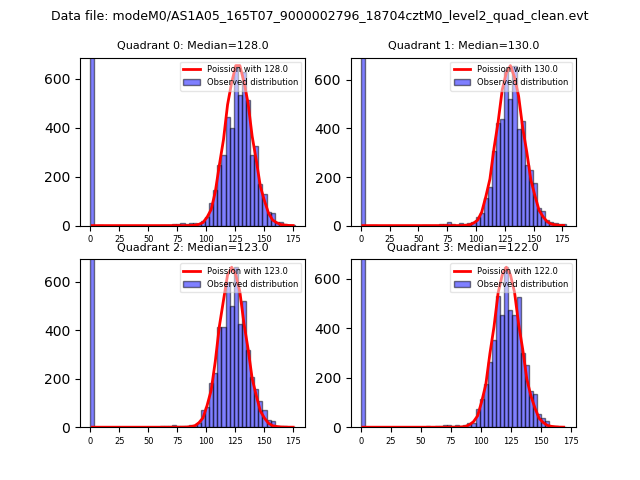 |
 |
| Quadrant-wise count rates Data is divided into 100 sec bins |
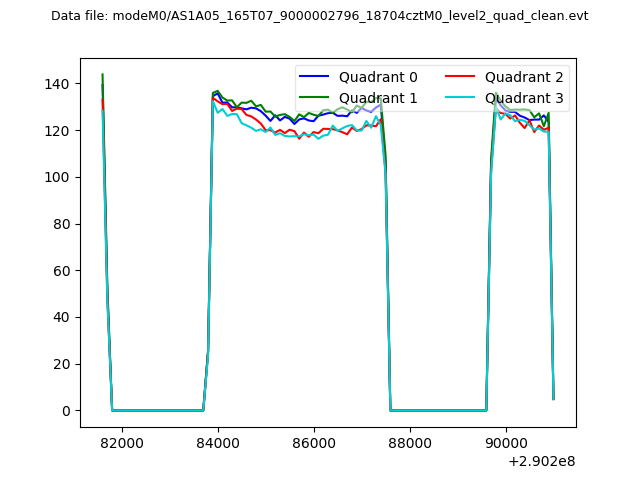 |
|
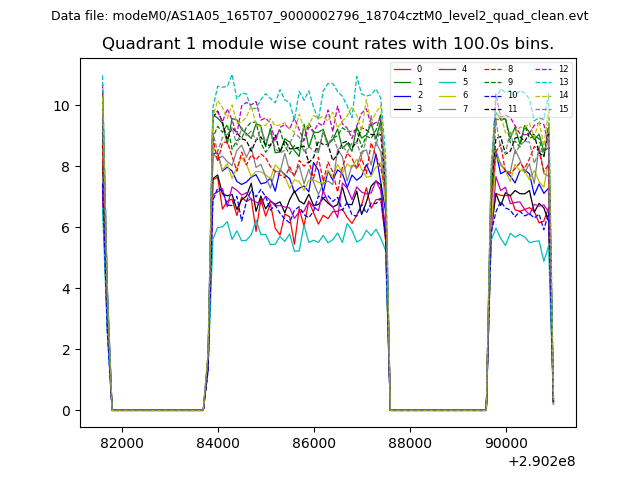
| Module-wise count rates for Quadrant A Data is divided into 100 sec bins |
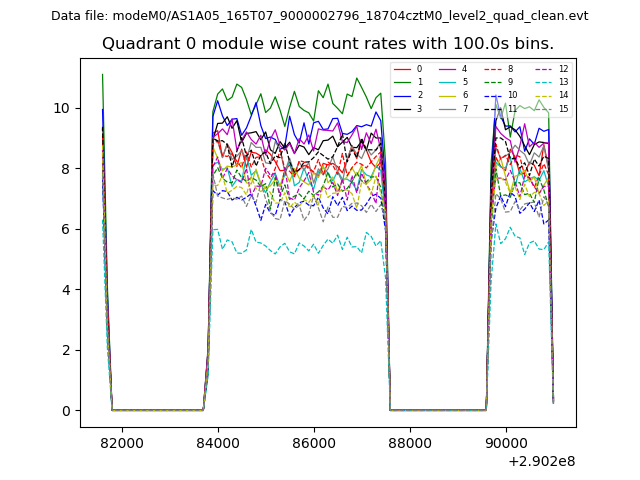 |
 |
| Module-wise count rates for Quadrant B Data is divided into 100 sec bins |
 |
 |
| Module-wise count rates for Quadrant C Data is divided into 100 sec bins |
 |
 |
| Module-wise count rates for Quadrant D Data is divided into 100 sec bins |
 |
 |
| Parameter | Plot |
|---|---|
| CZT HV Monitor | 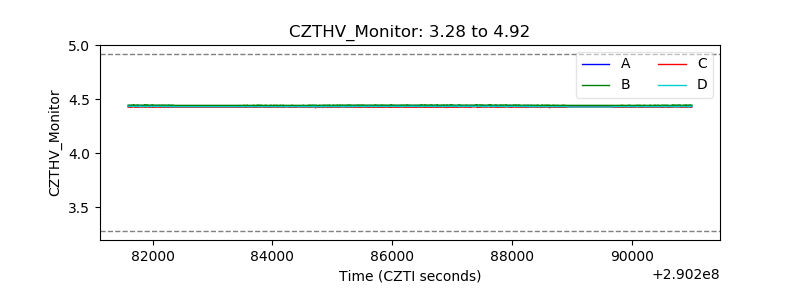 |
| D_VDD | 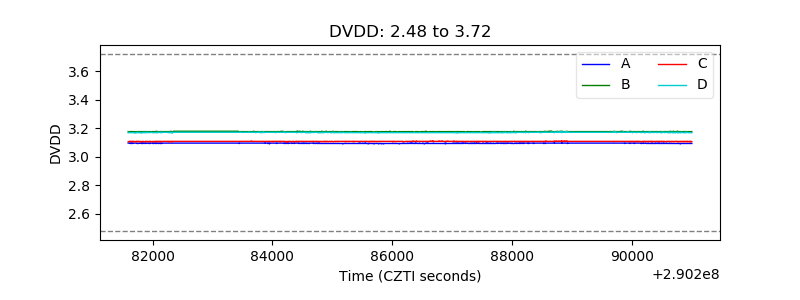 |
| Temperature 1 | 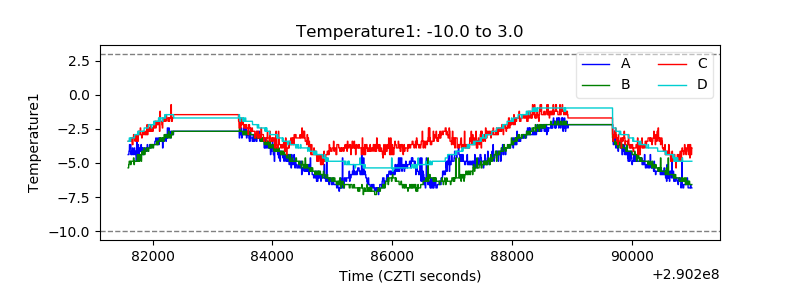 |
| Veto HV Monitor | 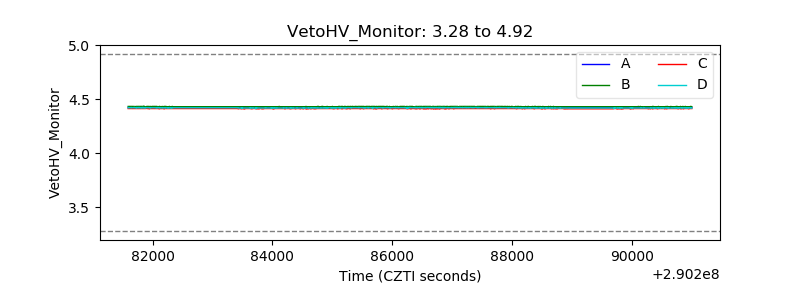 |
| Veto LLD |  |
| Alpha Counter |  |
| _CPM_Rate | 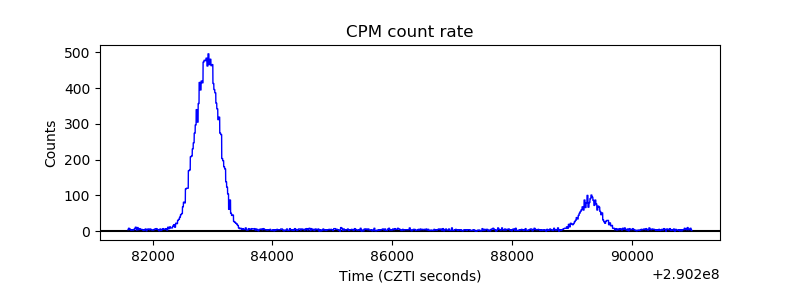 |
| CZT Counter | 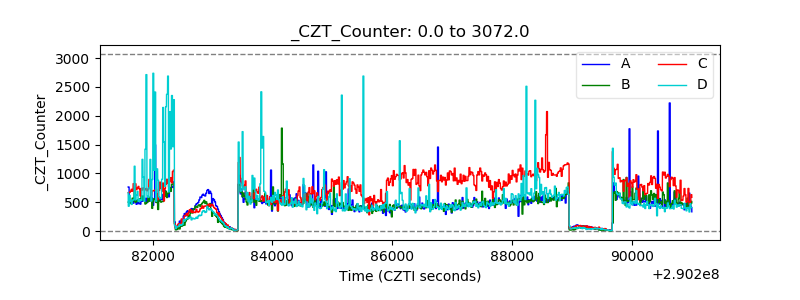 |
| +2.5 Volts monitor |  |
| +5 Volts monitor |  |
| _ROLL_ROT | 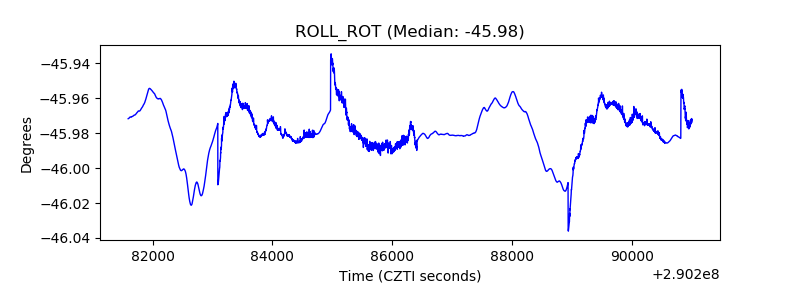 |
| _Roll_DEC | 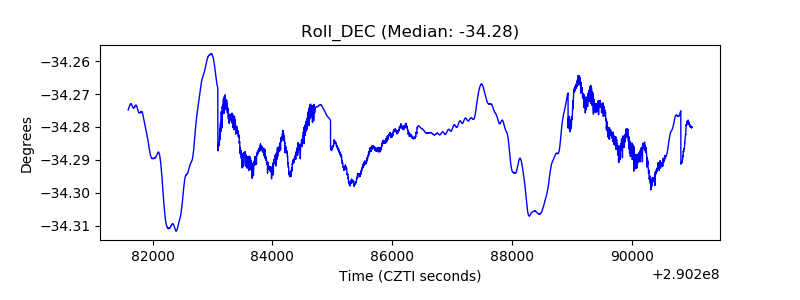 |
| _Roll_RA | 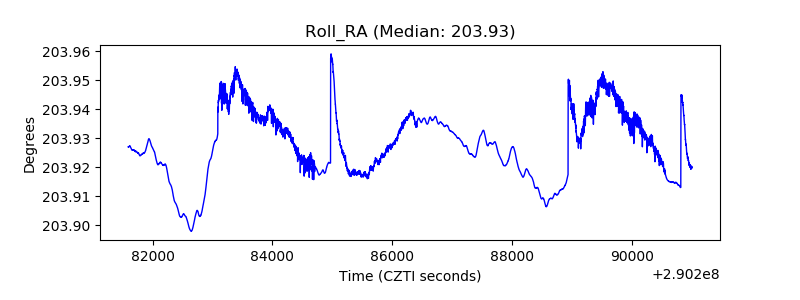 |
| Veto Counter | 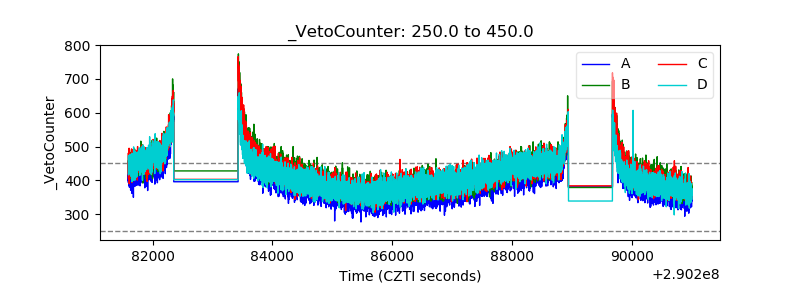 |