| Param | Original file | Final file |
|---|---|---|
| Filename | modeM0/AS1A05_165T07_9000002796_18705cztM0_level2.evt | modeM0/AS1A05_165T07_9000002796_18705cztM0_level2_quad_clean.evt |
| Size (bytes) | 630,383,040 | 100,667,520 |
| Size | 601.2 MB | 96.0 MB |
| Events in quadrant A | 4,056,446 | 636,391 |
| Events in quadrant B | 4,478,984 | 644,990 |
| Events in quadrant C | 6,401,169 | 619,070 |
| Events in quadrant D | 3,634,638 | 614,008 |
| Mode M9 | |||
|---|---|---|---|
| Quadrant | BADHDUFLAG | Total packets | Discarded packets |
| A | 0 | 10 | 0 |
| B | 0 | 10 | 0 |
| C | 0 | 10 | 0 |
| D | 0 | 10 | 0 |
| Mode M0 | |||
|---|---|---|---|
| Quadrant | BADHDUFLAG | Total packets | Discarded packets |
| A | 0 | 17093 | 2 |
| B | 0 | 18213 | 3 |
| C | 0 | 24333 | 2 |
| D | 0 | 16293 | 2 |
| Mode SS | |||
|---|---|---|---|
| Quadrant | BADHDUFLAG | Total packets | Discarded packets |
| A | 0 | 158 | 0 |
| B | 0 | 158 | 0 |
| C | 0 | 158 | 0 |
| D | 0 | 158 | 0 |
| Quadrant | Total seconds | Saturated seconds | Saturation percentage |
|---|---|---|---|
| A | 7680 | 116 | 1.510417% |
| B | 7679 | 147 | 1.914312% |
| C | 7679 | 326 | 4.245344% |
| D | 7679 | 26 | 0.338586% |
Noise dominated data is calculated using 1-second bins in cleaned event files. If a bin has >2000 counts, and if more than 50% of those come from <1% of pixels, then it is considered to be noise-dominated and hence unusable.
| Quadrant | # 1 sec bins | Bins with >0 counts | Bins with >2000 counts | High rate bins dominated by noise | Noise dominated (total time) | Noise dominated (detector-on time) | Marked lightcurve |
|---|---|---|---|---|---|---|---|
| A | 8775 | 7682 | 69 | 69 | 0.79% | 0.90% | 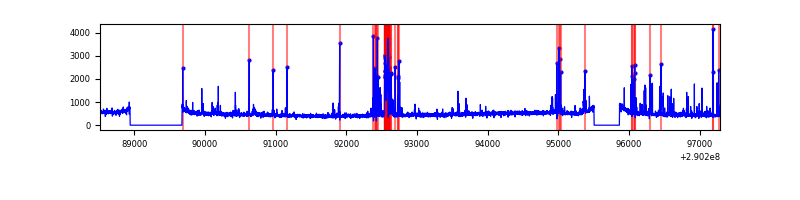 |
| B | 8774 | 7681 | 19 | 19 | 0.22% | 0.25% |  |
| C | 8774 | 7681 | 46 | 46 | 0.52% | 0.60% | 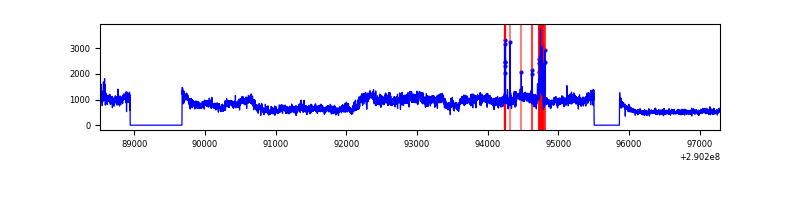 |
| D | 8774 | 7681 | 6 | 6 | 0.07% | 0.08% | 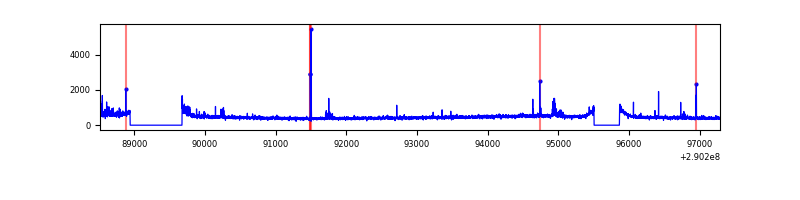 |
Top three noisy pixels from each quadrant. If the there are fewer than three noisy pixels in the level2.evt file, extra rows are filled as -1
| Pixel properties | Quadrant properties | ||||||
|---|---|---|---|---|---|---|---|
| Quadrant | DetID | PixID | Counts | Sigma | Mean | Median | Sigma |
| A | 9 | 143 | 409928 | 2150.73 | 938 | 915 | 190.2 |
| A | 6 | 16 | 14075 | 69.2 | 938 | 915 | 190.2 |
| A | 13 | 254 | 11408 | 55.17 | 938 | 915 | 190.2 |
| B | 10 | 245 | 655042 | 3643.13 | 939 | 916 | 179.6 |
| B | 0 | 197 | 56795 | 311.21 | 939 | 916 | 179.6 |
| B | 3 | 64 | 46922 | 256.23 | 939 | 916 | 179.6 |
| C | 3 | 233 | 2615555 | 12408.98 | 896 | 903 | 210.7 |
| C | 0 | 207 | 154386 | 728.42 | 896 | 903 | 210.7 |
| C | 14 | 238 | 138389 | 652.5 | 896 | 903 | 210.7 |
| D | 7 | 238 | 72185 | 316.73 | 914 | 887 | 225.1 |
| D | 1 | 52 | 66634 | 292.07 | 914 | 887 | 225.1 |
| D | 2 | 234 | 34461 | 149.15 | 914 | 887 | 225.1 |
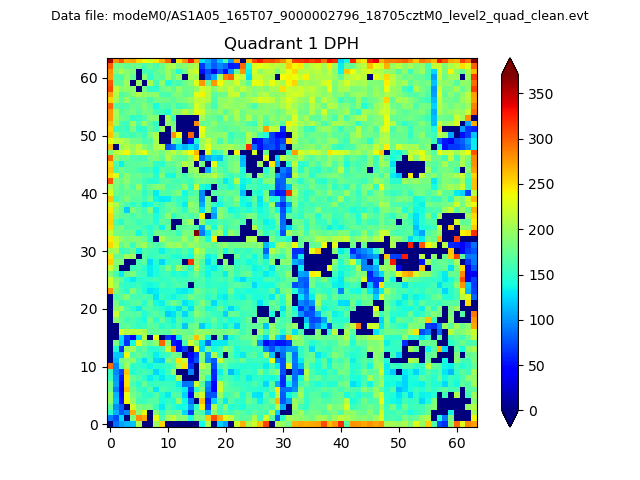
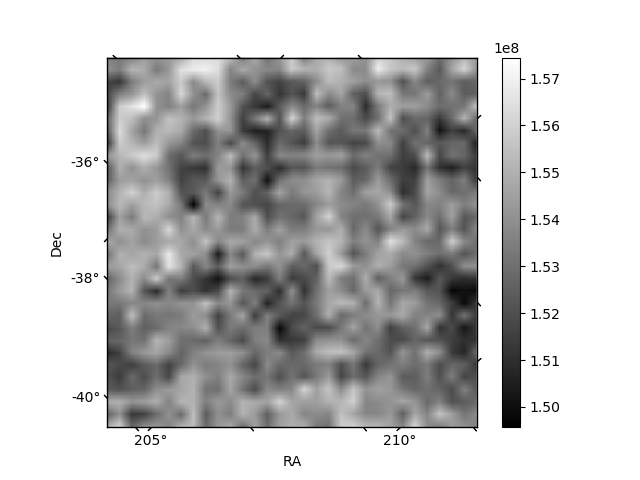
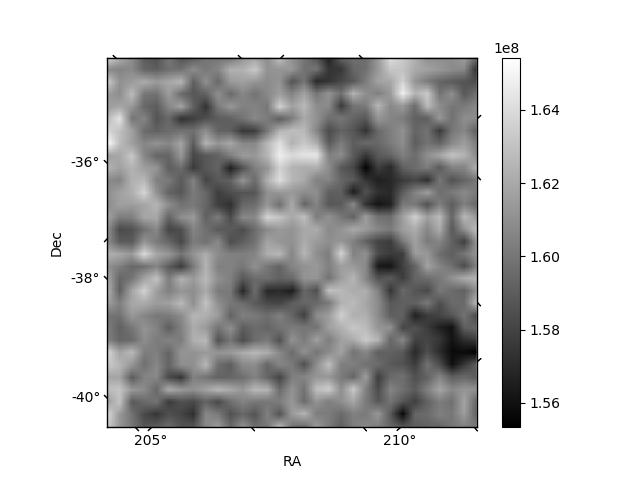
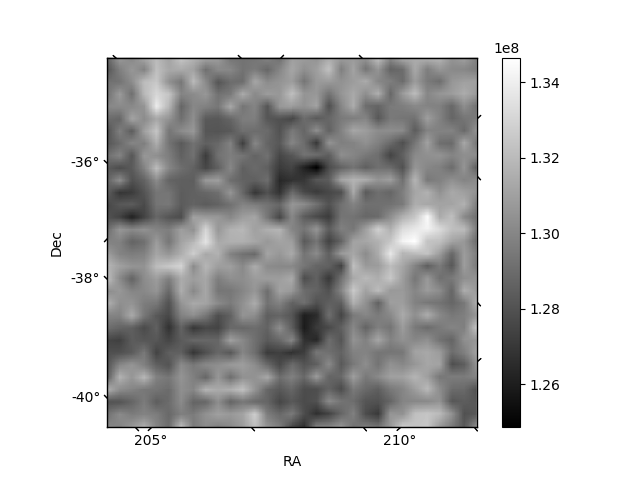
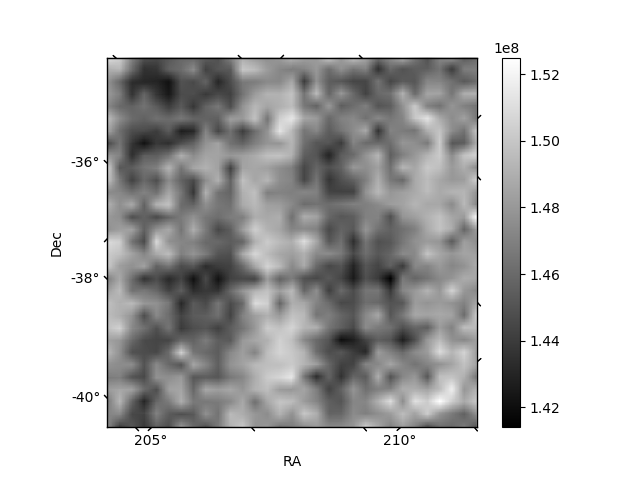
Histogram calculated using DETX and DETY for each event in the final _common_clean file
| Quadrant A | 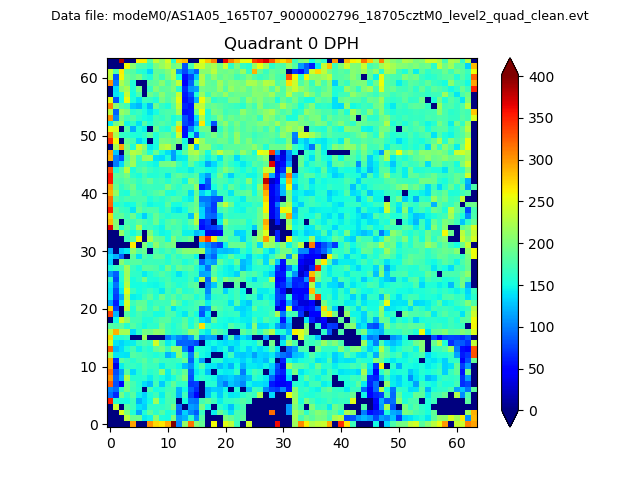 |
 |
Quadrant B |
|---|---|---|---|
| Quadrant D | 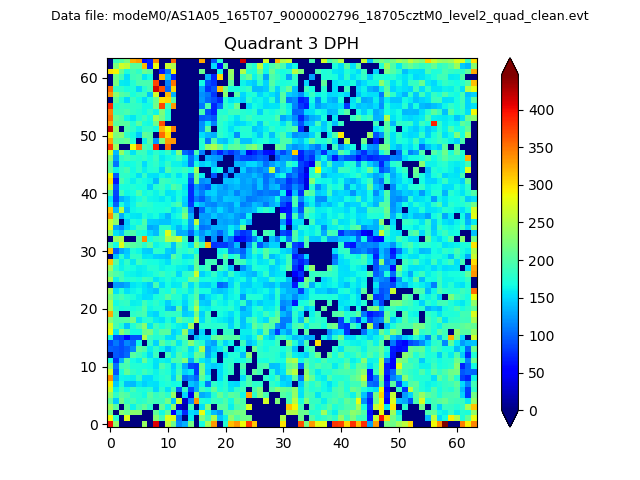 |
 |
Quadrant C |
| Plot type | Count rate plots | Images |
|---|---|---|
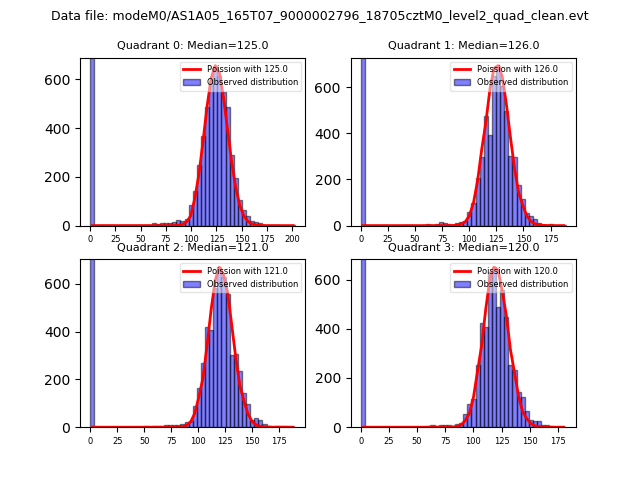
| Comparison with Poisson distribution Blue bars denote a histogram of data divided into 1 sec bins. Red curve is a Poisson curve with rate = median count rate of data. |
 |
 |
| Quadrant-wise count rates Data is divided into 100 sec bins |
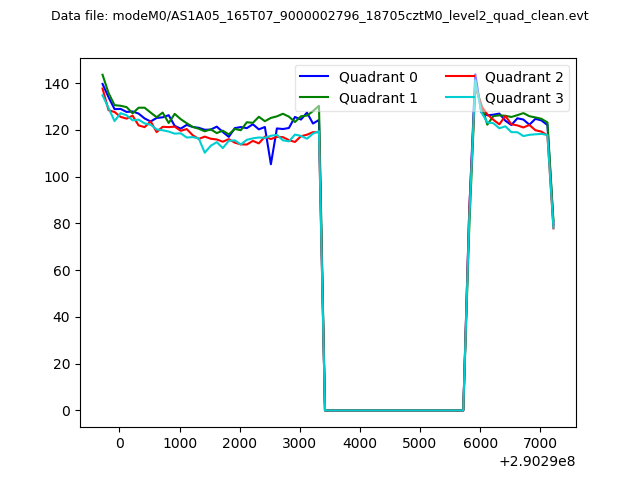 |
|
| Module-wise count rates for Quadrant A Data is divided into 100 sec bins |
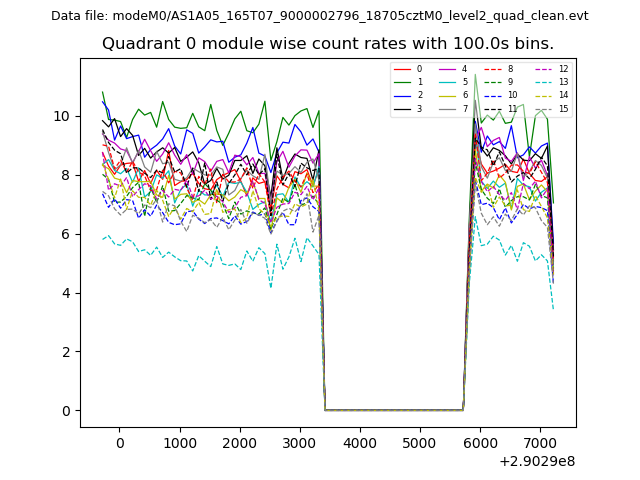 |
 |
| Module-wise count rates for Quadrant B Data is divided into 100 sec bins |
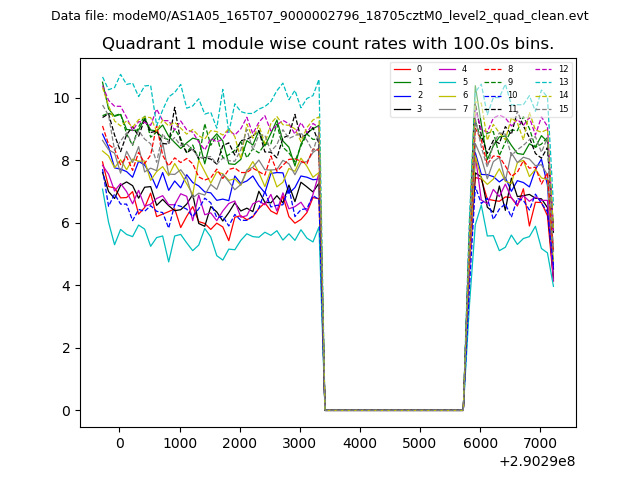 |
 |
| Module-wise count rates for Quadrant C Data is divided into 100 sec bins |
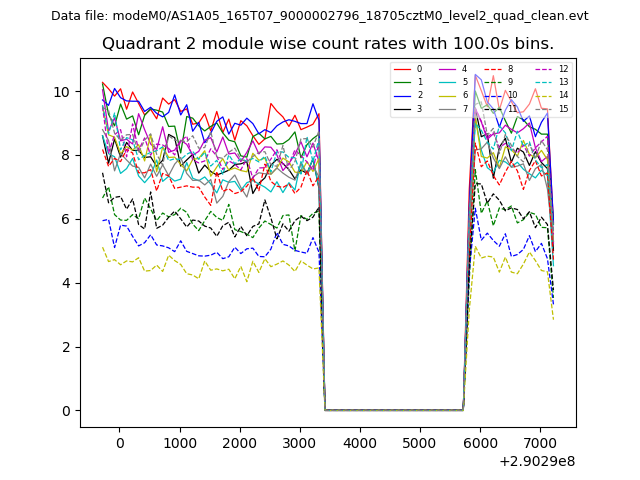 |
 |
| Module-wise count rates for Quadrant D Data is divided into 100 sec bins |
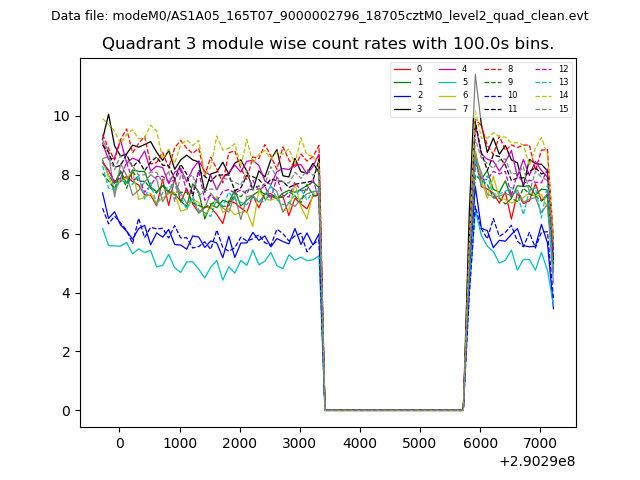 |
 |
| Parameter | Plot |
|---|---|
| CZT HV Monitor | 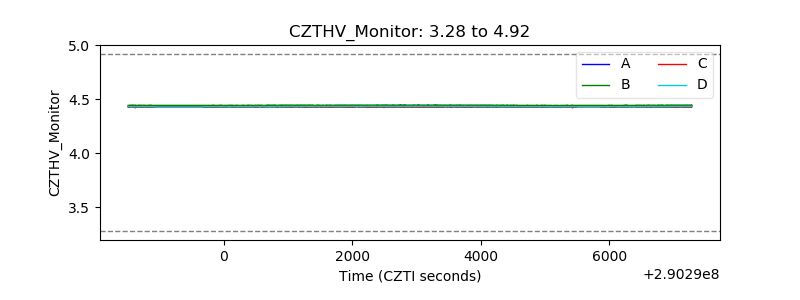 |
| D_VDD | 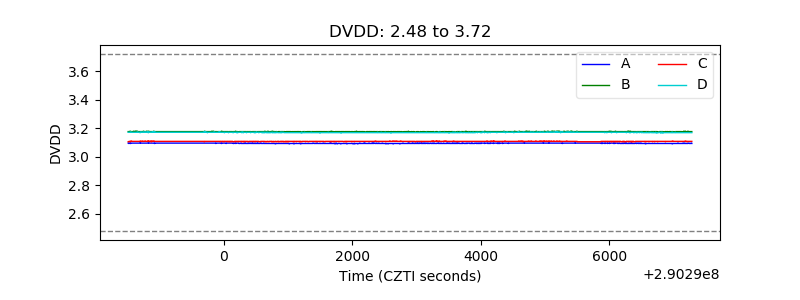 |
| Temperature 1 |  |
| Veto HV Monitor |  |
| Veto LLD | 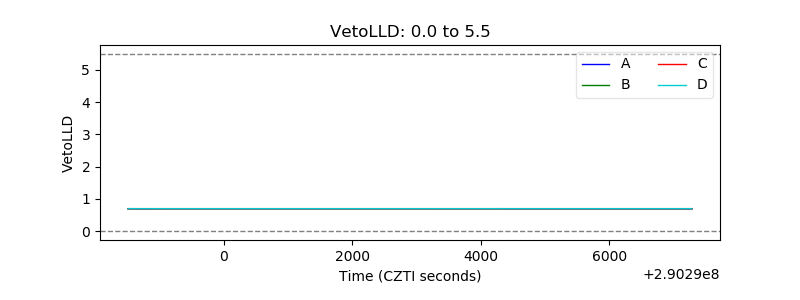 |
| Alpha Counter | 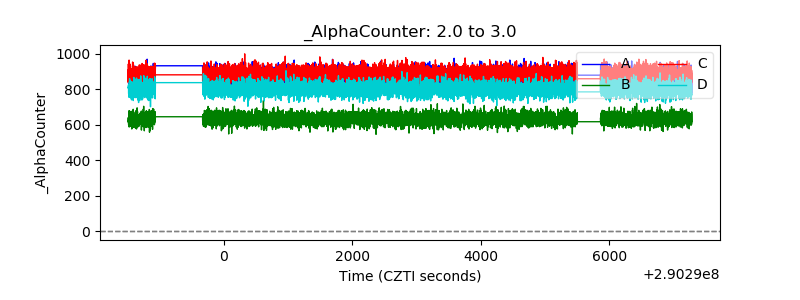 |
| _CPM_Rate | 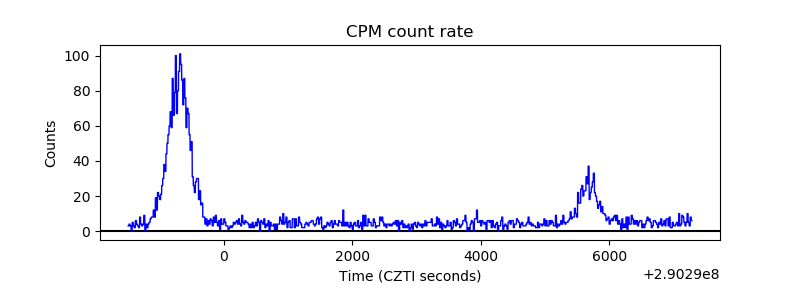 |
| CZT Counter |  |
| +2.5 Volts monitor |  |
| +5 Volts monitor |  |
| _ROLL_ROT | 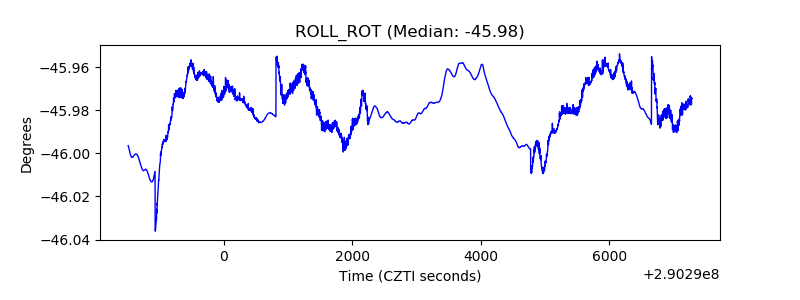 |
| _Roll_DEC | 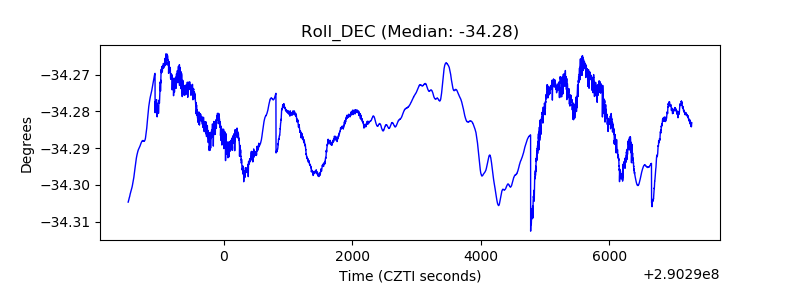 |
| _Roll_RA | 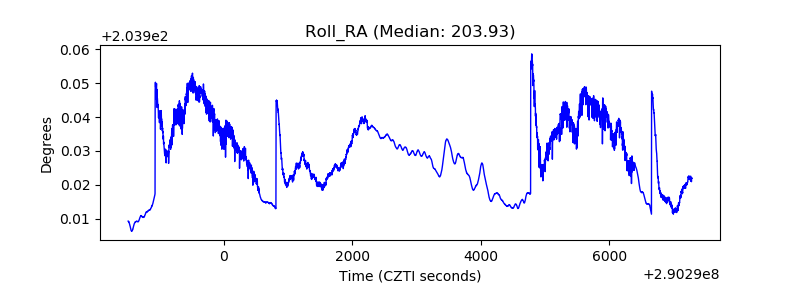 |
| Veto Counter | 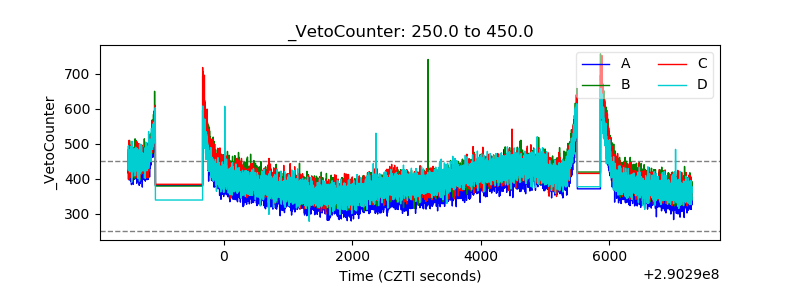 |