| Param | Original file | Final file |
|---|---|---|
| Filename | modeM0/AS1A05_165T07_9000002796_18709cztM0_level2.evt | modeM0/AS1A05_165T07_9000002796_18709cztM0_level2_quad_clean.evt |
| Size (bytes) | 1,772,242,560 | 316,632,960 |
| Size | 1.7 GB | 302.0 MB |
| Events in quadrant A | 11,722,923 | 1,996,080 |
| Events in quadrant B | 12,164,570 | 2,035,922 |
| Events in quadrant C | 15,554,341 | 1,942,427 |
| Events in quadrant D | 12,556,646 | 1,910,162 |
| Mode M9 | |||
|---|---|---|---|
| Quadrant | BADHDUFLAG | Total packets | Discarded packets |
| A | 0 | 25 | 0 |
| B | 0 | 25 | 0 |
| C | 0 | 25 | 0 |
| D | 0 | 25 | 0 |
| Mode M0 | |||
|---|---|---|---|
| Quadrant | BADHDUFLAG | Total packets | Discarded packets |
| A | 0 | 51076 | 5 |
| B | 0 | 52058 | 5 |
| C | 0 | 63329 | 5 |
| D | 0 | 54813 | 6 |
| Mode SS | |||
|---|---|---|---|
| Quadrant | BADHDUFLAG | Total packets | Discarded packets |
| A | 0 | 506 | 0 |
| B | 0 | 506 | 0 |
| C | 0 | 506 | 0 |
| D | 0 | 506 | 0 |
| Quadrant | Total seconds | Saturated seconds | Saturation percentage |
|---|---|---|---|
| A | 24795 | 131 | 0.528332% |
| B | 24796 | 266 | 1.072754% |
| C | 24796 | 441 | 1.778513% |
| D | 24795 | 384 | 1.548699% |
Noise dominated data is calculated using 1-second bins in cleaned event files. If a bin has >2000 counts, and if more than 50% of those come from <1% of pixels, then it is considered to be noise-dominated and hence unusable.
| Quadrant | # 1 sec bins | Bins with >0 counts | Bins with >2000 counts | High rate bins dominated by noise | Noise dominated (total time) | Noise dominated (detector-on time) | Marked lightcurve |
|---|---|---|---|---|---|---|---|
| A | 27285 | 24800 | 24 | 24 | 0.09% | 0.10% | 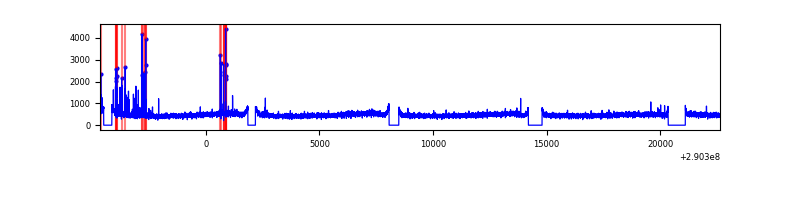 |
| B | 27286 | 24801 | 36 | 36 | 0.13% | 0.15% | 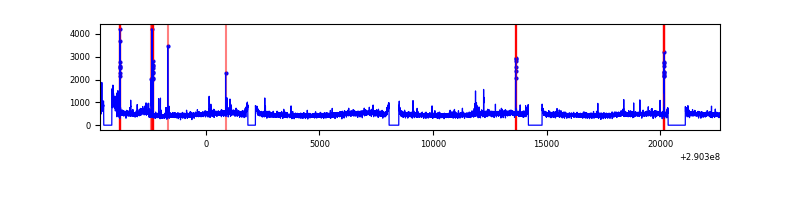 |
| C | 27286 | 24801 | 4 | 4 | 0.01% | 0.02% | 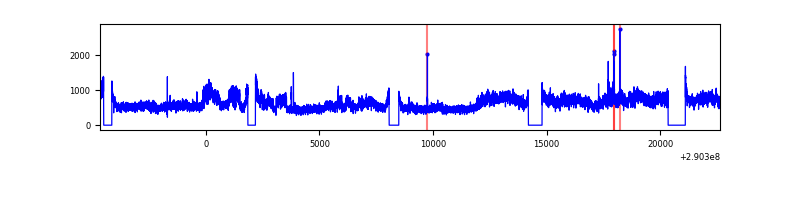 |
| D | 27285 | 24800 | 263 | 263 | 0.96% | 1.06% | 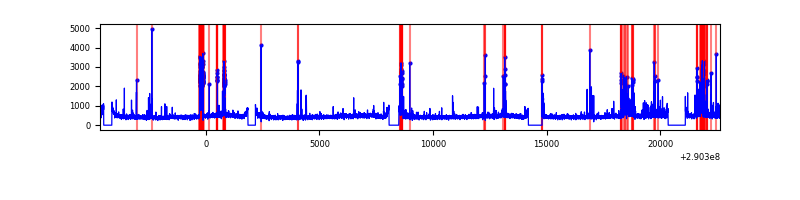 |
Top three noisy pixels from each quadrant. If the there are fewer than three noisy pixels in the level2.evt file, extra rows are filled as -1
| Pixel properties | Quadrant properties | ||||||
|---|---|---|---|---|---|---|---|
| Quadrant | DetID | PixID | Counts | Sigma | Mean | Median | Sigma |
| A | 9 | 143 | 143496 | 235.13 | 2969 | 2903 | 597.9 |
| A | 14 | 111 | 74405 | 119.58 | 2969 | 2903 | 597.9 |
| A | 15 | 192 | 41888 | 65.2 | 2969 | 2903 | 597.9 |
| B | 10 | 245 | 363414 | 638.02 | 2966 | 2888 | 565.1 |
| B | 12 | 111 | 70099 | 118.94 | 2966 | 2888 | 565.1 |
| B | 11 | 111 | 61185 | 103.17 | 2966 | 2888 | 565.1 |
| C | 3 | 233 | 3914567 | 5857.08 | 2862 | 2882 | 667.9 |
| C | 14 | 238 | 435648 | 647.99 | 2862 | 2882 | 667.9 |
| C | 0 | 207 | 38354 | 53.11 | 2862 | 2882 | 667.9 |
| D | 7 | 238 | 789249 | 1125.49 | 2882 | 2797 | 698.8 |
| D | 1 | 52 | 712432 | 1015.56 | 2882 | 2797 | 698.8 |
| D | 2 | 234 | 106294 | 148.11 | 2882 | 2797 | 698.8 |
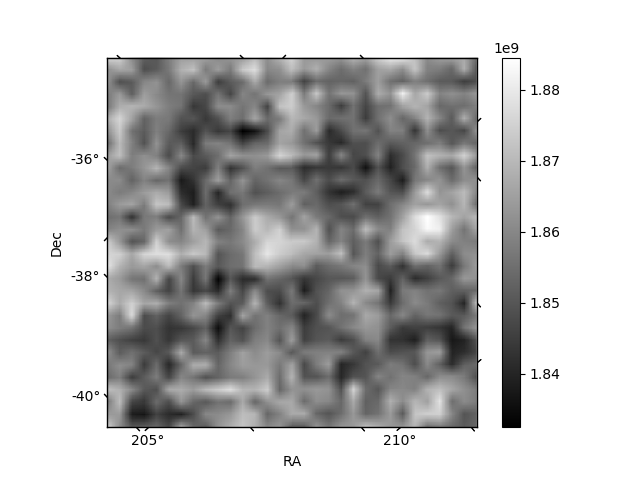
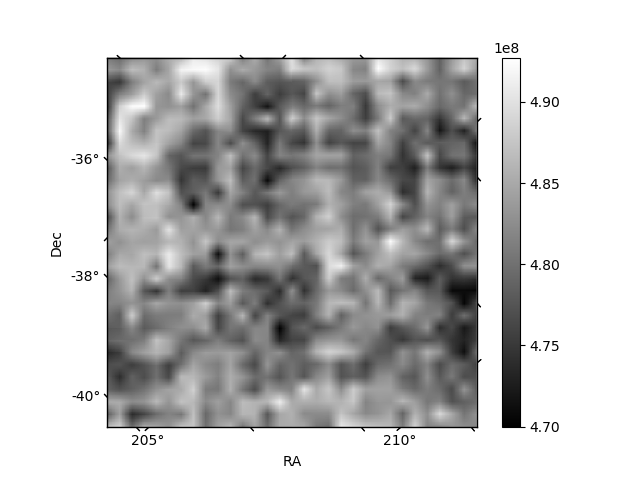
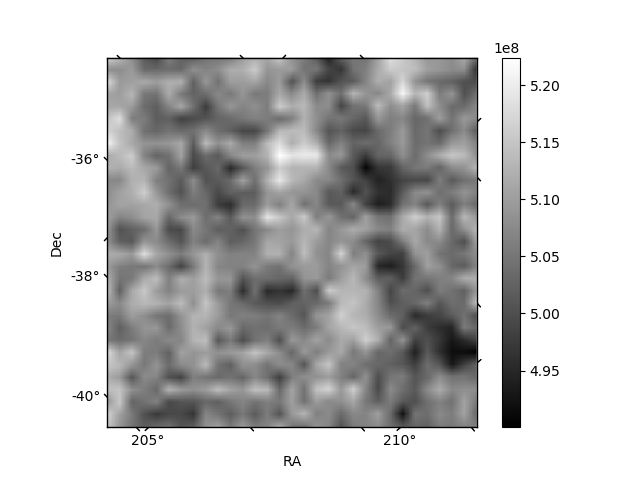
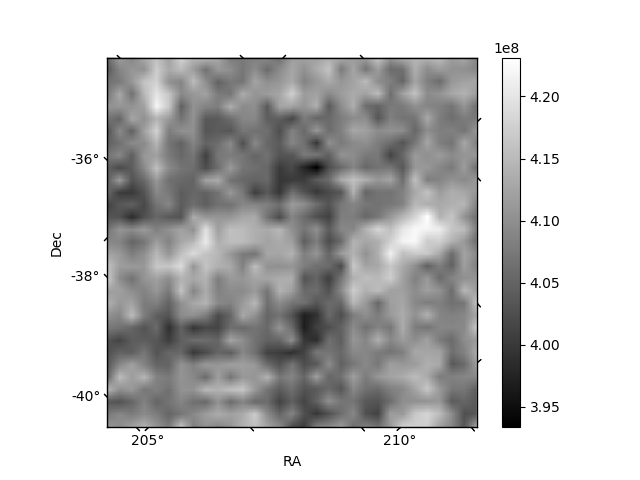
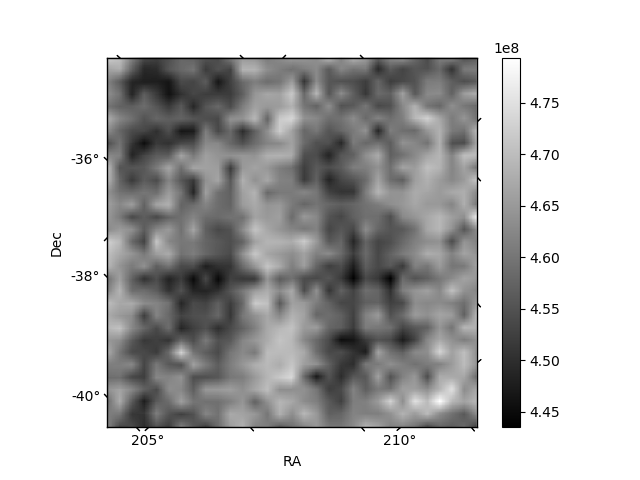
Histogram calculated using DETX and DETY for each event in the final _common_clean file
| Quadrant A | 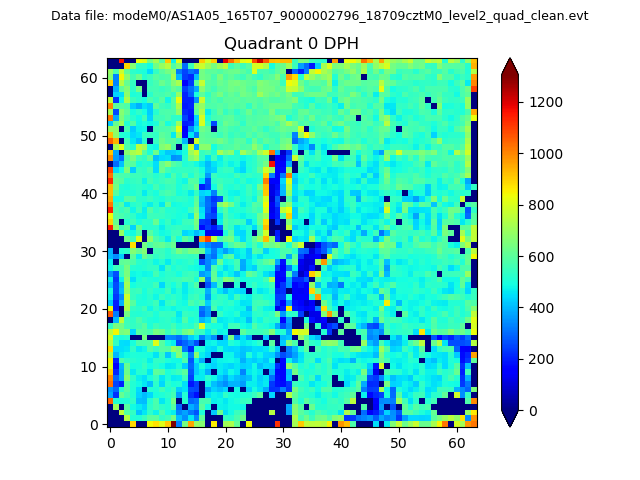 |
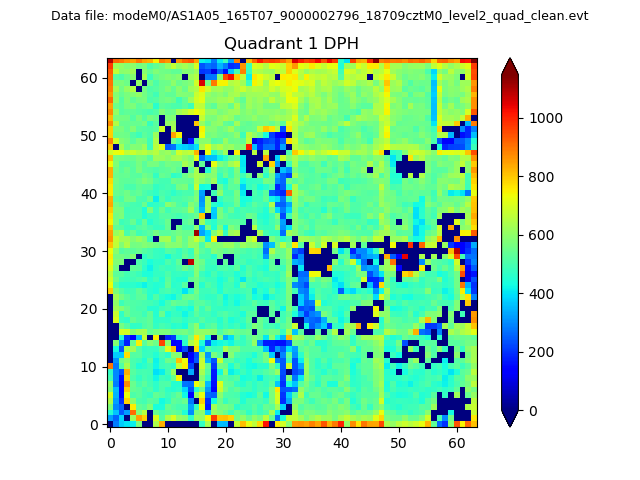 |
Quadrant B |
|---|---|---|---|
| Quadrant D | 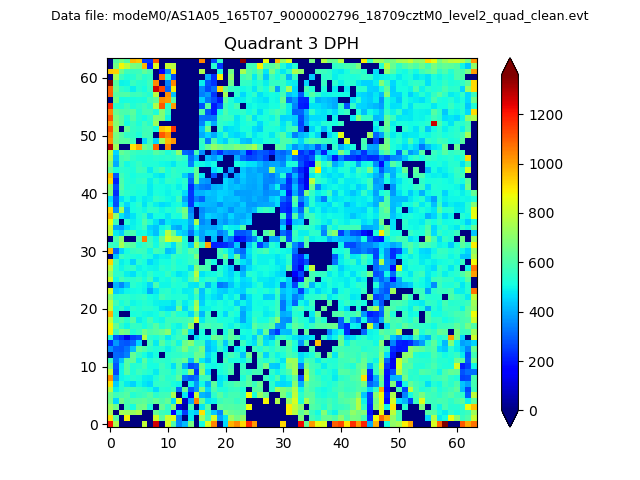 |
 |
Quadrant C |
| Plot type | Count rate plots | Images |
|---|---|---|
| Comparison with Poisson distribution Blue bars denote a histogram of data divided into 1 sec bins. Red curve is a Poisson curve with rate = median count rate of data. |
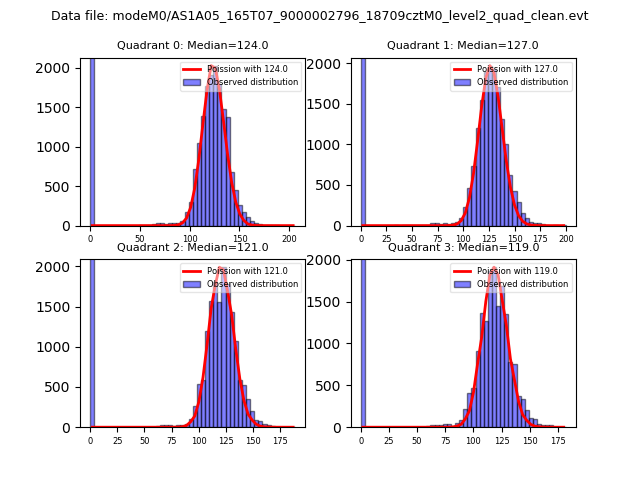 |
 |
| Quadrant-wise count rates Data is divided into 100 sec bins |
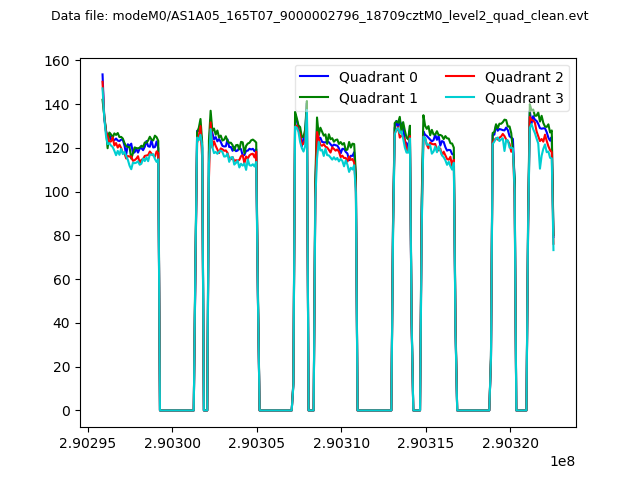 |
|
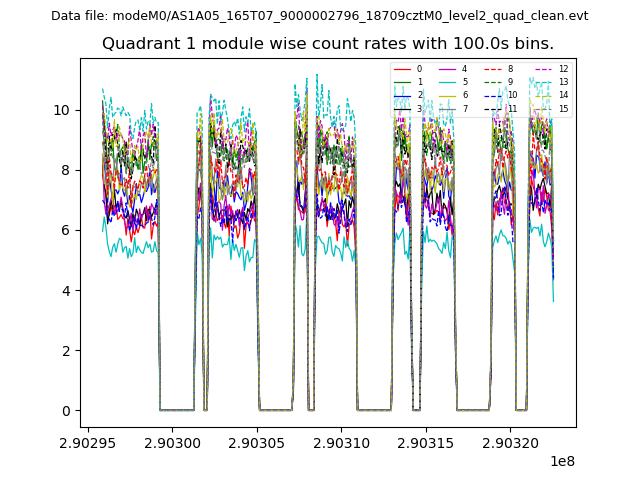
| Module-wise count rates for Quadrant A Data is divided into 100 sec bins |
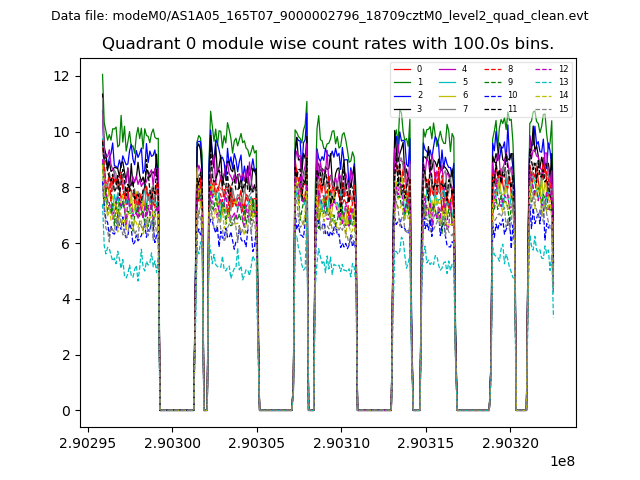 |
 |
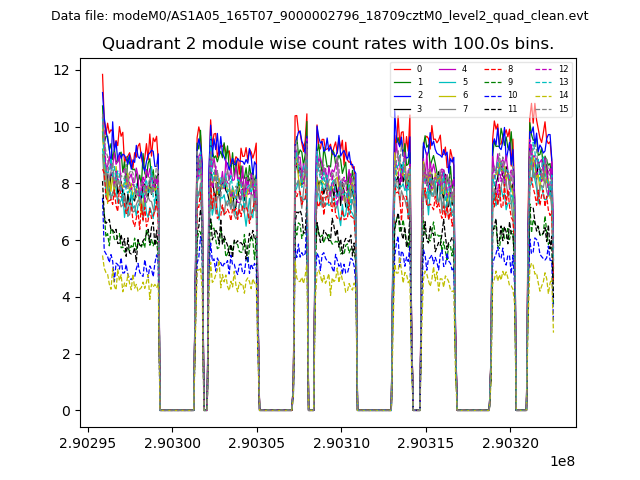
| Module-wise count rates for Quadrant B Data is divided into 100 sec bins |
 |
 |
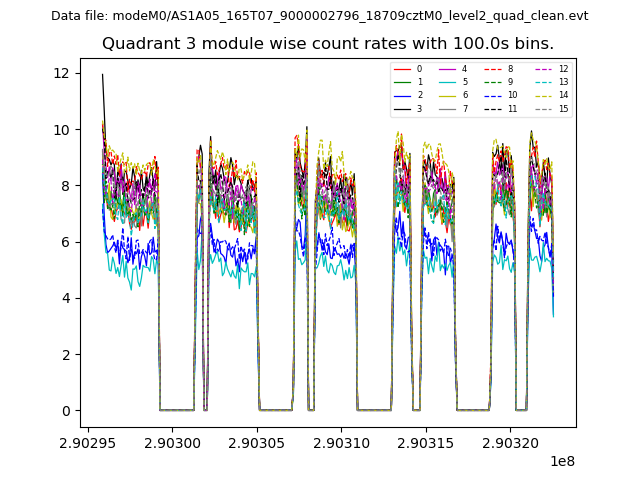
| Module-wise count rates for Quadrant C Data is divided into 100 sec bins |
 |
 |
| Module-wise count rates for Quadrant D Data is divided into 100 sec bins |
 |
 |
| Parameter | Plot |
|---|---|
| CZT HV Monitor | 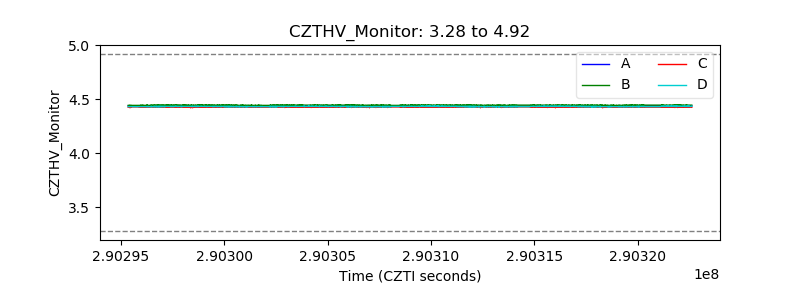 |
| D_VDD | 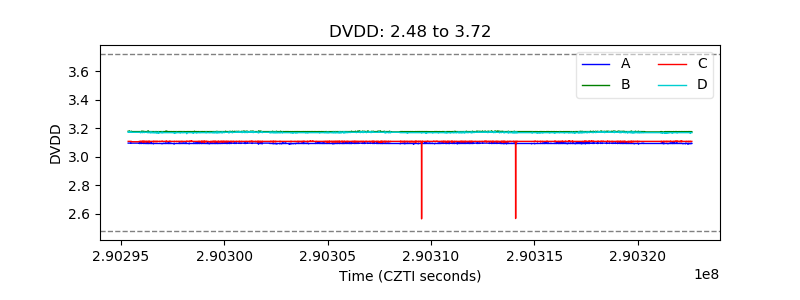 |
| Temperature 1 |  |
| Veto HV Monitor | 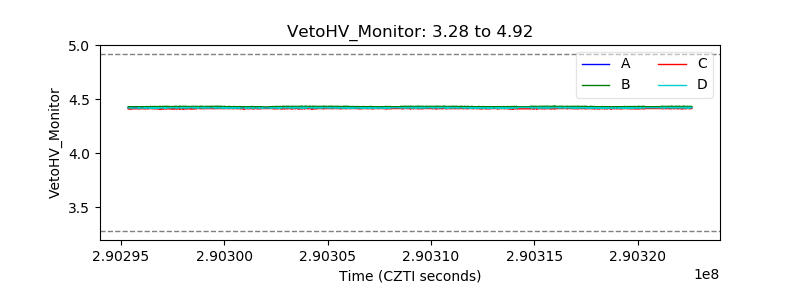 |
| Veto LLD | 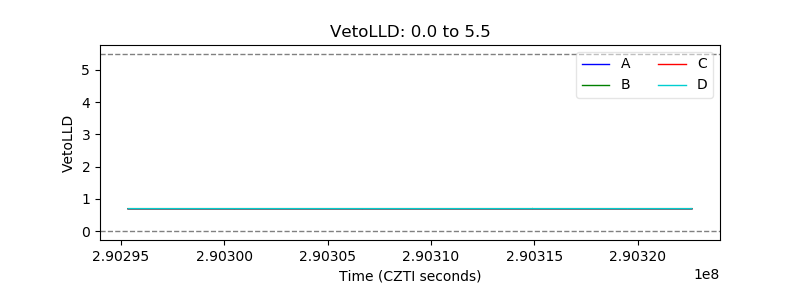 |
| Alpha Counter | 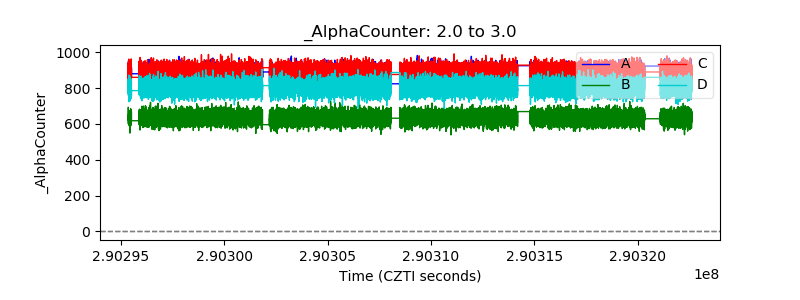 |
| _CPM_Rate | 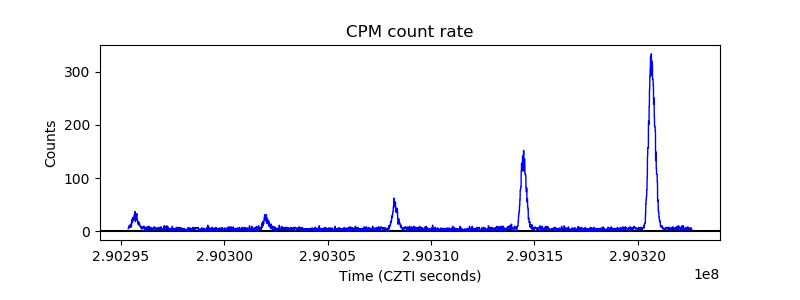 |
| CZT Counter | 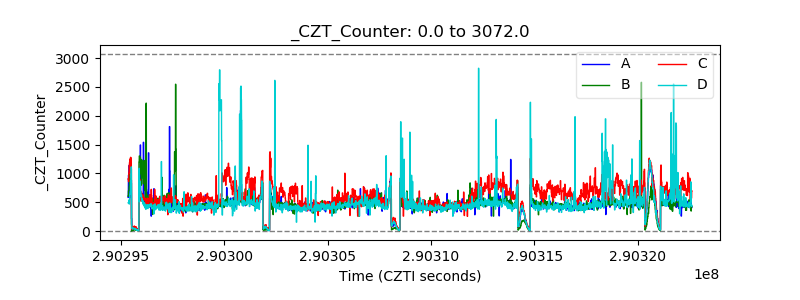 |
| +2.5 Volts monitor |  |
| +5 Volts monitor | 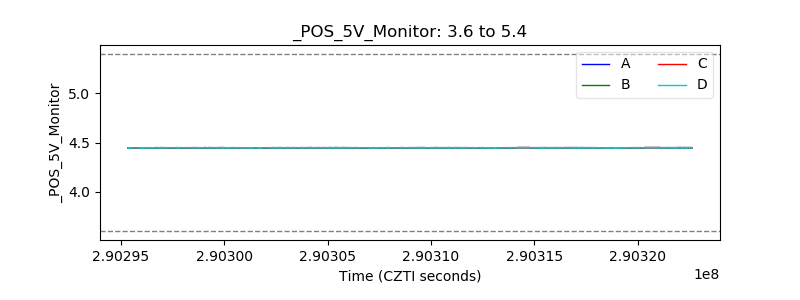 |
| _ROLL_ROT | 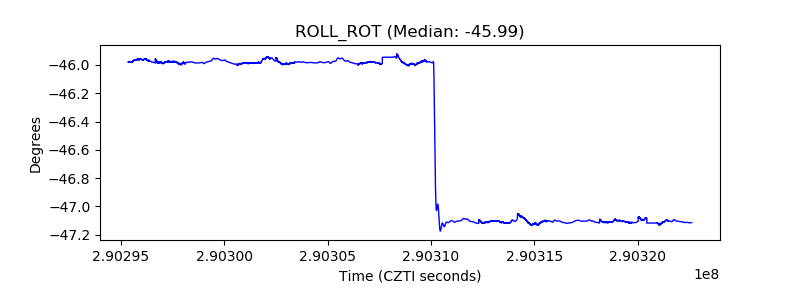 |
| _Roll_DEC | 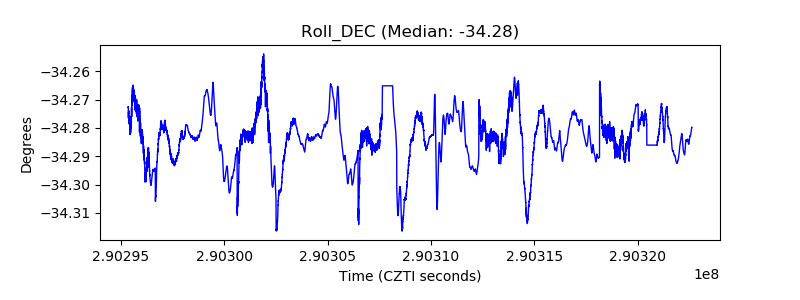 |
| _Roll_RA | 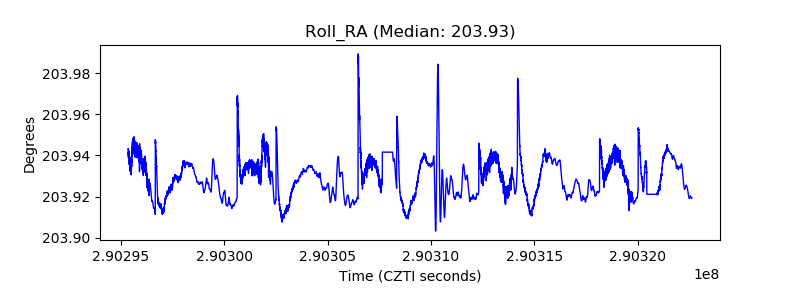 |
| Veto Counter | 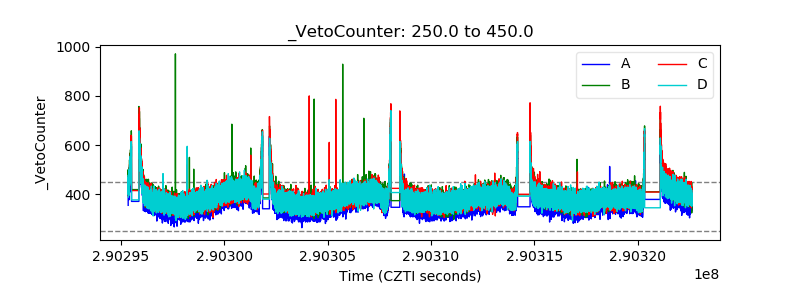 |