| Param | Original file | Final file |
|---|---|---|
| Filename | modeM0/AS1A05_165T07_9000002796_18710cztM0_level2.evt | modeM0/AS1A05_165T07_9000002796_18710cztM0_level2_quad_clean.evt |
| Size (bytes) | 494,835,840 | 78,376,320 |
| Size | 471.9 MB | 74.7 MB |
| Events in quadrant A | 2,915,801 | 493,362 |
| Events in quadrant B | 2,974,879 | 503,690 |
| Events in quadrant C | 5,078,131 | 472,180 |
| Events in quadrant D | 3,595,834 | 470,151 |
| Mode M9 | |||
|---|---|---|---|
| Quadrant | BADHDUFLAG | Total packets | Discarded packets |
| A | 0 | 9 | 0 |
| B | 0 | 9 | 0 |
| C | 0 | 9 | 0 |
| D | 0 | 9 | 0 |
| Mode M0 | |||
|---|---|---|---|
| Quadrant | BADHDUFLAG | Total packets | Discarded packets |
| A | 0 | 12580 | 1 |
| B | 0 | 12693 | 1 |
| C | 0 | 19580 | 1 |
| D | 0 | 14756 | 1 |
| Mode SS | |||
|---|---|---|---|
| Quadrant | BADHDUFLAG | Total packets | Discarded packets |
| A | 0 | 126 | 0 |
| B | 0 | 126 | 0 |
| C | 0 | 126 | 0 |
| D | 0 | 126 | 0 |
| Quadrant | Total seconds | Saturated seconds | Saturation percentage |
|---|---|---|---|
| A | 6206 | 31 | 0.499517% |
| B | 6207 | 33 | 0.531658% |
| C | 6207 | 191 | 3.077171% |
| D | 6207 | 126 | 2.029966% |
Noise dominated data is calculated using 1-second bins in cleaned event files. If a bin has >2000 counts, and if more than 50% of those come from <1% of pixels, then it is considered to be noise-dominated and hence unusable.
| Quadrant | # 1 sec bins | Bins with >0 counts | Bins with >2000 counts | High rate bins dominated by noise | Noise dominated (total time) | Noise dominated (detector-on time) | Marked lightcurve |
|---|---|---|---|---|---|---|---|
| A | 7131 | 6207 | 0 | 0 | 0.00% | 0.00% | 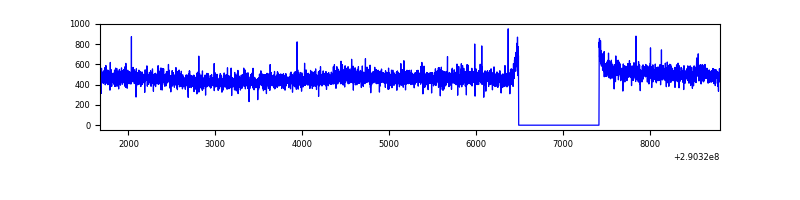 |
| B | 7132 | 6208 | 0 | 0 | 0.00% | 0.00% | 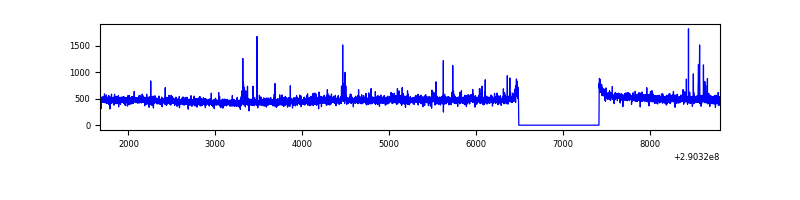 |
| C | 7132 | 6207 | 40 | 40 | 0.56% | 0.64% | 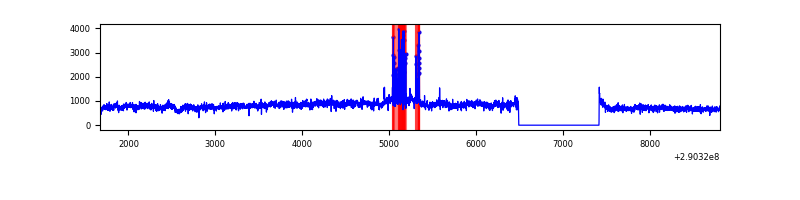 |
| D | 7132 | 6208 | 101 | 101 | 1.42% | 1.63% | 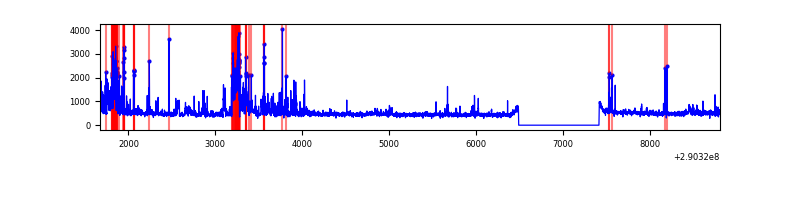 |
Top three noisy pixels from each quadrant. If the there are fewer than three noisy pixels in the level2.evt file, extra rows are filled as -1
| Pixel properties | Quadrant properties | ||||||
|---|---|---|---|---|---|---|---|
| Quadrant | DetID | PixID | Counts | Sigma | Mean | Median | Sigma |
| A | 14 | 111 | 11440 | 70.06 | 749 | 734 | 152.8 |
| A | 0 | 13 | 9339 | 56.31 | 749 | 734 | 152.8 |
| A | 13 | 254 | 8350 | 49.84 | 749 | 734 | 152.8 |
| B | 12 | 111 | 17323 | 114.47 | 747 | 728 | 145.0 |
| B | 3 | 64 | 17049 | 112.58 | 747 | 728 | 145.0 |
| B | 11 | 111 | 15346 | 100.83 | 747 | 728 | 145.0 |
| C | 3 | 233 | 2147120 | 12725.28 | 721 | 725 | 168.7 |
| C | 14 | 238 | 110800 | 652.6 | 721 | 725 | 168.7 |
| C | 9 | 54 | 10008 | 55.04 | 721 | 725 | 168.7 |
| D | 1 | 52 | 554789 | 3096.76 | 733 | 712 | 178.9 |
| D | 7 | 238 | 230138 | 1282.27 | 733 | 712 | 178.9 |
| D | 2 | 234 | 26442 | 143.81 | 733 | 712 | 178.9 |
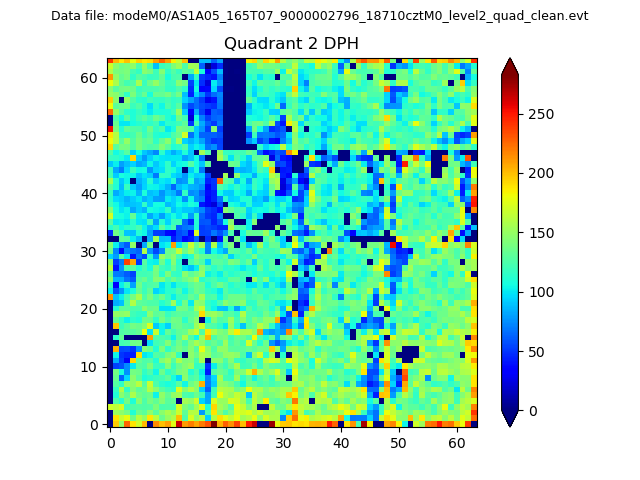
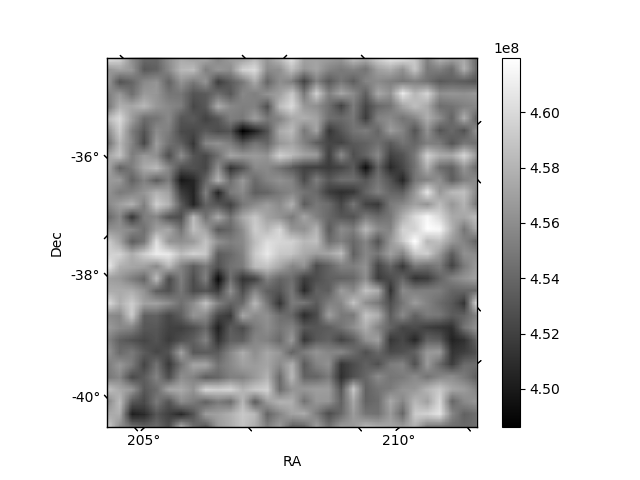
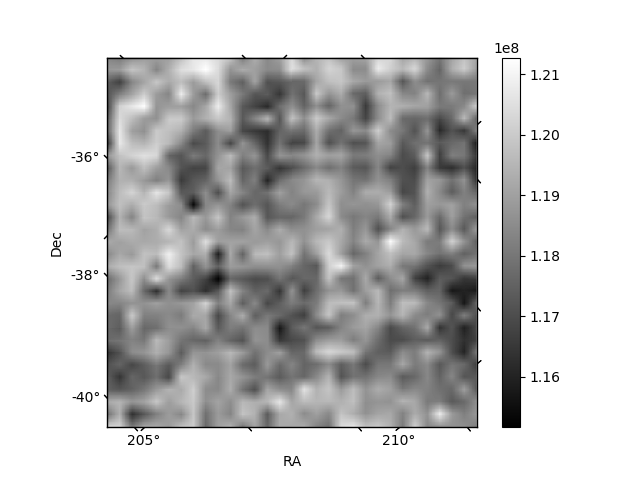
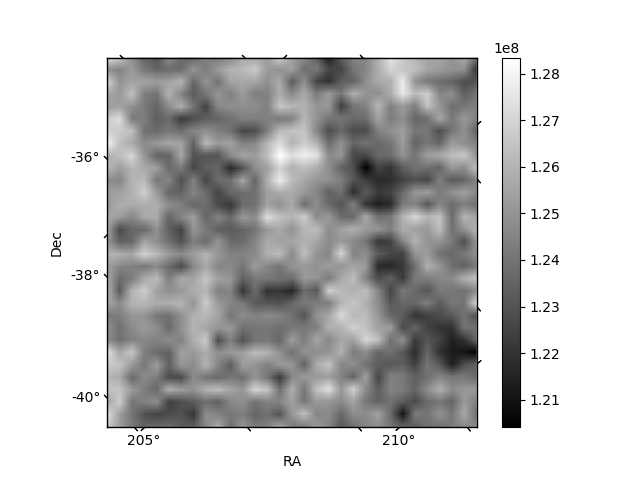
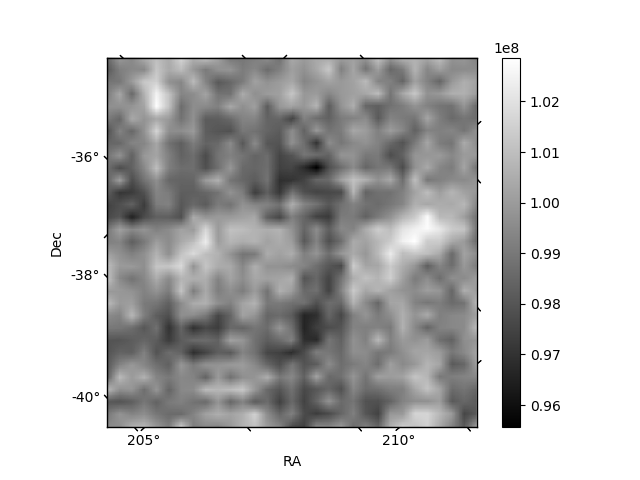
Histogram calculated using DETX and DETY for each event in the final _common_clean file
| Quadrant A | 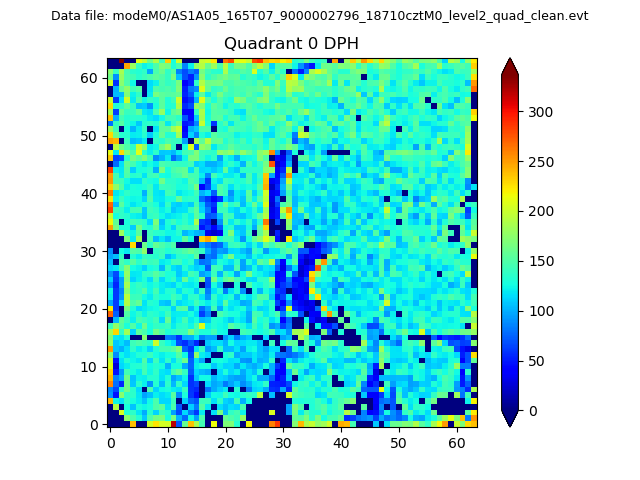 |
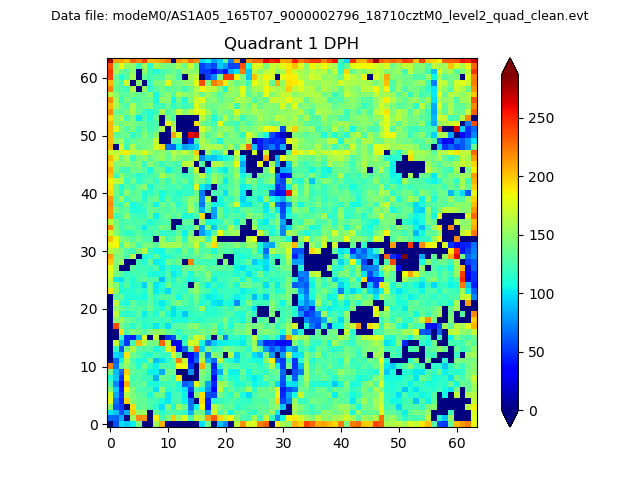 |
Quadrant B |
|---|---|---|---|
| Quadrant D | 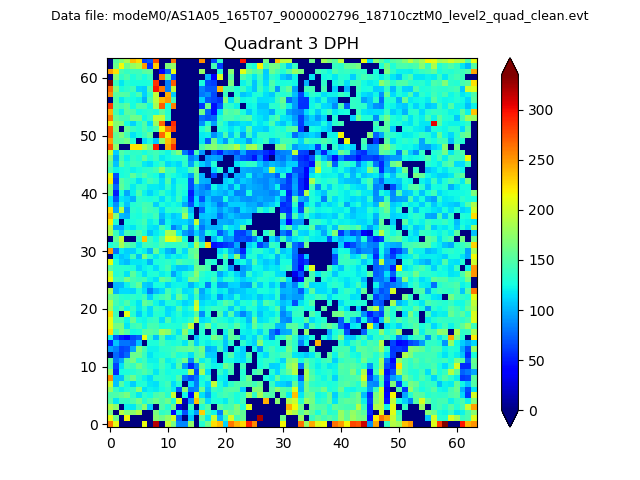 |
 |
Quadrant C |
| Plot type | Count rate plots | Images |
|---|---|---|
| Comparison with Poisson distribution Blue bars denote a histogram of data divided into 1 sec bins. Red curve is a Poisson curve with rate = median count rate of data. |
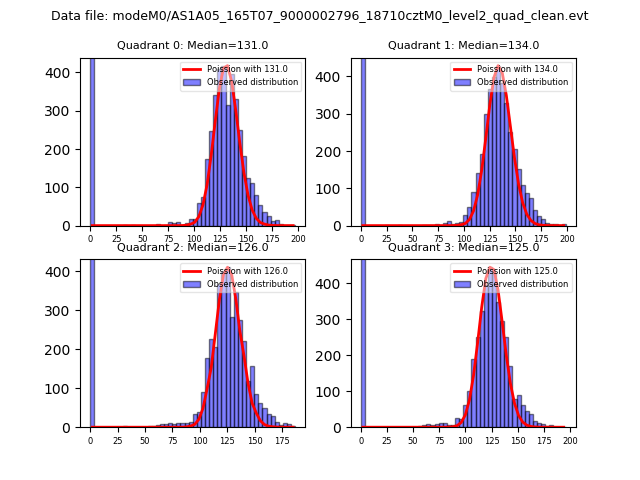 |
 |
| Quadrant-wise count rates Data is divided into 100 sec bins |
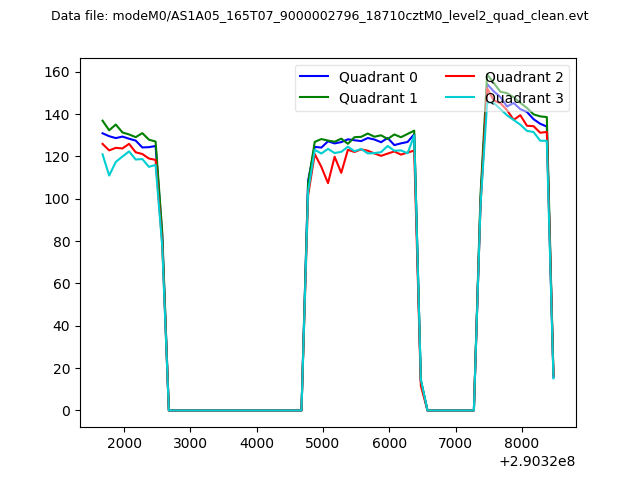 |
|
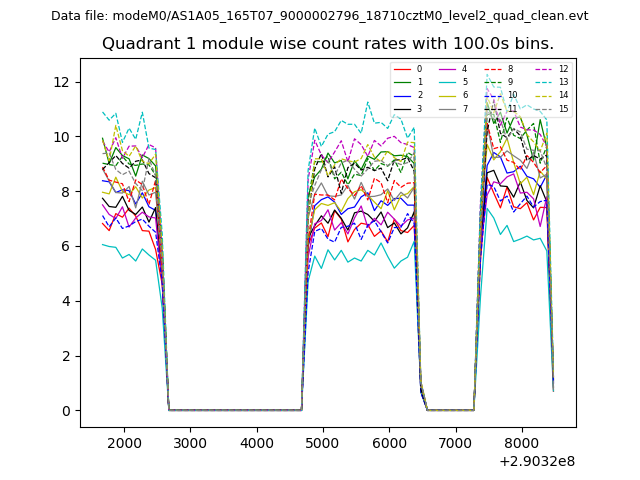
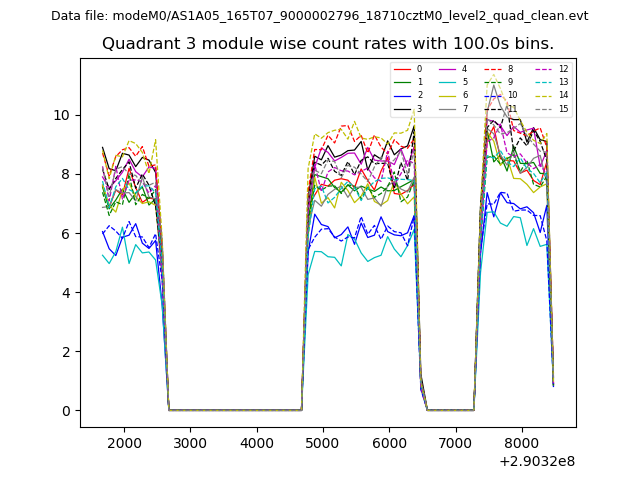
| Module-wise count rates for Quadrant A Data is divided into 100 sec bins |
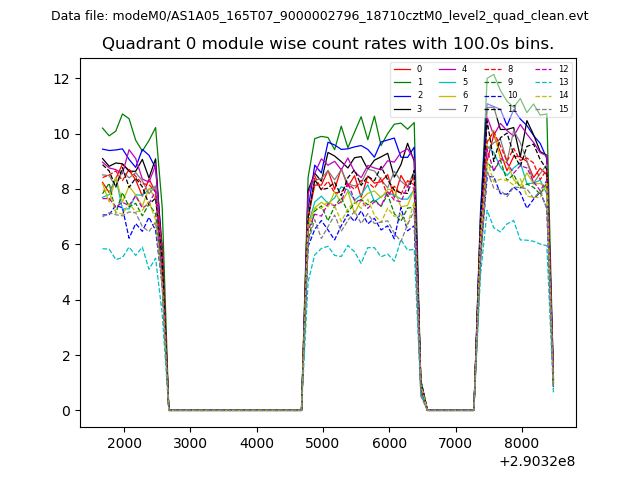 |
 |
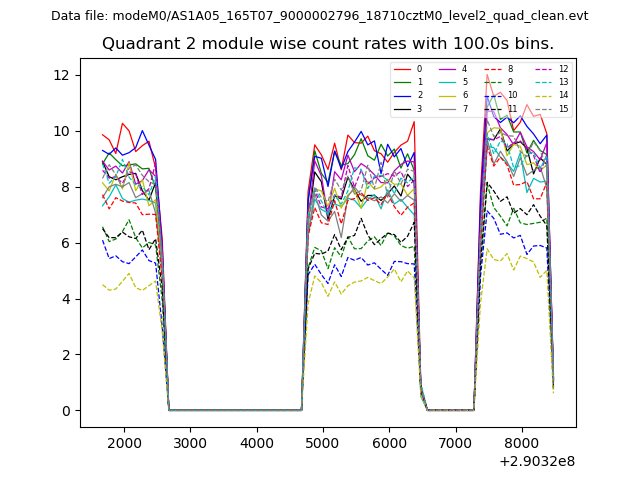
| Module-wise count rates for Quadrant B Data is divided into 100 sec bins |
 |
 |
| Module-wise count rates for Quadrant C Data is divided into 100 sec bins |
 |
 |
| Module-wise count rates for Quadrant D Data is divided into 100 sec bins |
 |
 |
| Parameter | Plot |
|---|---|
| CZT HV Monitor | 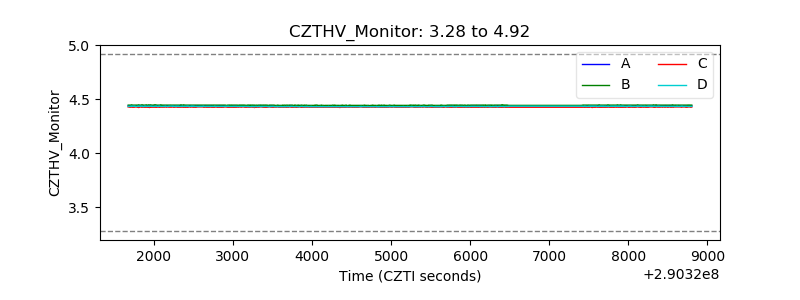 |
| D_VDD | 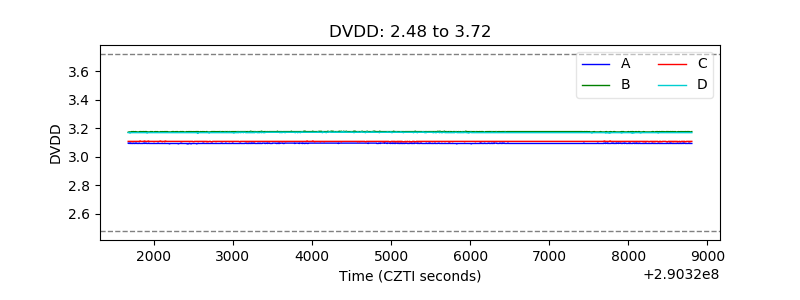 |
| Temperature 1 | 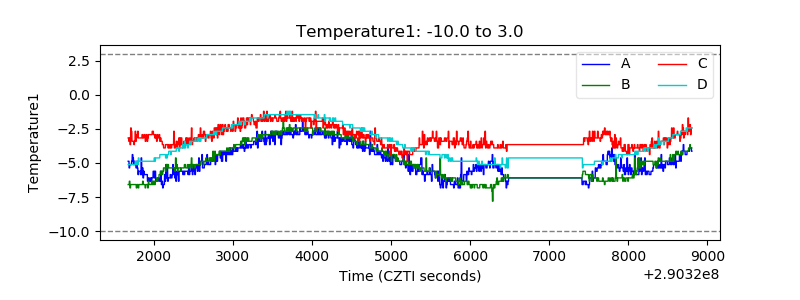 |
| Veto HV Monitor | 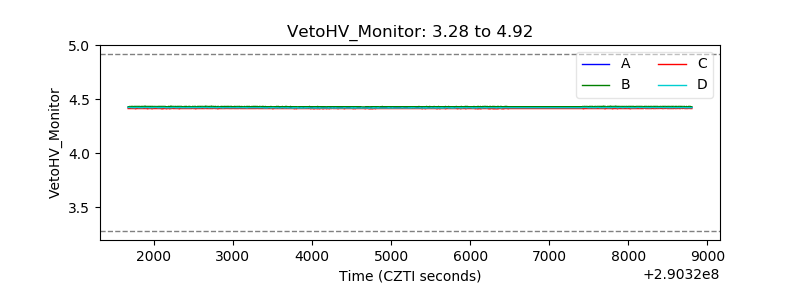 |
| Veto LLD | 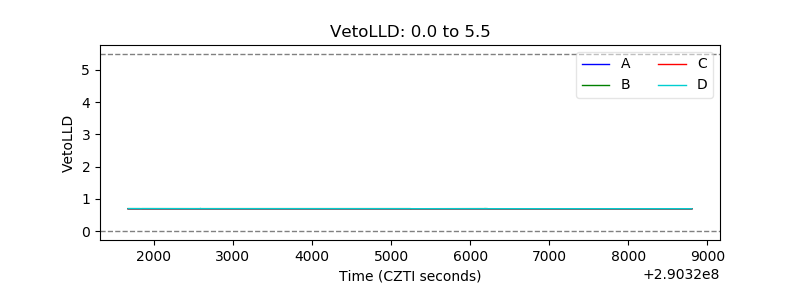 |
| Alpha Counter | 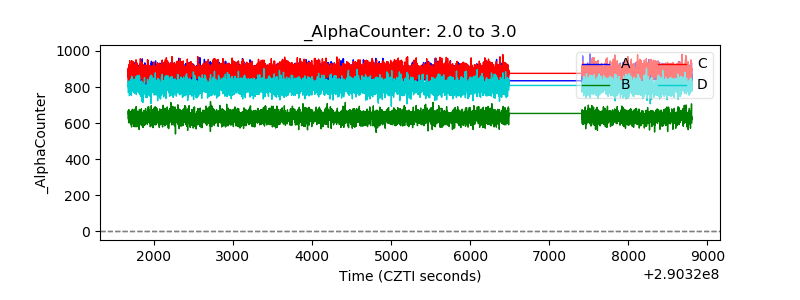 |
| _CPM_Rate | 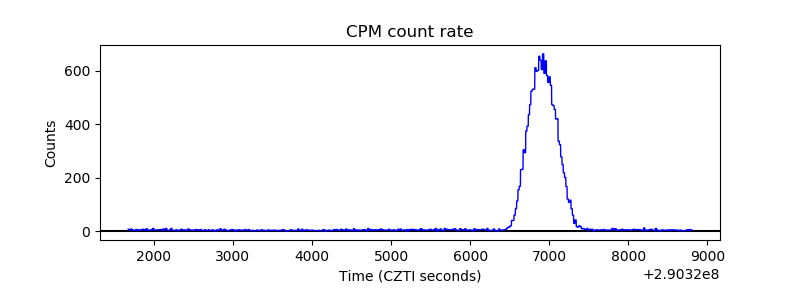 |
| CZT Counter | 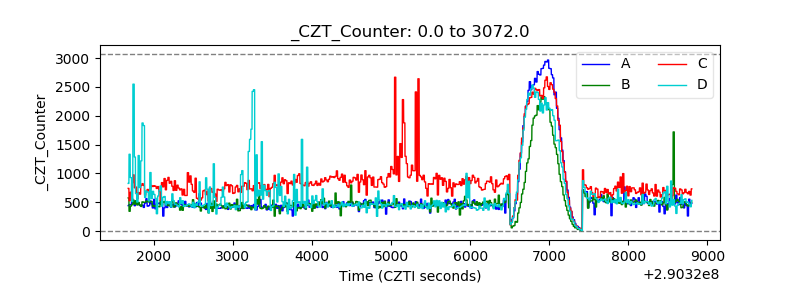 |
| +2.5 Volts monitor |  |
| +5 Volts monitor |  |
| _ROLL_ROT | 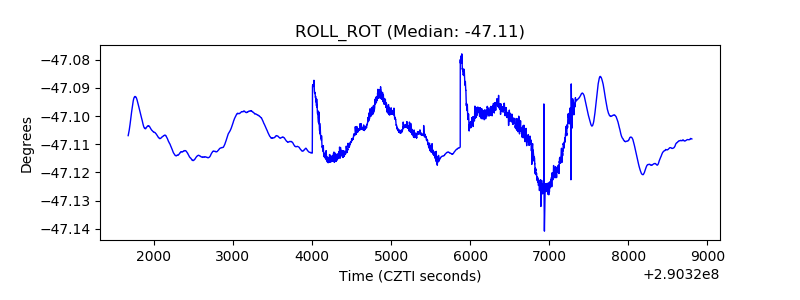 |
| _Roll_DEC | 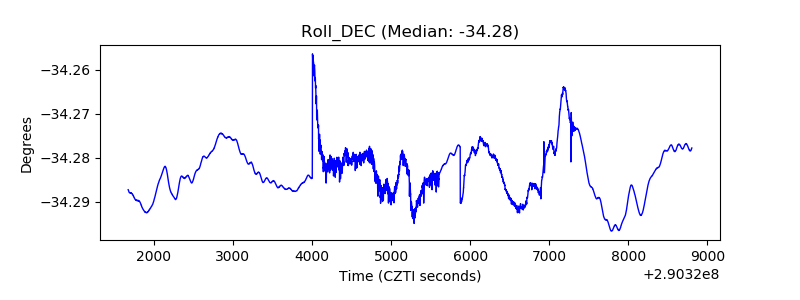 |
| _Roll_RA | 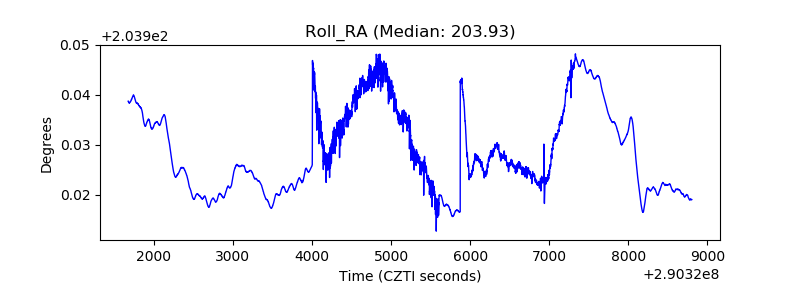 |
| Veto Counter | 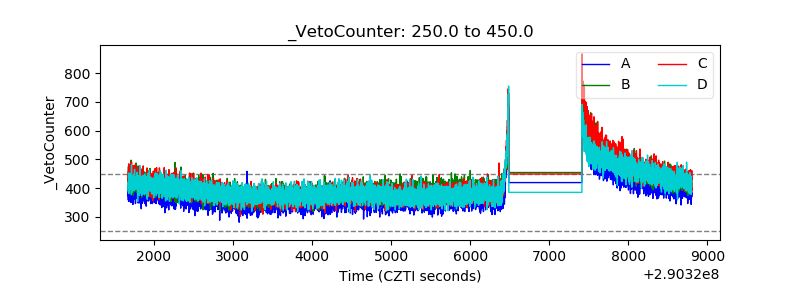 |