| Param | Original file | Final file |
|---|---|---|
| Filename | modeM0/AS1A05_165T07_9000002796_18713cztM0_level2.evt | modeM0/AS1A05_165T07_9000002796_18713cztM0_level2_quad_clean.evt |
| Size (bytes) | 479,136,960 | 74,413,440 |
| Size | 456.9 MB | 71.0 MB |
| Events in quadrant A | 3,296,143 | 458,830 |
| Events in quadrant B | 3,437,157 | 466,731 |
| Events in quadrant C | 4,077,231 | 445,601 |
| Events in quadrant D | 3,269,017 | 438,899 |
| Mode M9 | |||
|---|---|---|---|
| Quadrant | BADHDUFLAG | Total packets | Discarded packets |
| A | 0 | 15 | 0 |
| B | 0 | 16 | 0 |
| C | 0 | 16 | 0 |
| D | 0 | 16 | 0 |
| Mode M0 | |||
|---|---|---|---|
| Quadrant | BADHDUFLAG | Total packets | Discarded packets |
| A | 0 | 13788 | 2 |
| B | 0 | 14172 | 2 |
| C | 0 | 16480 | 2 |
| D | 0 | 13988 | 2 |
| Mode SS | |||
|---|---|---|---|
| Quadrant | BADHDUFLAG | Total packets | Discarded packets |
| A | 0 | 130 | 0 |
| B | 0 | 130 | 0 |
| C | 0 | 130 | 0 |
| D | 0 | 130 | 0 |
| Quadrant | Total seconds | Saturated seconds | Saturation percentage |
|---|---|---|---|
| A | 6347 | 82 | 1.291949% |
| B | 6347 | 113 | 1.780369% |
| C | 6347 | 137 | 2.158500% |
| D | 6347 | 99 | 1.559792% |
Noise dominated data is calculated using 1-second bins in cleaned event files. If a bin has >2000 counts, and if more than 50% of those come from <1% of pixels, then it is considered to be noise-dominated and hence unusable.
| Quadrant | # 1 sec bins | Bins with >0 counts | Bins with >2000 counts | High rate bins dominated by noise | Noise dominated (total time) | Noise dominated (detector-on time) | Marked lightcurve |
|---|---|---|---|---|---|---|---|
| A | 7502 | 6347 | 4 | 4 | 0.05% | 0.06% | 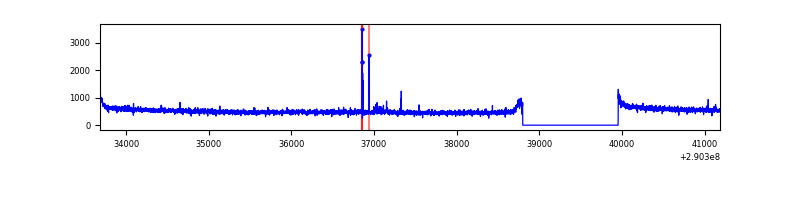 |
| B | 7502 | 6347 | 22 | 22 | 0.29% | 0.35% | 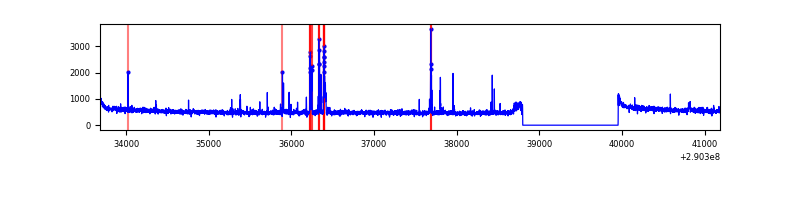 |
| C | 7502 | 6347 | 0 | 0 | 0.00% | 0.00% | 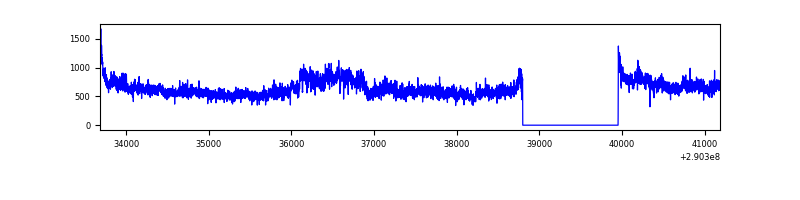 |
| D | 7502 | 6347 | 27 | 27 | 0.36% | 0.43% | 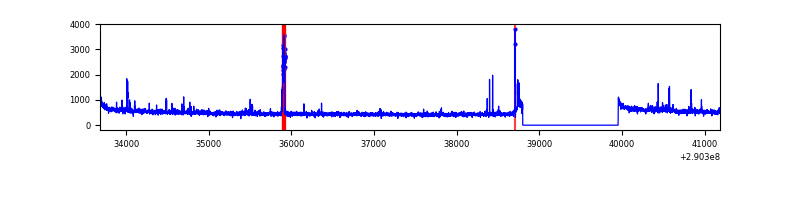 |
Top three noisy pixels from each quadrant. If the there are fewer than three noisy pixels in the level2.evt file, extra rows are filled as -1
| Pixel properties | Quadrant properties | ||||||
|---|---|---|---|---|---|---|---|
| Quadrant | DetID | PixID | Counts | Sigma | Mean | Median | Sigma |
| A | 9 | 143 | 34715 | 203.11 | 838 | 822 | 166.9 |
| A | 14 | 111 | 18466 | 105.73 | 838 | 822 | 166.9 |
| A | 13 | 254 | 8562 | 46.38 | 838 | 822 | 166.9 |
| B | 3 | 64 | 107733 | 678.28 | 832 | 812 | 157.6 |
| B | 0 | 230 | 36614 | 227.12 | 832 | 812 | 157.6 |
| B | 12 | 111 | 18410 | 111.64 | 832 | 812 | 157.6 |
| C | 3 | 233 | 802832 | 4310.62 | 807 | 816 | 186.1 |
| C | 14 | 238 | 125638 | 670.89 | 807 | 816 | 186.1 |
| C | 13 | 61 | 5490 | 25.12 | 807 | 816 | 186.1 |
| D | 7 | 238 | 93522 | 470.95 | 819 | 796 | 196.9 |
| D | 2 | 234 | 25075 | 123.31 | 819 | 796 | 196.9 |
| D | 13 | 104 | 23916 | 117.42 | 819 | 796 | 196.9 |
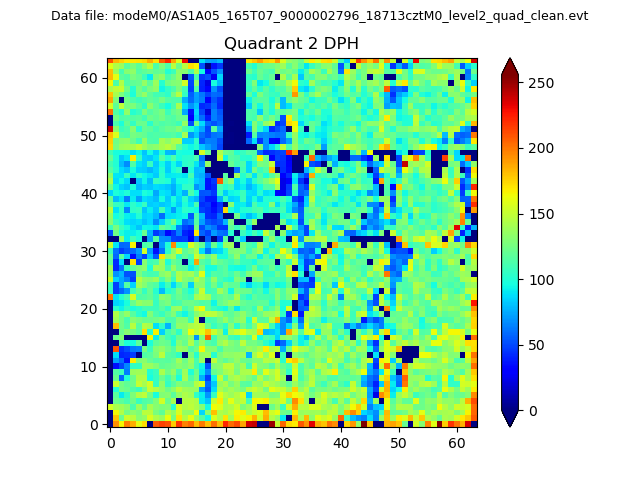
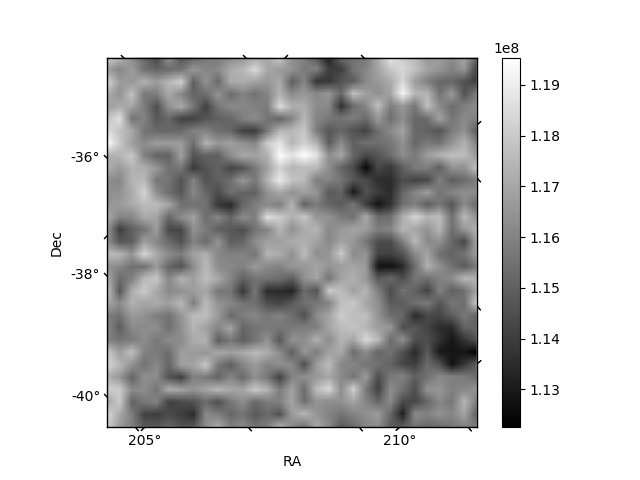
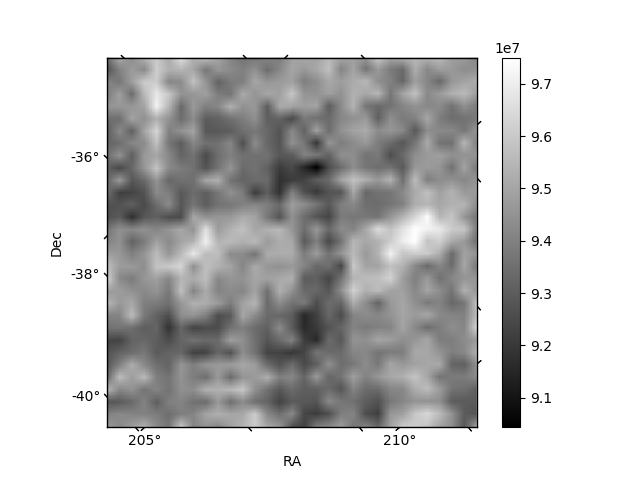
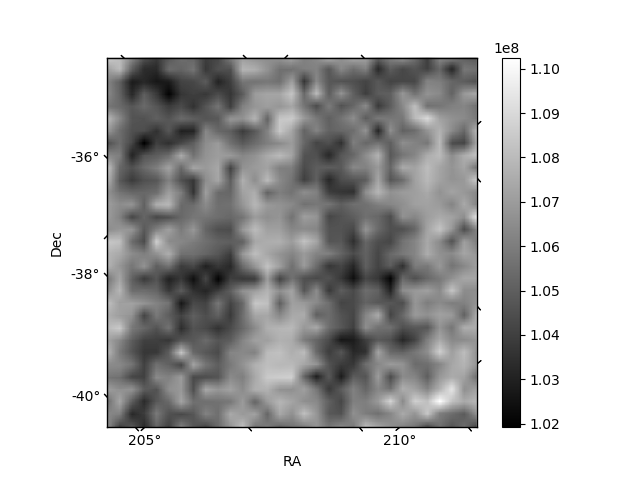
Histogram calculated using DETX and DETY for each event in the final _common_clean file
| Quadrant A | 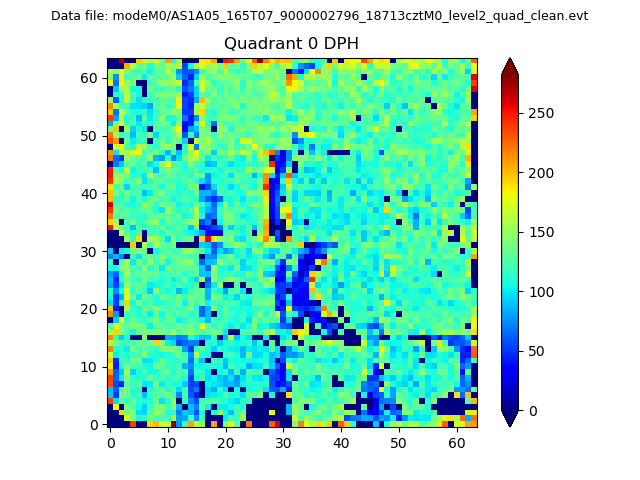 |
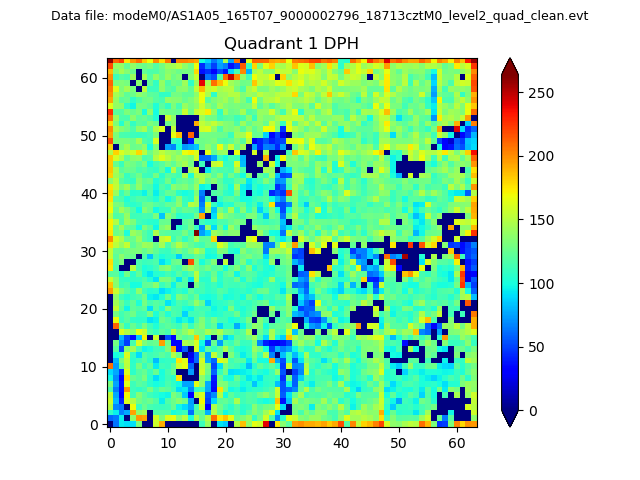 |
Quadrant B |
|---|---|---|---|
| Quadrant D | 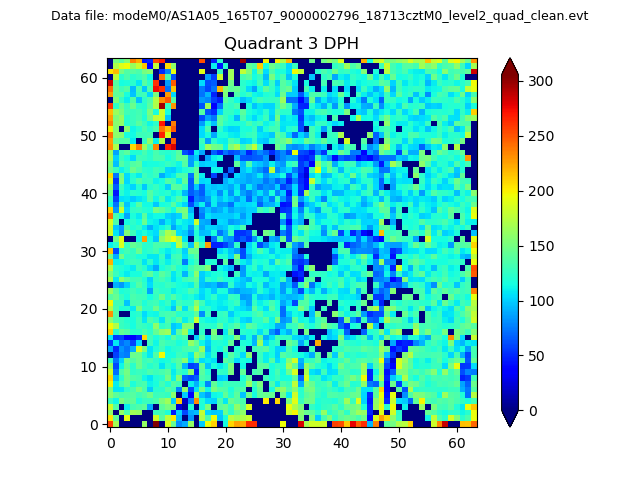 |
 |
Quadrant C |
| Plot type | Count rate plots | Images |
|---|---|---|
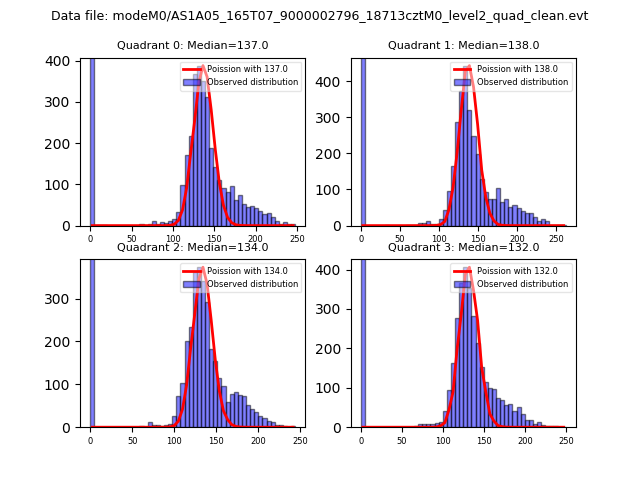
| Comparison with Poisson distribution Blue bars denote a histogram of data divided into 1 sec bins. Red curve is a Poisson curve with rate = median count rate of data. |
 |
 |
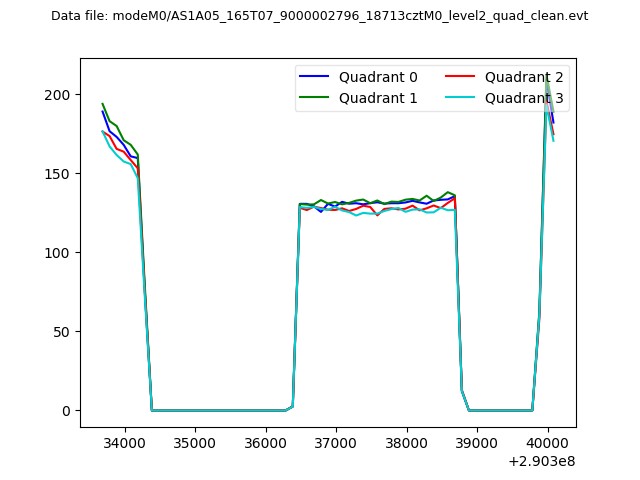
| Quadrant-wise count rates Data is divided into 100 sec bins |
 |
|
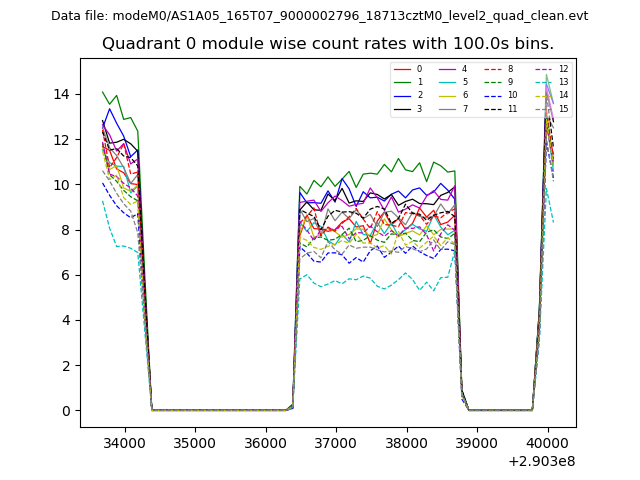
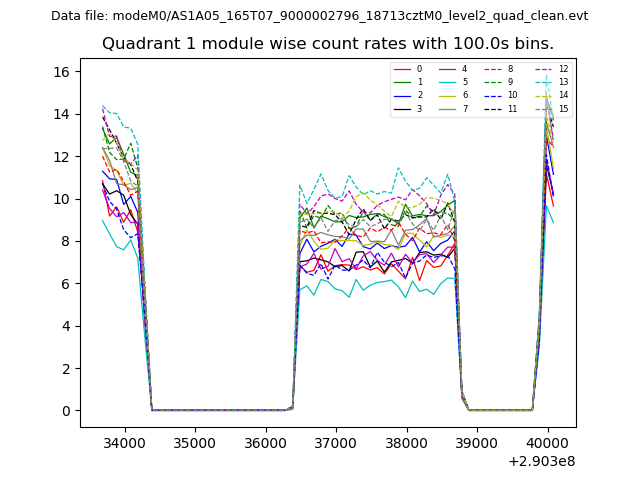
| Module-wise count rates for Quadrant A Data is divided into 100 sec bins |
 |
 |
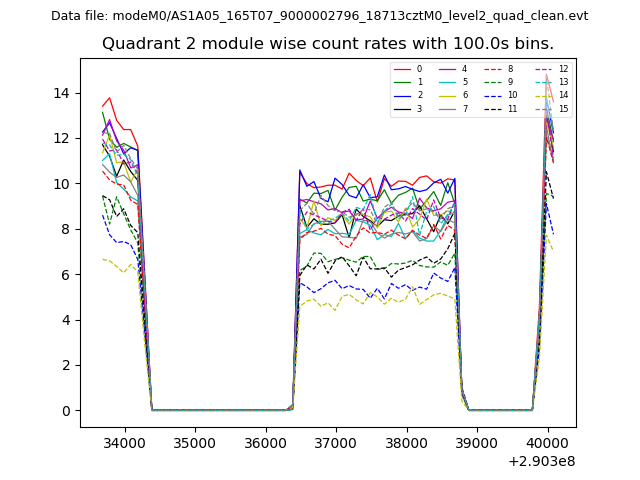
| Module-wise count rates for Quadrant B Data is divided into 100 sec bins |
 |
 |
| Module-wise count rates for Quadrant C Data is divided into 100 sec bins |
 |
 |
| Module-wise count rates for Quadrant D Data is divided into 100 sec bins |
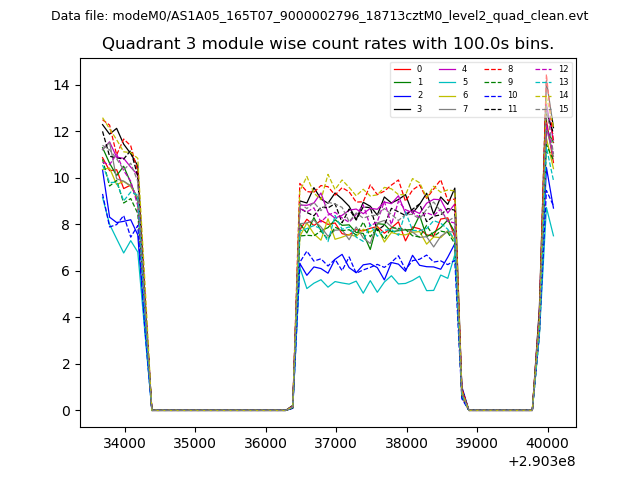 |
 |
| Parameter | Plot |
|---|---|
| CZT HV Monitor | 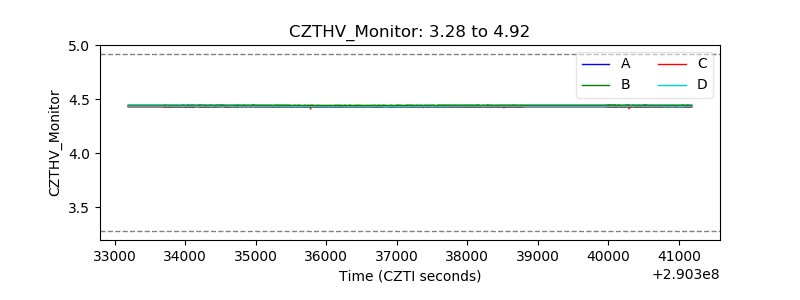 |
| D_VDD |  |
| Temperature 1 | 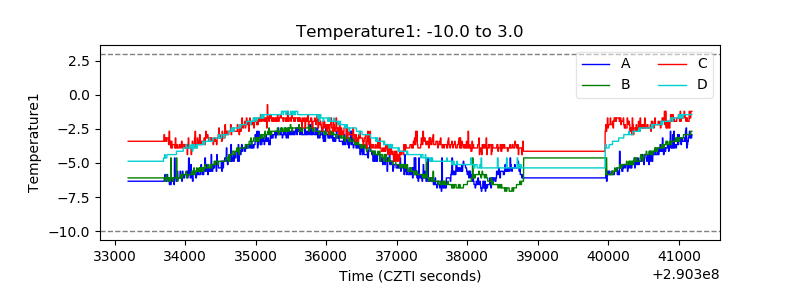 |
| Veto HV Monitor | 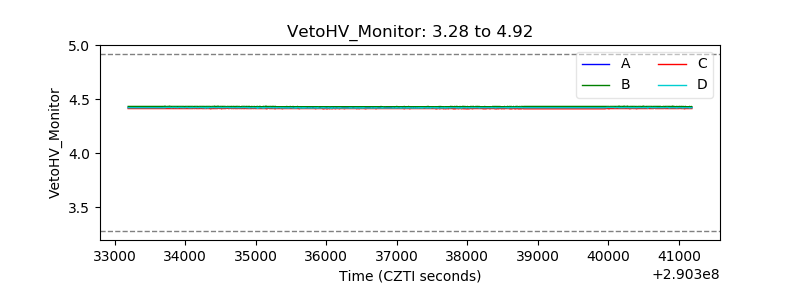 |
| Veto LLD | 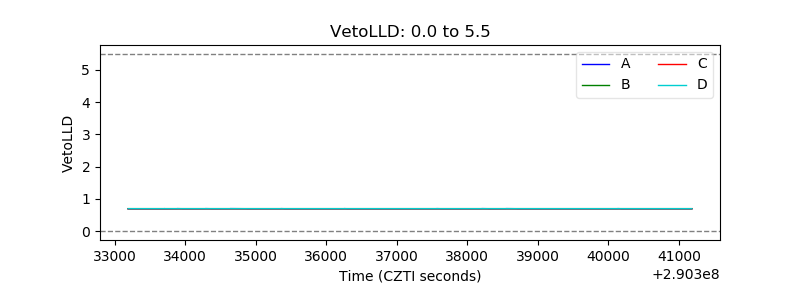 |
| Alpha Counter | 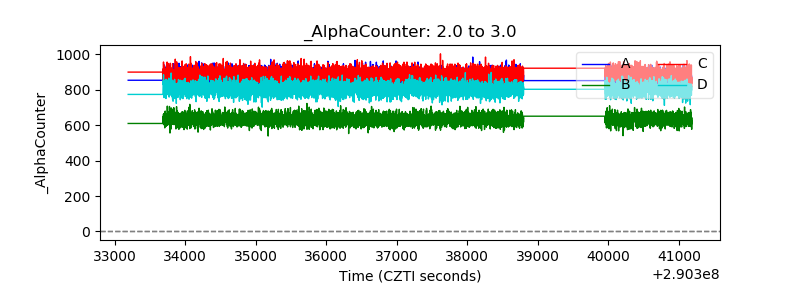 |
| _CPM_Rate | 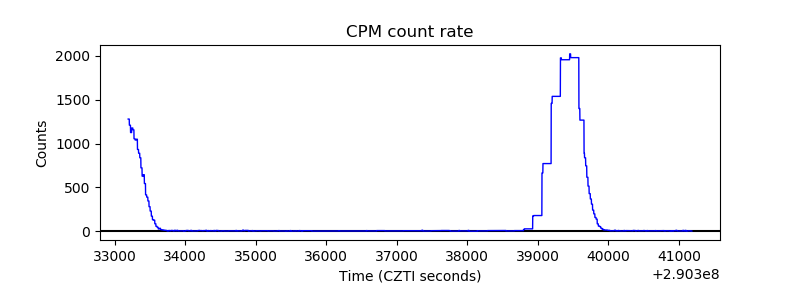 |
| CZT Counter | 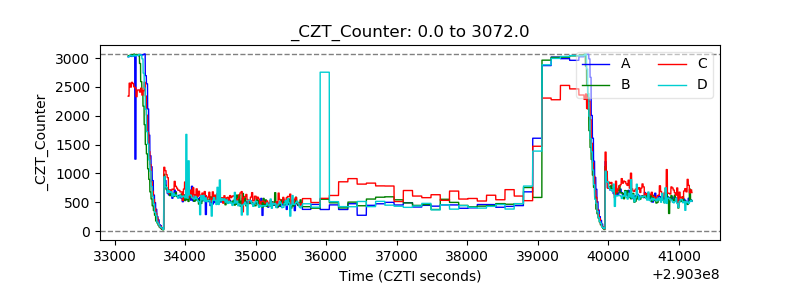 |
| +2.5 Volts monitor |  |
| +5 Volts monitor |  |
| _ROLL_ROT | 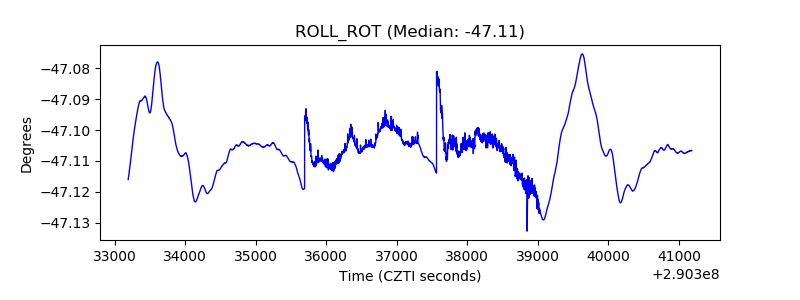 |
| _Roll_DEC | 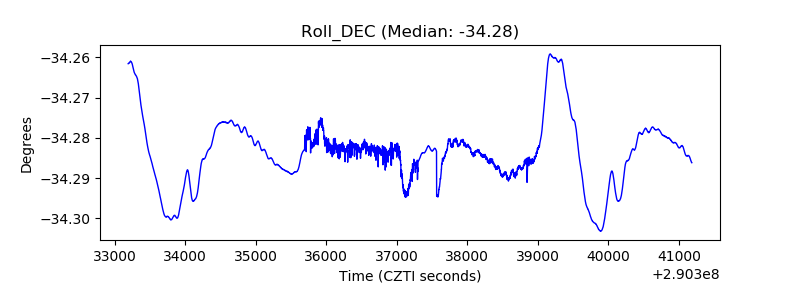 |
| _Roll_RA |  |
| Veto Counter | 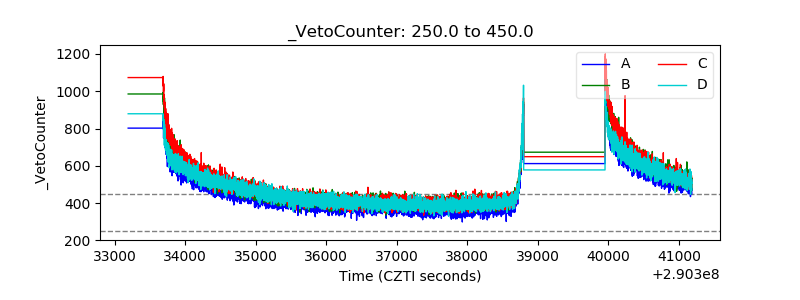 |