| Param | Original file | Final file |
|---|---|---|
| Filename | modeM0/AS1A05_165T07_9000002796_18714cztM0_level2.evt | modeM0/AS1A05_165T07_9000002796_18714cztM0_level2_quad_clean.evt |
| Size (bytes) | 537,649,920 | 68,198,400 |
| Size | 512.7 MB | 65.0 MB |
| Events in quadrant A | 3,604,286 | 406,625 |
| Events in quadrant B | 3,586,668 | 414,100 |
| Events in quadrant C | 5,046,544 | 391,537 |
| Events in quadrant D | 3,597,358 | 391,580 |
| Mode M9 | |||
|---|---|---|---|
| Quadrant | BADHDUFLAG | Total packets | Discarded packets |
| A | 0 | 15 | 0 |
| B | 0 | 16 | 0 |
| C | 0 | 16 | 0 |
| D | 0 | 16 | 0 |
| Mode M0 | |||
|---|---|---|---|
| Quadrant | BADHDUFLAG | Total packets | Discarded packets |
| A | 0 | 14827 | 2 |
| B | 0 | 14804 | 2 |
| C | 0 | 20007 | 5 |
| D | 0 | 15007 | 2 |
| Mode SS | |||
|---|---|---|---|
| Quadrant | BADHDUFLAG | Total packets | Discarded packets |
| A | 0 | 134 | 0 |
| B | 0 | 134 | 0 |
| C | 0 | 134 | 0 |
| D | 0 | 134 | 0 |
| Quadrant | Total seconds | Saturated seconds | Saturation percentage |
|---|---|---|---|
| A | 6613 | 89 | 1.345834% |
| B | 6613 | 93 | 1.406321% |
| C | 6612 | 201 | 3.039927% |
| D | 6612 | 89 | 1.346038% |
Noise dominated data is calculated using 1-second bins in cleaned event files. If a bin has >2000 counts, and if more than 50% of those come from <1% of pixels, then it is considered to be noise-dominated and hence unusable.
| Quadrant | # 1 sec bins | Bins with >0 counts | Bins with >2000 counts | High rate bins dominated by noise | Noise dominated (total time) | Noise dominated (detector-on time) | Marked lightcurve |
|---|---|---|---|---|---|---|---|
| A | 7873 | 6613 | 1 | 1 | 0.01% | 0.02% | 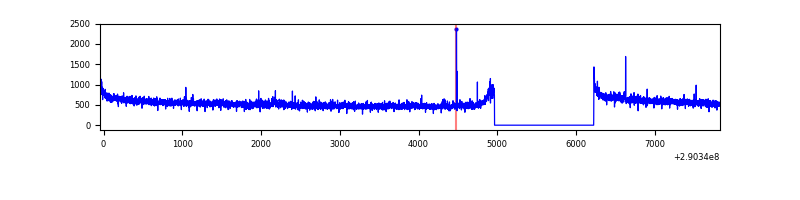 |
| B | 7873 | 6613 | 9 | 9 | 0.11% | 0.14% | 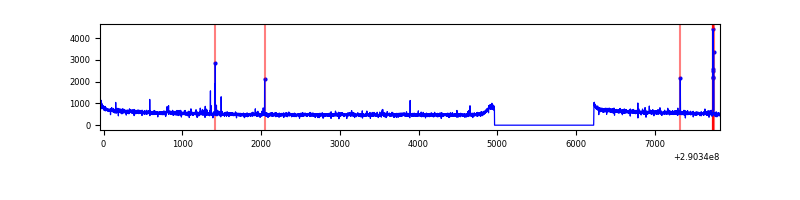 |
| C | 7872 | 6613 | 0 | 0 | 0.00% | 0.00% | 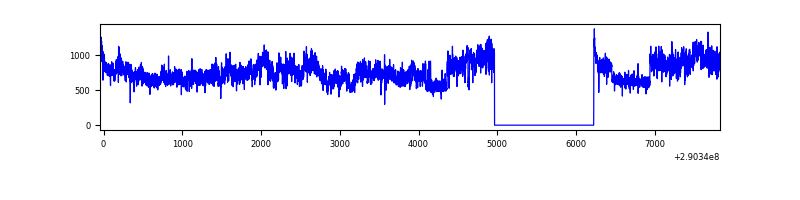 |
| D | 7872 | 6612 | 19 | 19 | 0.24% | 0.29% | 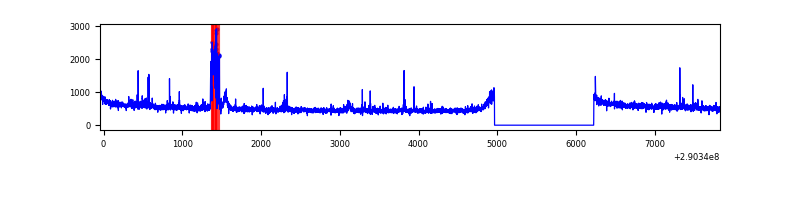 |
Top three noisy pixels from each quadrant. If the there are fewer than three noisy pixels in the level2.evt file, extra rows are filled as -1
| Pixel properties | Quadrant properties | ||||||
|---|---|---|---|---|---|---|---|
| Quadrant | DetID | PixID | Counts | Sigma | Mean | Median | Sigma |
| A | 0 | 13 | 42579 | 232.9 | 913 | 895 | 179.0 |
| A | 14 | 111 | 22417 | 120.25 | 913 | 895 | 179.0 |
| A | 9 | 143 | 14559 | 76.35 | 913 | 895 | 179.0 |
| B | 3 | 64 | 29201 | 168.62 | 902 | 880 | 168.0 |
| B | 12 | 111 | 19451 | 110.57 | 902 | 880 | 168.0 |
| B | 11 | 111 | 17258 | 97.51 | 902 | 880 | 168.0 |
| C | 3 | 233 | 1527835 | 7674.22 | 867 | 874 | 199.0 |
| C | 14 | 238 | 137627 | 687.3 | 867 | 874 | 199.0 |
| C | 13 | 61 | 6081 | 26.17 | 867 | 874 | 199.0 |
| D | 7 | 238 | 195972 | 914.26 | 886 | 862 | 213.4 |
| D | 14 | 34 | 29416 | 133.8 | 886 | 862 | 213.4 |
| D | 2 | 234 | 26152 | 118.51 | 886 | 862 | 213.4 |
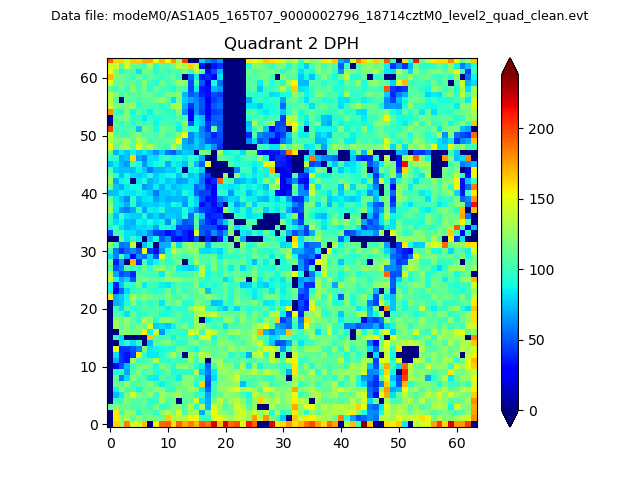
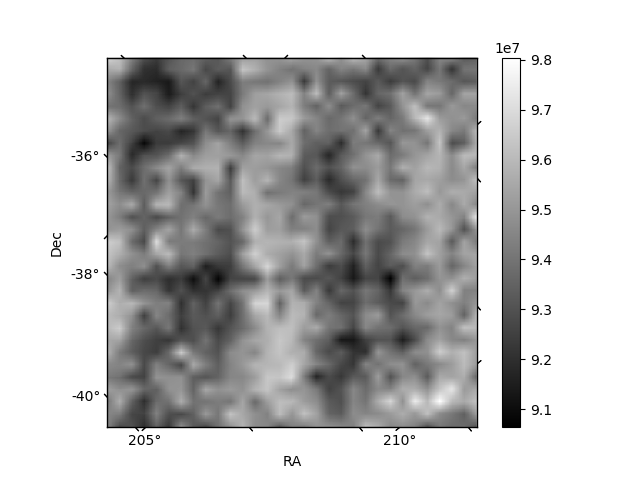
Histogram calculated using DETX and DETY for each event in the final _common_clean file
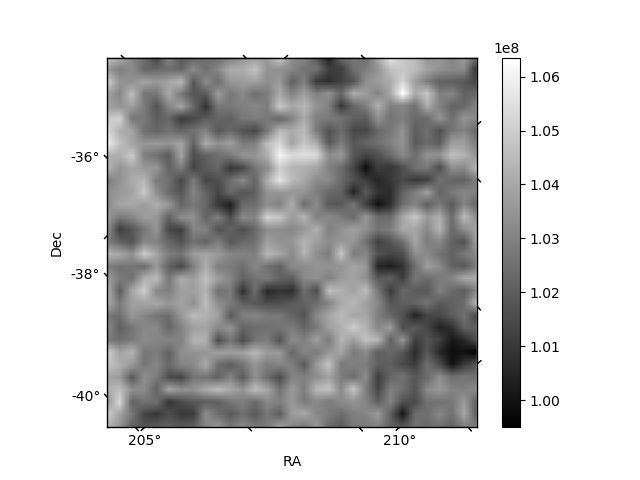
| Quadrant A | 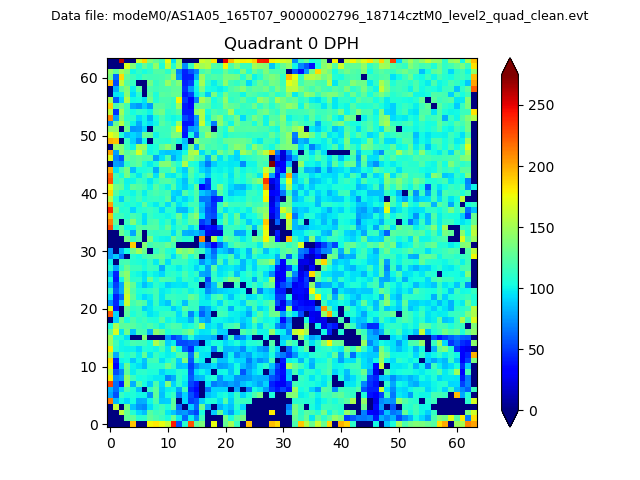 |
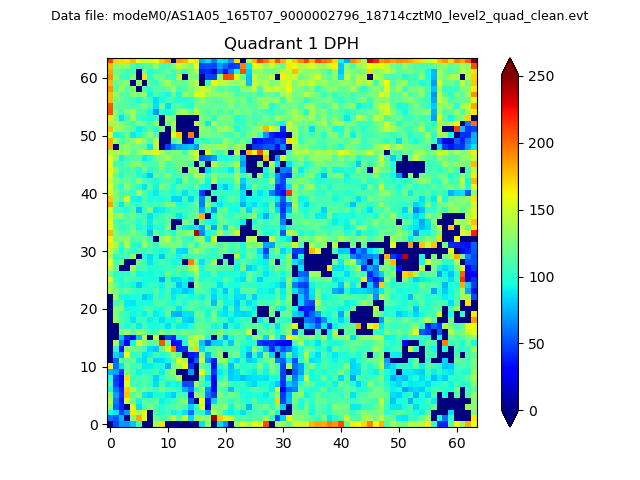 |
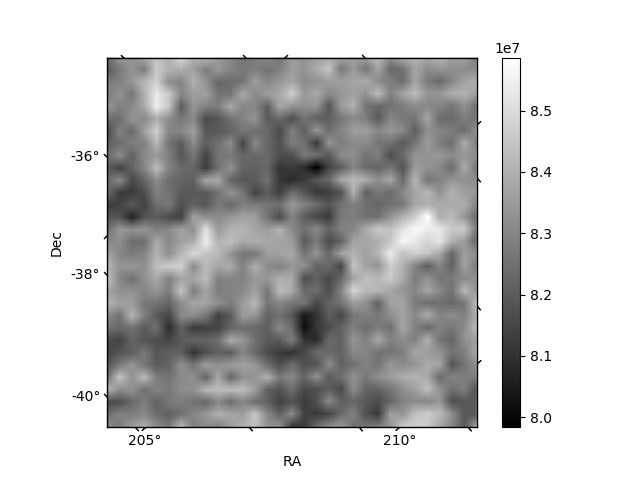
Quadrant B |
|---|---|---|---|
| Quadrant D | 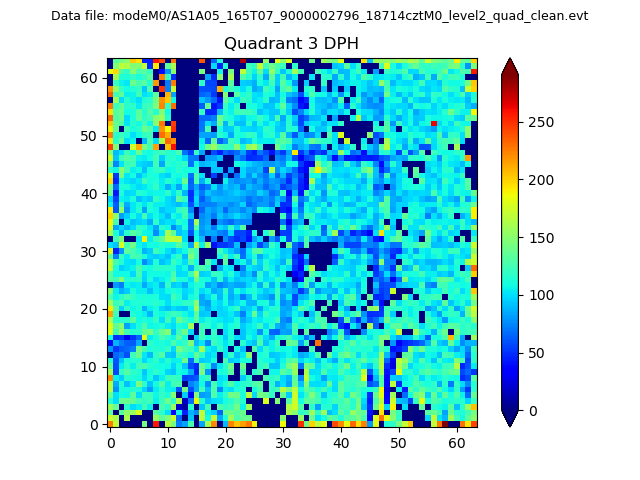 |
 |
Quadrant C |
| Plot type | Count rate plots | Images |
|---|---|---|
| Comparison with Poisson distribution Blue bars denote a histogram of data divided into 1 sec bins. Red curve is a Poisson curve with rate = median count rate of data. |
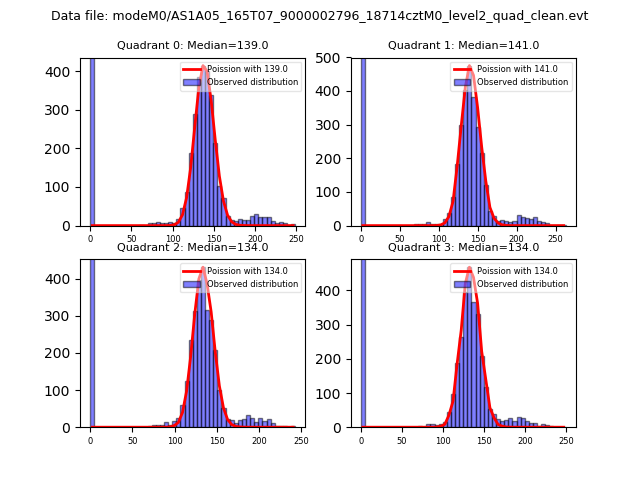 |
 |
| Quadrant-wise count rates Data is divided into 100 sec bins |
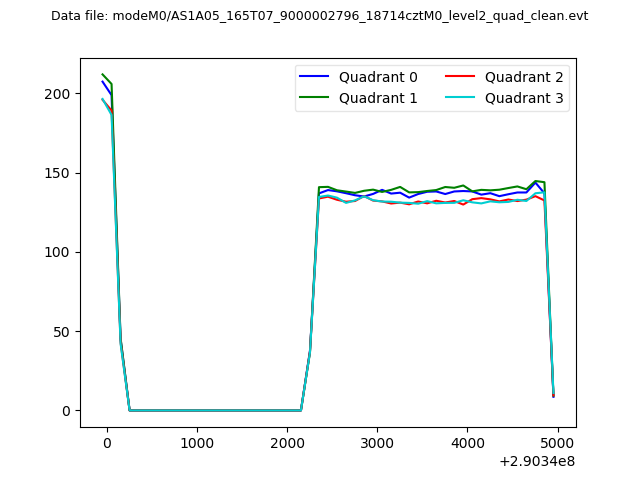 |
|
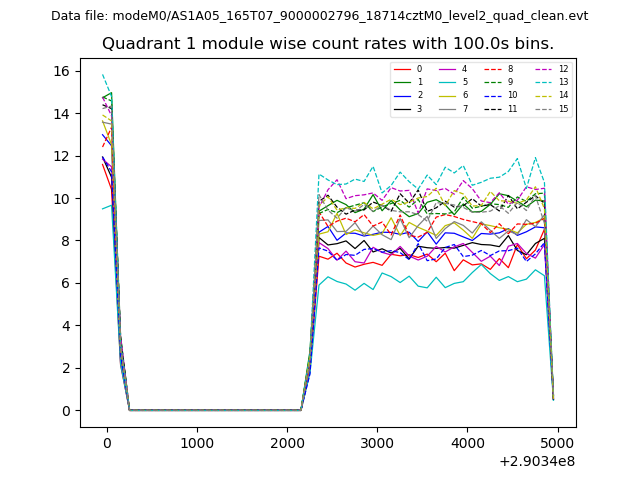
| Module-wise count rates for Quadrant A Data is divided into 100 sec bins |
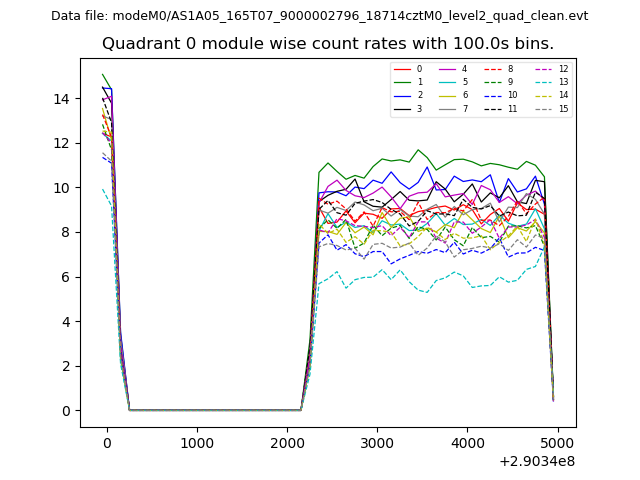 |
 |
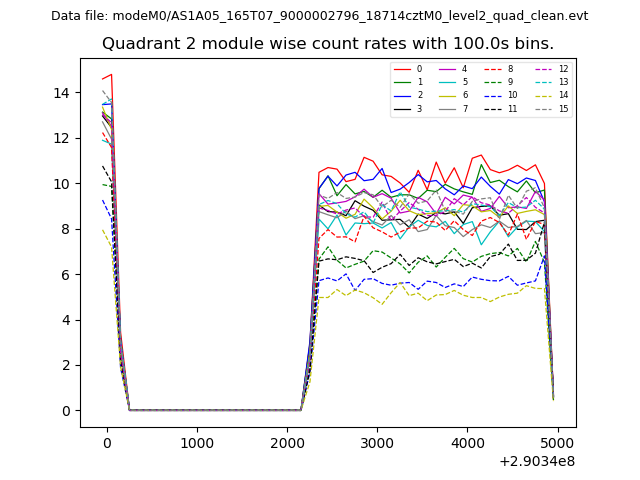
| Module-wise count rates for Quadrant B Data is divided into 100 sec bins |
 |
 |
| Module-wise count rates for Quadrant C Data is divided into 100 sec bins |
 |
 |
| Module-wise count rates for Quadrant D Data is divided into 100 sec bins |
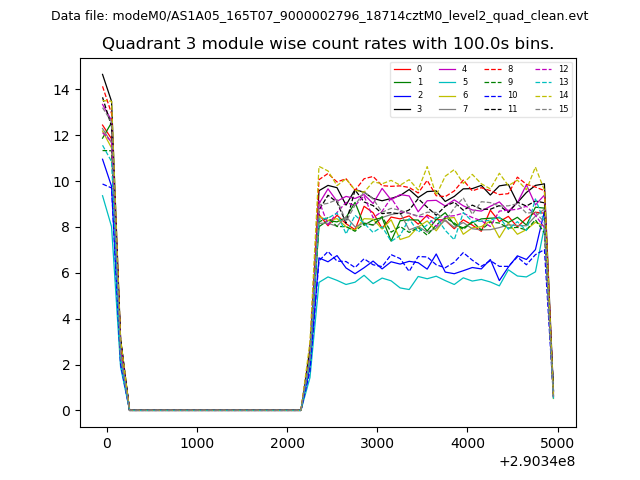 |
 |
| Parameter | Plot |
|---|---|
| CZT HV Monitor | 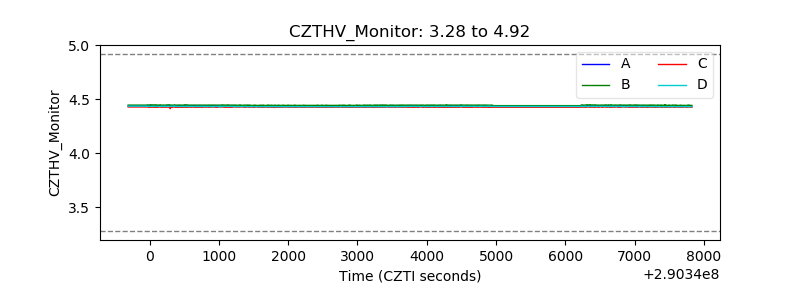 |
| D_VDD | 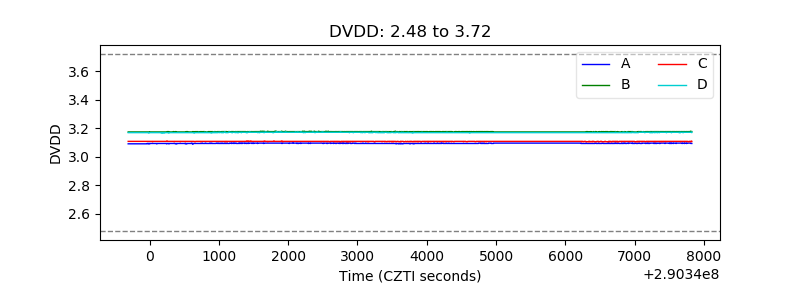 |
| Temperature 1 | 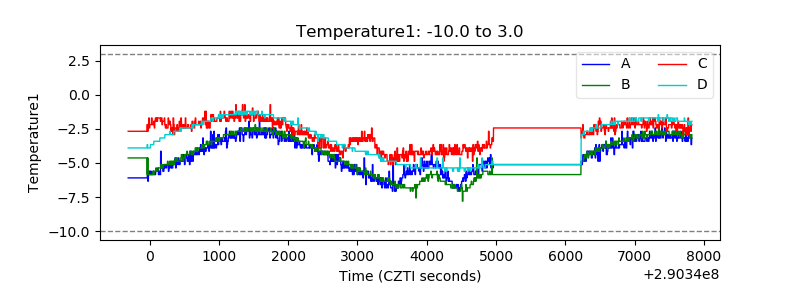 |
| Veto HV Monitor | 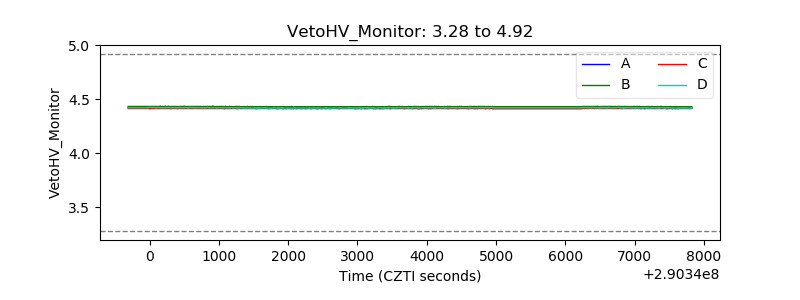 |
| Veto LLD | 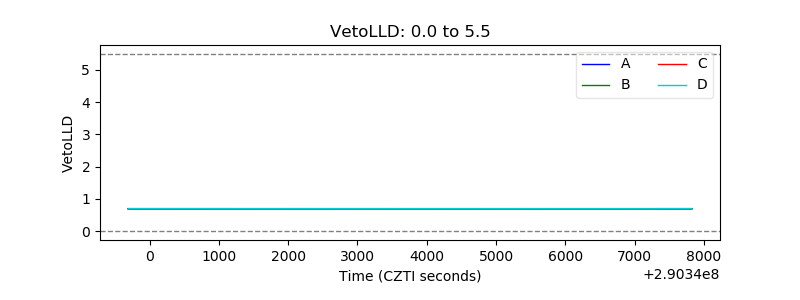 |
| Alpha Counter | 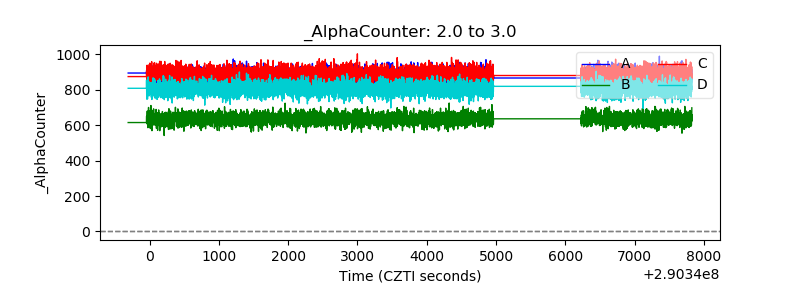 |
| _CPM_Rate | 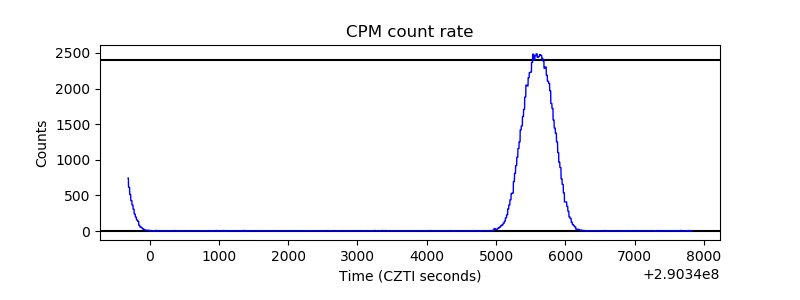 |
| CZT Counter | 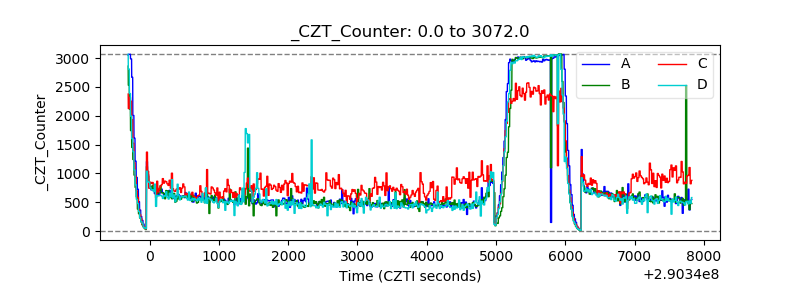 |
| +2.5 Volts monitor |  |
| +5 Volts monitor | 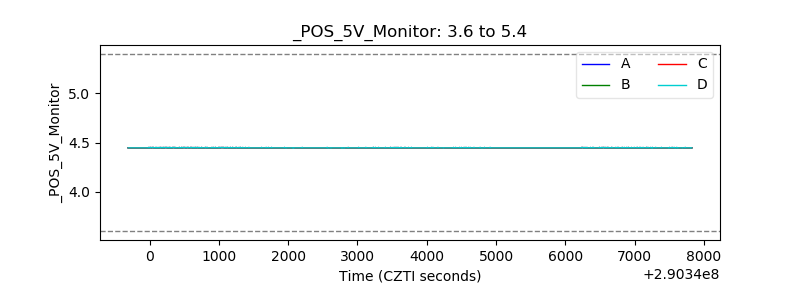 |
| _ROLL_ROT | 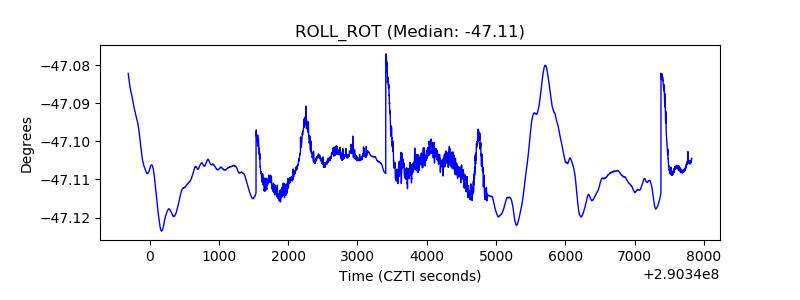 |
| _Roll_DEC | 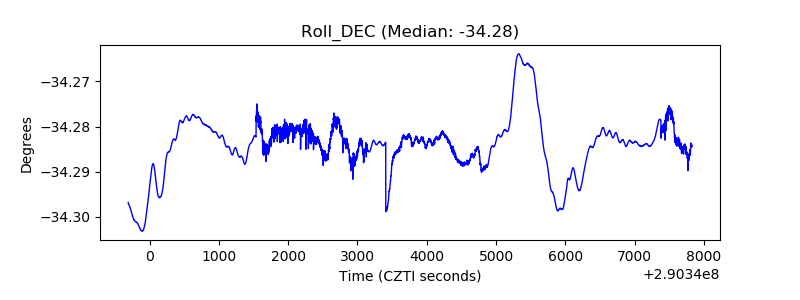 |
| _Roll_RA | 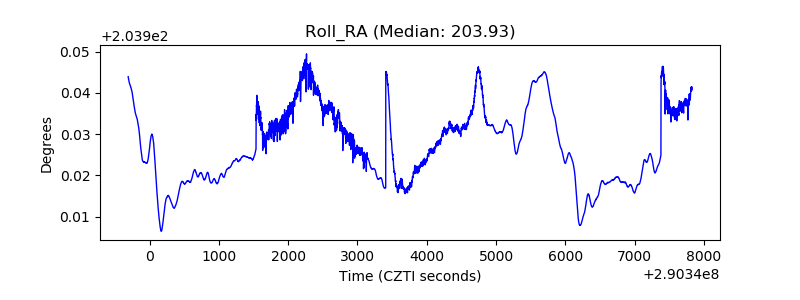 |
| Veto Counter | 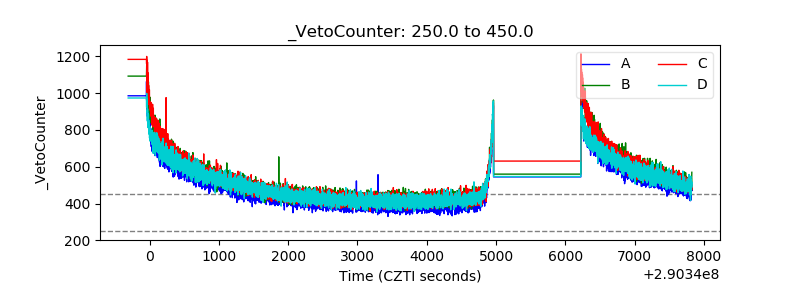 |