| Param | Original file | Final file |
|---|---|---|
| Filename | modeM0/AS1A05_165T07_9000002796_18715cztM0_level2.evt | modeM0/AS1A05_165T07_9000002796_18715cztM0_level2_quad_clean.evt |
| Size (bytes) | 517,138,560 | 72,443,520 |
| Size | 493.2 MB | 69.1 MB |
| Events in quadrant A | 3,608,134 | 443,092 |
| Events in quadrant B | 3,646,067 | 446,143 |
| Events in quadrant C | 4,423,421 | 425,308 |
| Events in quadrant D | 3,537,902 | 420,241 |
| Mode M9 | |||
|---|---|---|---|
| Quadrant | BADHDUFLAG | Total packets | Discarded packets |
| A | 0 | 21 | 0 |
| B | 0 | 22 | 0 |
| C | 0 | 22 | 0 |
| D | 0 | 22 | 0 |
| Mode M0 | |||
|---|---|---|---|
| Quadrant | BADHDUFLAG | Total packets | Discarded packets |
| A | 0 | 14842 | 2 |
| B | 0 | 14954 | 2 |
| C | 0 | 17661 | 2 |
| D | 0 | 14685 | 2 |
| Mode SS | |||
|---|---|---|---|
| Quadrant | BADHDUFLAG | Total packets | Discarded packets |
| A | 0 | 132 | 0 |
| B | 0 | 132 | 0 |
| C | 0 | 132 | 0 |
| D | 0 | 132 | 0 |
| Quadrant | Total seconds | Saturated seconds | Saturation percentage |
|---|---|---|---|
| A | 6575 | 132 | 2.007605% |
| B | 6575 | 140 | 2.129278% |
| C | 6575 | 191 | 2.904943% |
| D | 6575 | 113 | 1.718631% |
Noise dominated data is calculated using 1-second bins in cleaned event files. If a bin has >2000 counts, and if more than 50% of those come from <1% of pixels, then it is considered to be noise-dominated and hence unusable.
| Quadrant | # 1 sec bins | Bins with >0 counts | Bins with >2000 counts | High rate bins dominated by noise | Noise dominated (total time) | Noise dominated (detector-on time) | Marked lightcurve |
|---|---|---|---|---|---|---|---|
| A | 7860 | 6575 | 0 | 0 | 0.00% | 0.00% | 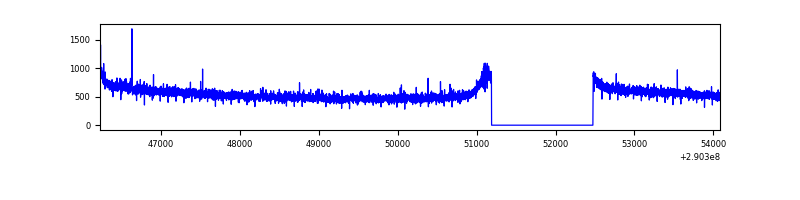 |
| B | 7860 | 6575 | 7 | 7 | 0.09% | 0.11% | 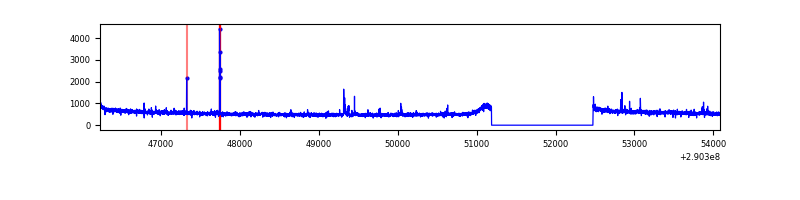 |
| C | 7860 | 6575 | 0 | 0 | 0.00% | 0.00% | 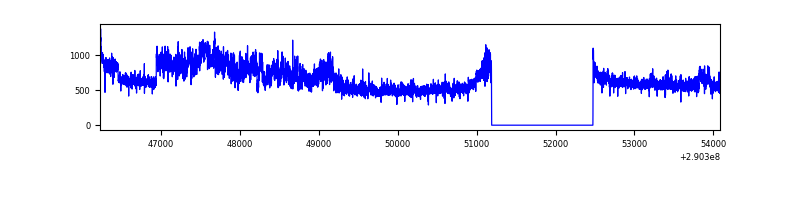 |
| D | 7860 | 6575 | 14 | 14 | 0.18% | 0.21% | 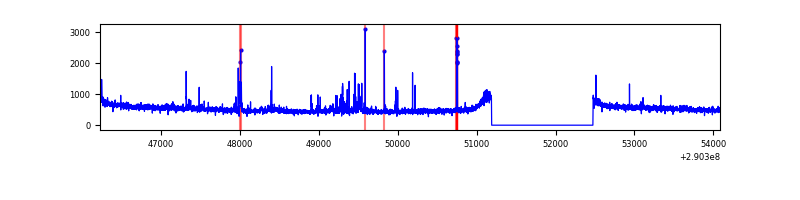 |
Top three noisy pixels from each quadrant. If the there are fewer than three noisy pixels in the level2.evt file, extra rows are filled as -1
| Pixel properties | Quadrant properties | ||||||
|---|---|---|---|---|---|---|---|
| Quadrant | DetID | PixID | Counts | Sigma | Mean | Median | Sigma |
| A | 14 | 111 | 23253 | 123.43 | 925 | 909 | 181.0 |
| A | 0 | 13 | 10523 | 53.11 | 925 | 909 | 181.0 |
| A | 13 | 254 | 10015 | 50.3 | 925 | 909 | 181.0 |
| B | 3 | 64 | 23934 | 136.71 | 915 | 896 | 168.5 |
| B | 0 | 230 | 23396 | 133.52 | 915 | 896 | 168.5 |
| B | 12 | 111 | 19618 | 111.1 | 915 | 896 | 168.5 |
| C | 3 | 233 | 876262 | 4394.39 | 873 | 882 | 199.2 |
| C | 14 | 238 | 140268 | 699.71 | 873 | 882 | 199.2 |
| C | 13 | 61 | 6170 | 26.55 | 873 | 882 | 199.2 |
| D | 14 | 34 | 78863 | 370.58 | 890 | 866 | 210.5 |
| D | 2 | 234 | 29453 | 135.82 | 890 | 866 | 210.5 |
| D | 7 | 238 | 29343 | 135.3 | 890 | 866 | 210.5 |
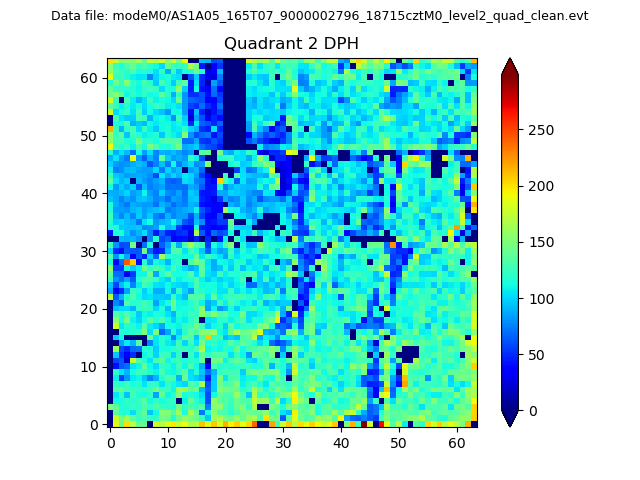
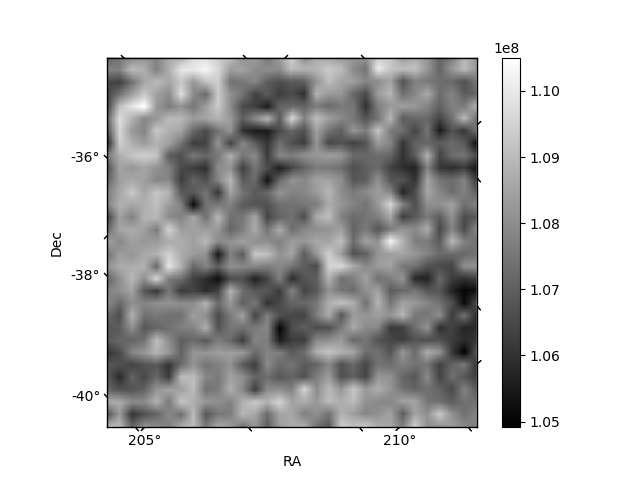
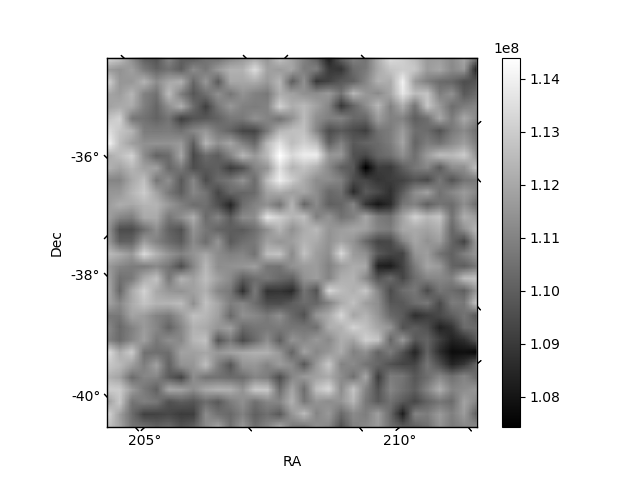
Histogram calculated using DETX and DETY for each event in the final _common_clean file
| Quadrant A | 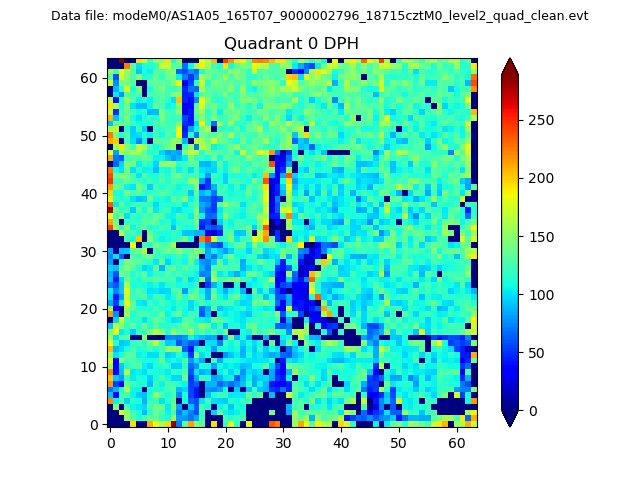 |
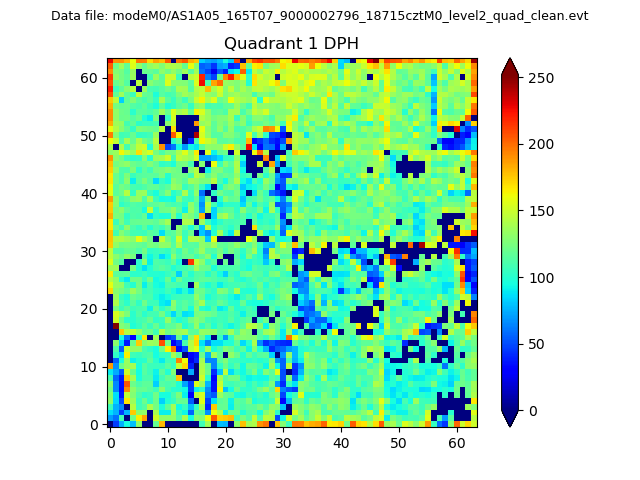 |
Quadrant B |
|---|---|---|---|
| Quadrant D | 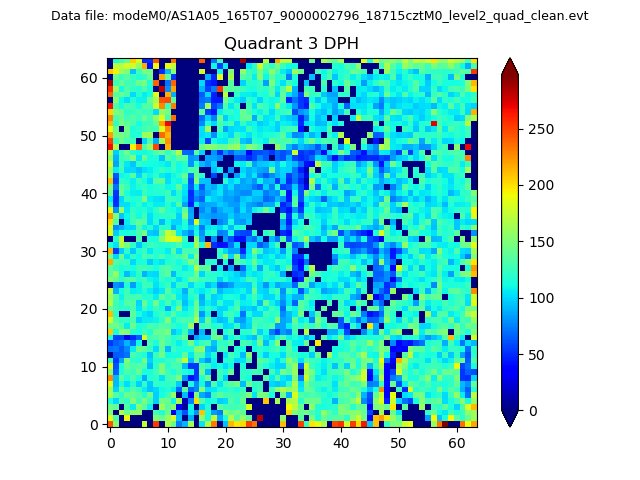 |
 |
Quadrant C |
| Plot type | Count rate plots | Images |
|---|---|---|
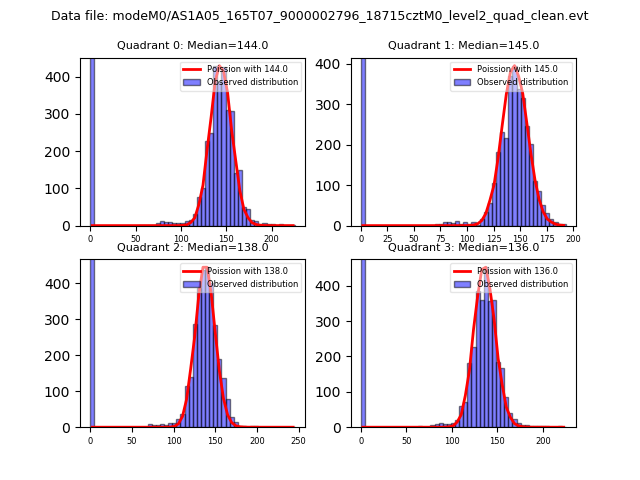
| Comparison with Poisson distribution Blue bars denote a histogram of data divided into 1 sec bins. Red curve is a Poisson curve with rate = median count rate of data. |
 |
 |
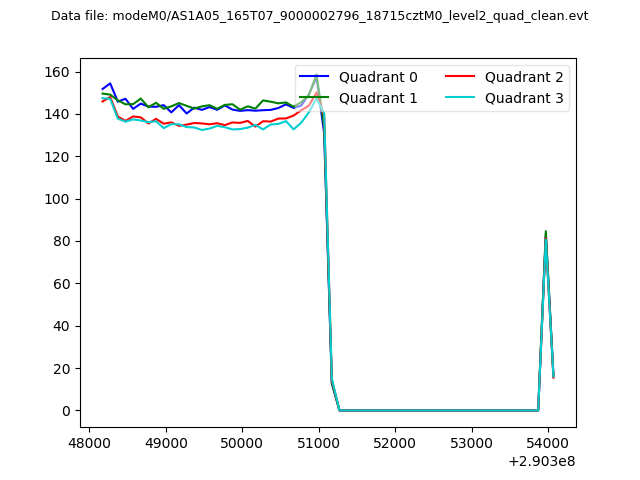
| Quadrant-wise count rates Data is divided into 100 sec bins |
 |
|
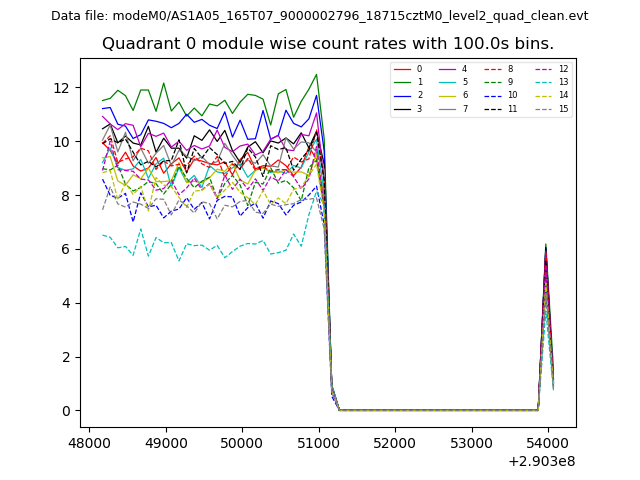
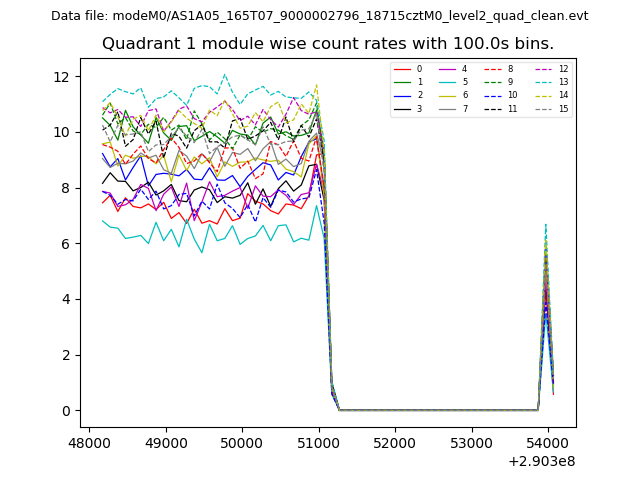
| Module-wise count rates for Quadrant A Data is divided into 100 sec bins |
 |
 |
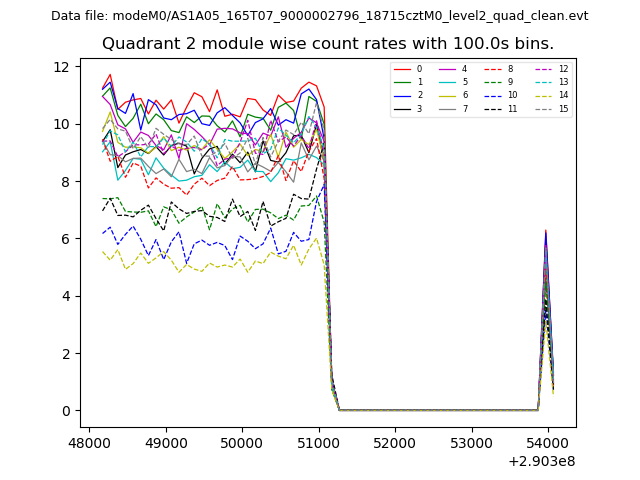
| Module-wise count rates for Quadrant B Data is divided into 100 sec bins |
 |
 |
| Module-wise count rates for Quadrant C Data is divided into 100 sec bins |
 |
 |
| Module-wise count rates for Quadrant D Data is divided into 100 sec bins |
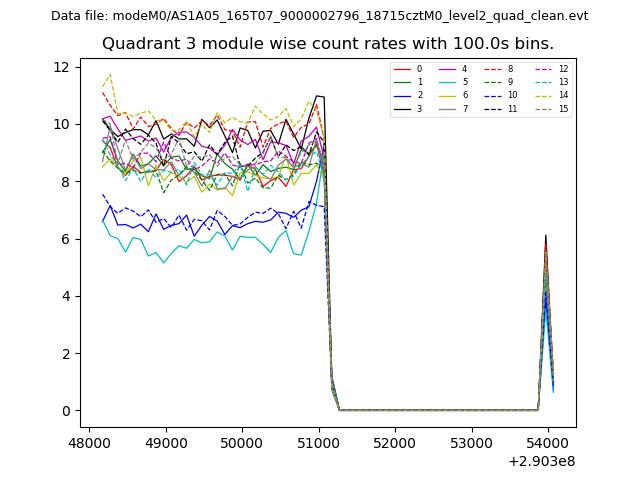 |
 |
| Parameter | Plot |
|---|---|
| CZT HV Monitor | 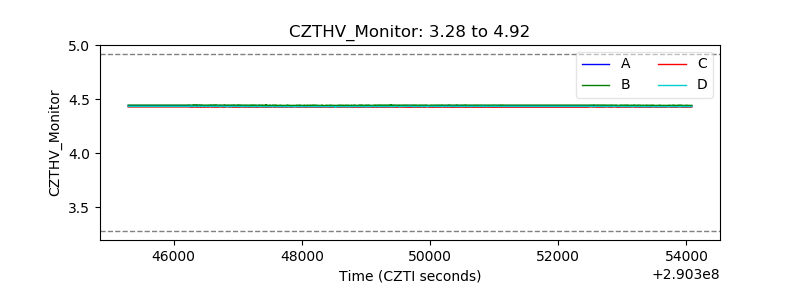 |
| D_VDD | 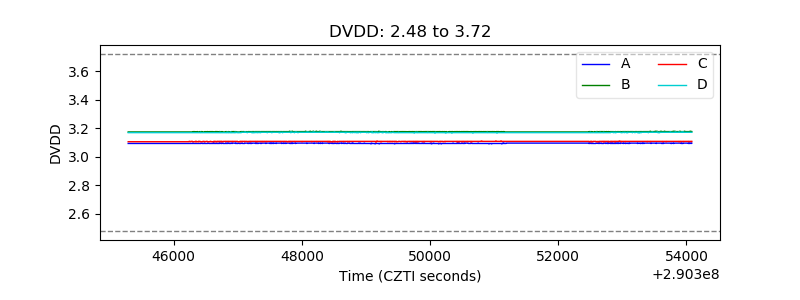 |
| Temperature 1 | 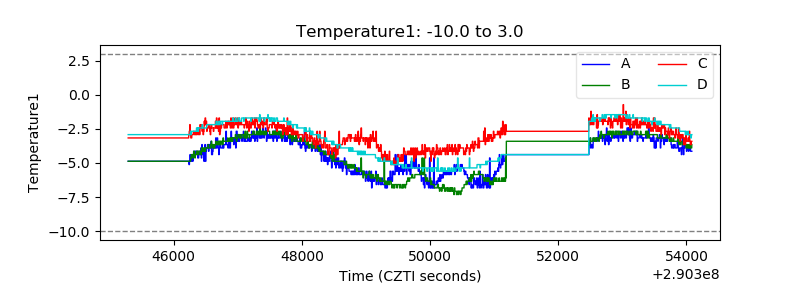 |
| Veto HV Monitor | 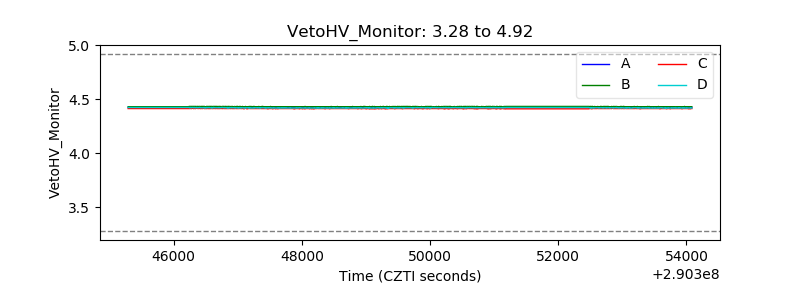 |
| Veto LLD | 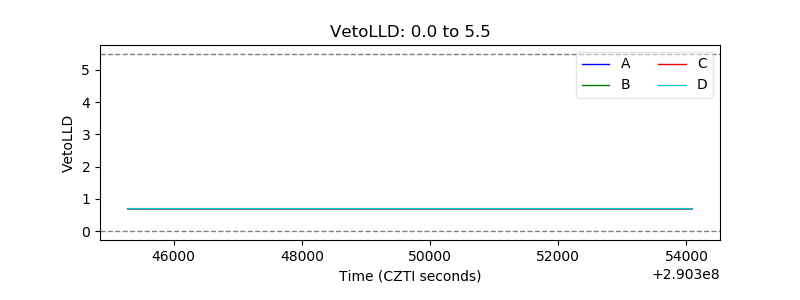 |
| Alpha Counter | 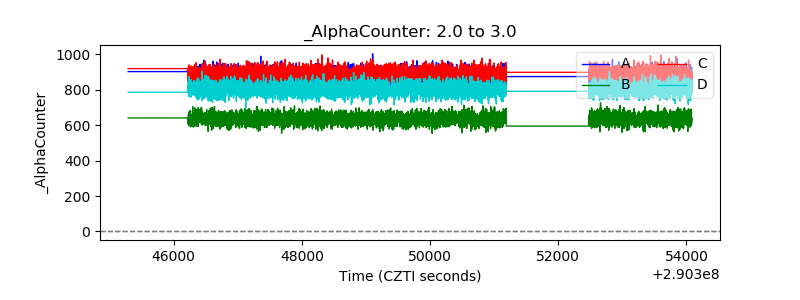 |
| _CPM_Rate | 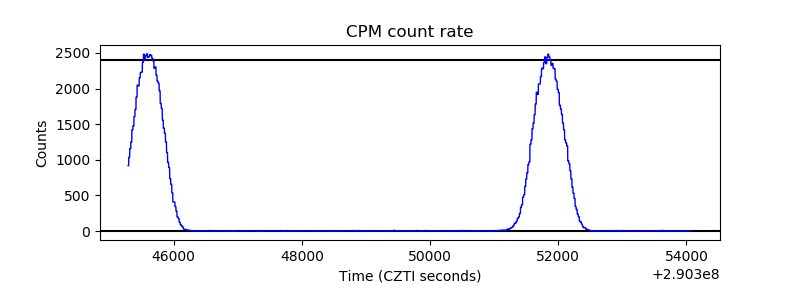 |
| CZT Counter | 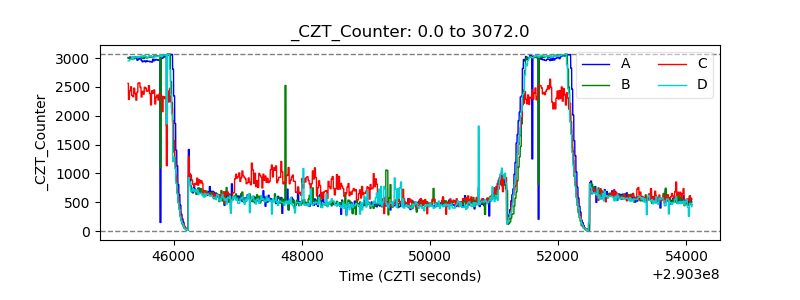 |
| +2.5 Volts monitor |  |
| +5 Volts monitor |  |
| _ROLL_ROT | 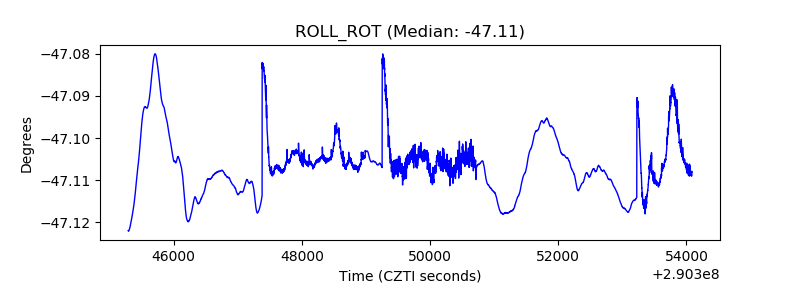 |
| _Roll_DEC | 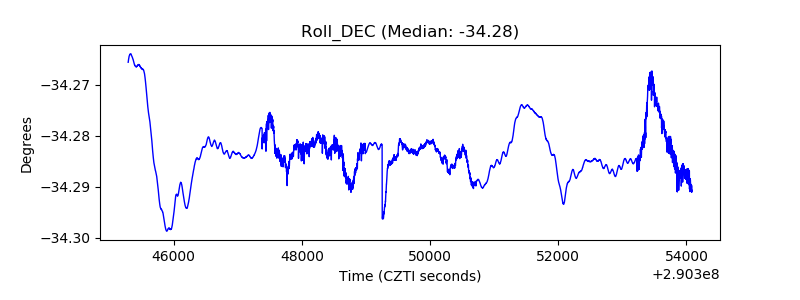 |
| _Roll_RA | 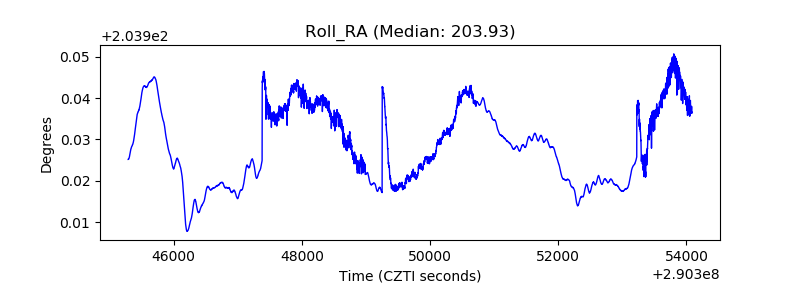 |
| Veto Counter | 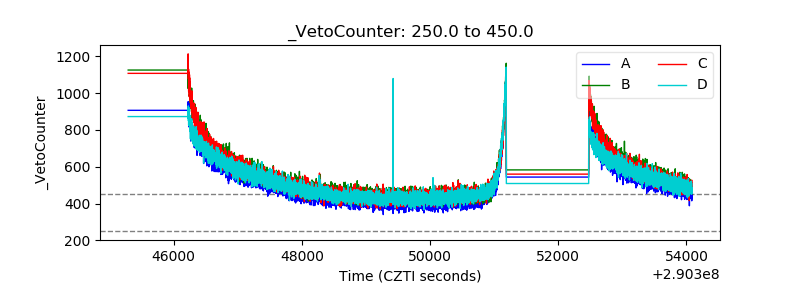 |