| Param | Original file | Final file |
|---|---|---|
| Filename | modeM0/AS1A05_165T07_9000002796_18716cztM0_level2.evt | modeM0/AS1A05_165T07_9000002796_18716cztM0_level2_quad_clean.evt |
| Size (bytes) | 263,715,840 | 48,009,600 |
| Size | 251.5 MB | 45.8 MB |
| Events in quadrant A | 1,889,729 | 305,968 |
| Events in quadrant B | 1,936,665 | 307,837 |
| Events in quadrant C | 2,102,342 | 291,930 |
| Events in quadrant D | 1,807,063 | 288,079 |
| Mode M9 | |||
|---|---|---|---|
| Quadrant | BADHDUFLAG | Total packets | Discarded packets |
| A | 0 | 5 | 0 |
| B | 0 | 6 | 0 |
| C | 0 | 6 | 0 |
| D | 0 | 6 | 0 |
| Mode M0 | |||
|---|---|---|---|
| Quadrant | BADHDUFLAG | Total packets | Discarded packets |
| A | 0 | 7951 | 1 |
| B | 0 | 8109 | 1 |
| C | 0 | 8723 | 1 |
| D | 0 | 7810 | 1 |
| Mode SS | |||
|---|---|---|---|
| Quadrant | BADHDUFLAG | Total packets | Discarded packets |
| A | 0 | 74 | 0 |
| B | 0 | 74 | 0 |
| C | 0 | 74 | 0 |
| D | 0 | 74 | 0 |
| Quadrant | Total seconds | Saturated seconds | Saturation percentage |
|---|---|---|---|
| A | 3668 | 9 | 0.245365% |
| B | 3668 | 15 | 0.408942% |
| C | 3668 | 19 | 0.517993% |
| D | 3668 | 5 | 0.136314% |
Noise dominated data is calculated using 1-second bins in cleaned event files. If a bin has >2000 counts, and if more than 50% of those come from <1% of pixels, then it is considered to be noise-dominated and hence unusable.
| Quadrant | # 1 sec bins | Bins with >0 counts | Bins with >2000 counts | High rate bins dominated by noise | Noise dominated (total time) | Noise dominated (detector-on time) | Marked lightcurve |
|---|---|---|---|---|---|---|---|
| A | 3668 | 3668 | 0 | 0 | 0.00% | 0.00% | 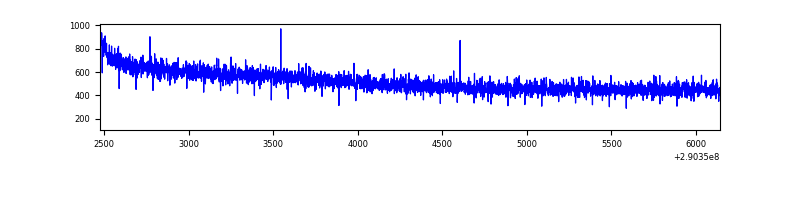 |
| B | 3668 | 3668 | 1 | 1 | 0.03% | 0.03% | 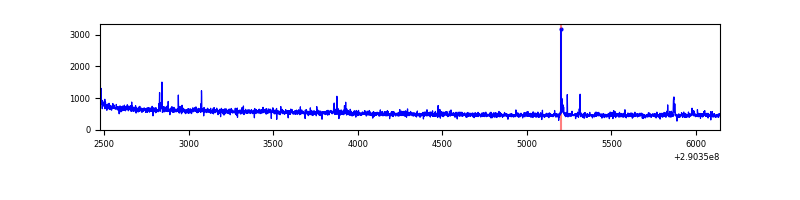 |
| C | 3668 | 3668 | 0 | 0 | 0.00% | 0.00% | 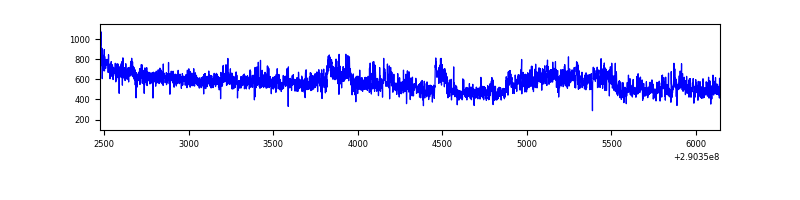 |
| D | 3668 | 3668 | 1 | 1 | 0.03% | 0.03% |  |
Top three noisy pixels from each quadrant. If the there are fewer than three noisy pixels in the level2.evt file, extra rows are filled as -1
| Pixel properties | Quadrant properties | ||||||
|---|---|---|---|---|---|---|---|
| Quadrant | DetID | PixID | Counts | Sigma | Mean | Median | Sigma |
| A | 13 | 254 | 5871 | 55.15 | 489 | 482 | 97.7 |
| A | 0 | 226 | 4222 | 38.27 | 489 | 482 | 97.7 |
| A | 12 | 194 | 3621 | 32.12 | 489 | 482 | 97.7 |
| B | 0 | 230 | 15767 | 167.3 | 488 | 478 | 91.4 |
| B | 12 | 111 | 10088 | 105.16 | 488 | 478 | 91.4 |
| B | 11 | 111 | 9038 | 93.67 | 488 | 478 | 91.4 |
| C | 3 | 233 | 233804 | 2216.79 | 460 | 465 | 105.3 |
| C | 14 | 238 | 74778 | 706.0 | 460 | 465 | 105.3 |
| C | 13 | 61 | 3217 | 26.14 | 460 | 465 | 105.3 |
| D | 7 | 238 | 32823 | 294.25 | 465 | 454 | 110.0 |
| D | 2 | 234 | 16348 | 144.48 | 465 | 454 | 110.0 |
| D | 14 | 34 | 6024 | 50.63 | 465 | 454 | 110.0 |
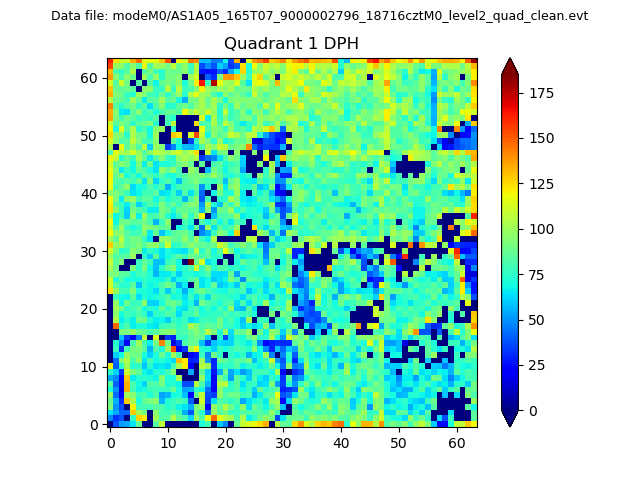
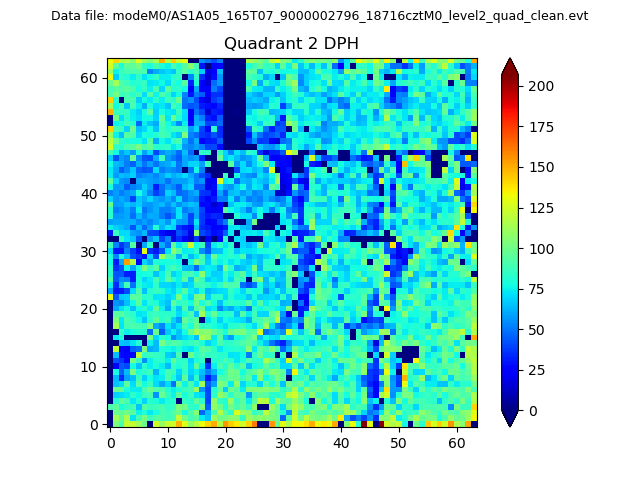
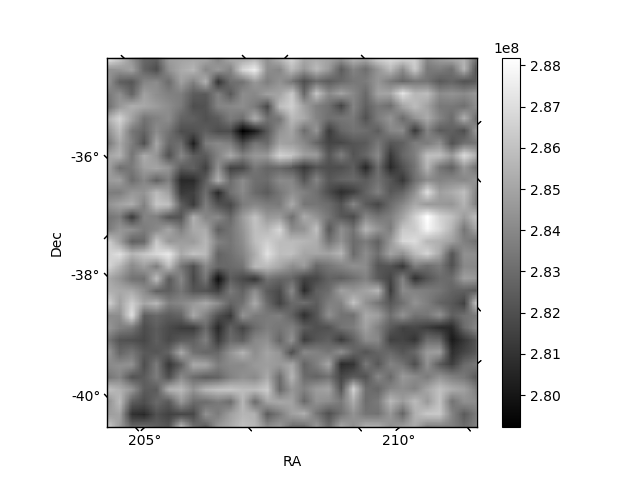
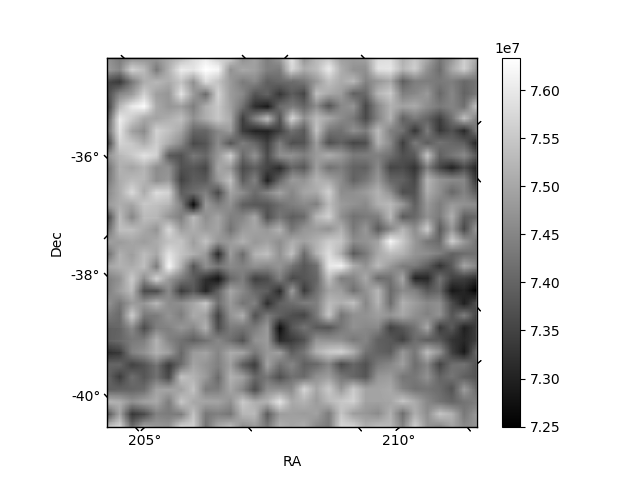
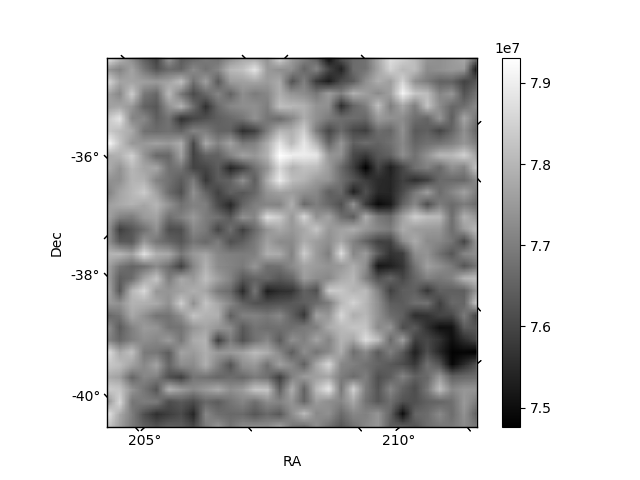
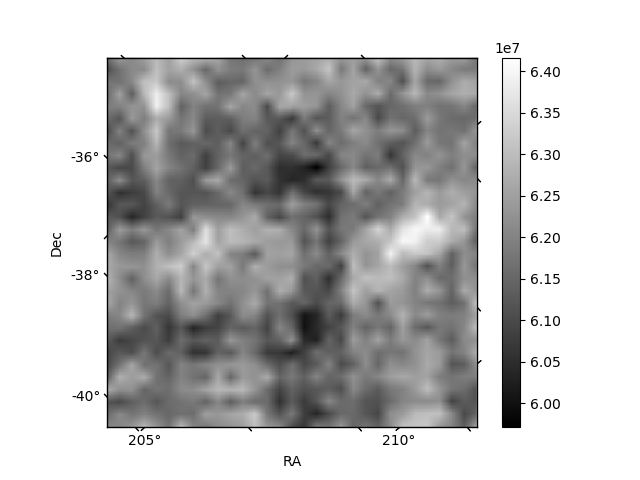
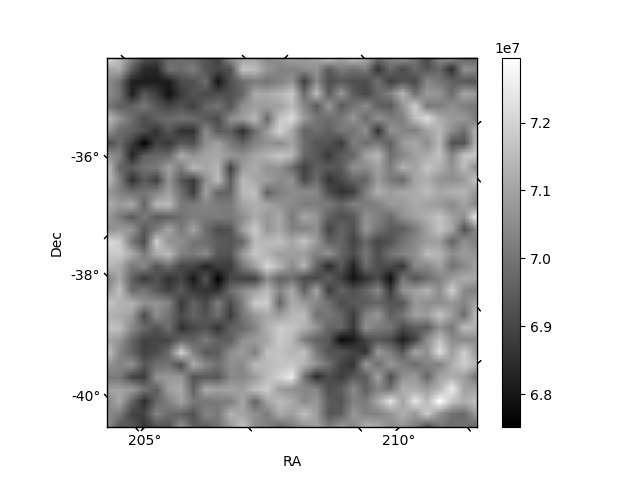
Histogram calculated using DETX and DETY for each event in the final _common_clean file
| Quadrant A | 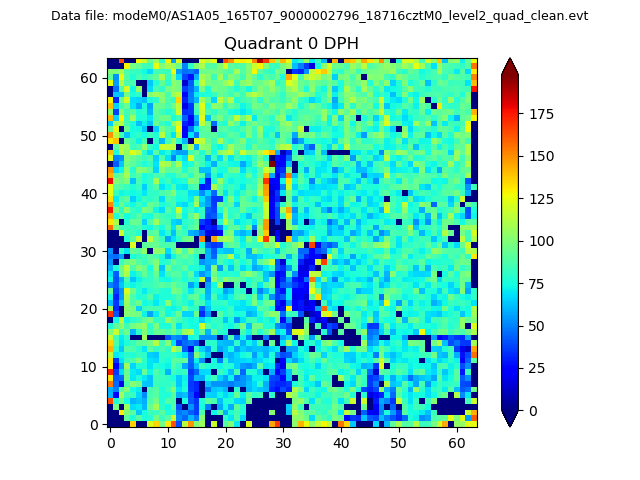 |
 |
Quadrant B |
|---|---|---|---|
| Quadrant D | 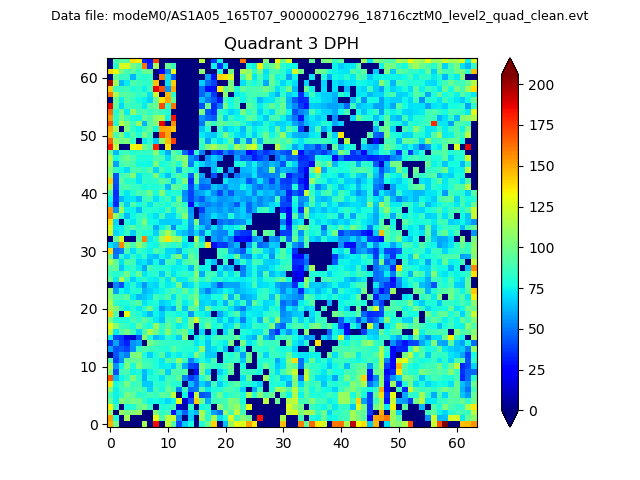 |
 |
Quadrant C |
| Plot type | Count rate plots | Images |
|---|---|---|
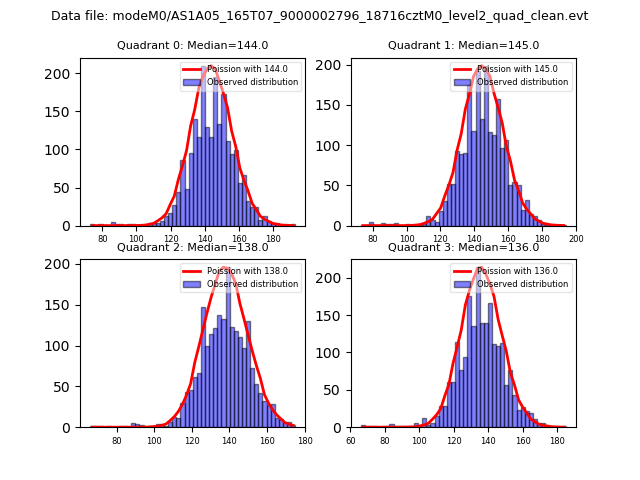
| Comparison with Poisson distribution Blue bars denote a histogram of data divided into 1 sec bins. Red curve is a Poisson curve with rate = median count rate of data. |
 |
 |
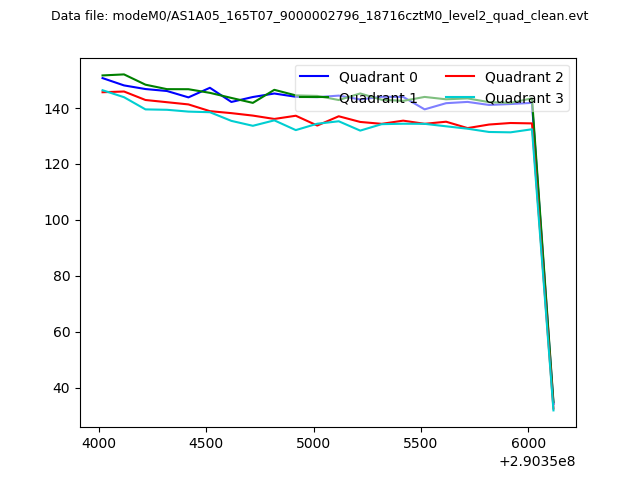
| Quadrant-wise count rates Data is divided into 100 sec bins |
 |
|
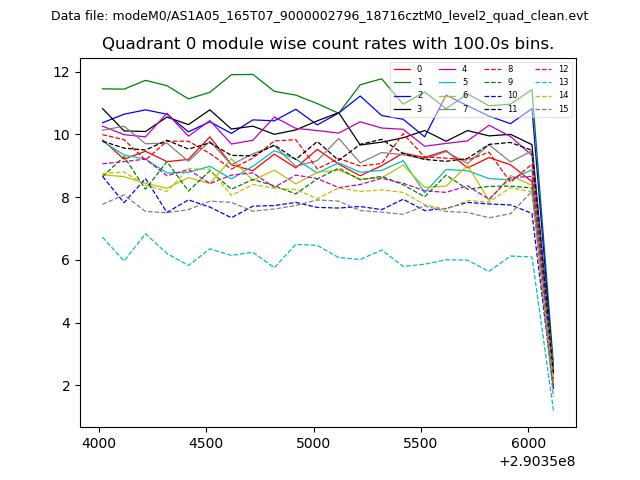
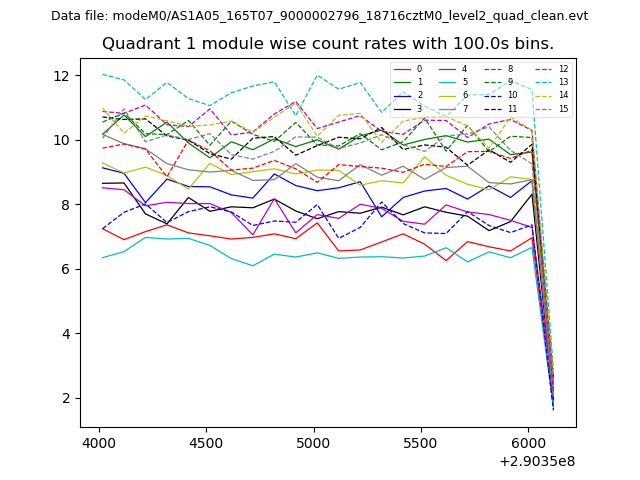
| Module-wise count rates for Quadrant A Data is divided into 100 sec bins |
 |
 |
| Module-wise count rates for Quadrant B Data is divided into 100 sec bins |
 |
 |
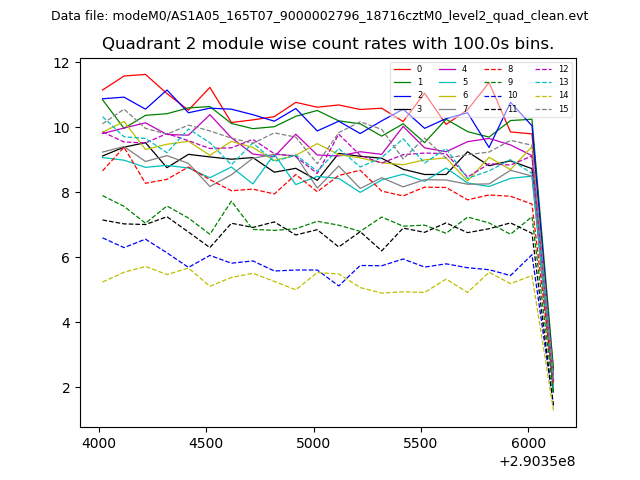
| Module-wise count rates for Quadrant C Data is divided into 100 sec bins |
 |
 |
| Module-wise count rates for Quadrant D Data is divided into 100 sec bins |
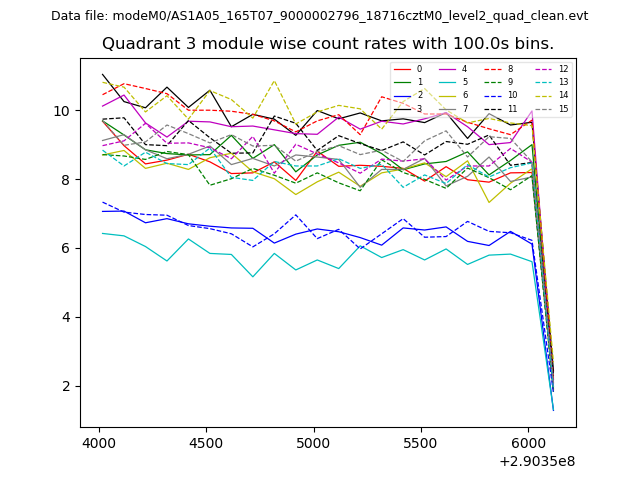 |
 |
| Parameter | Plot |
|---|---|
| CZT HV Monitor | 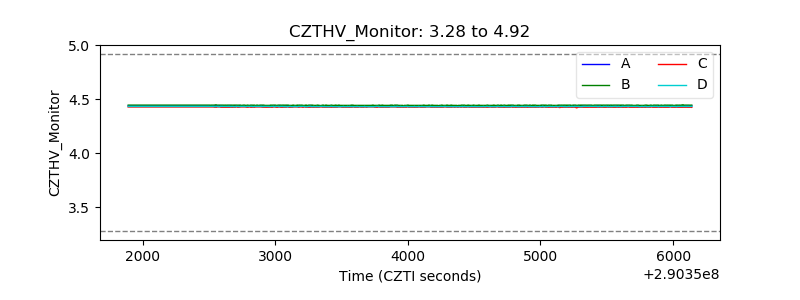 |
| D_VDD |  |
| Temperature 1 | 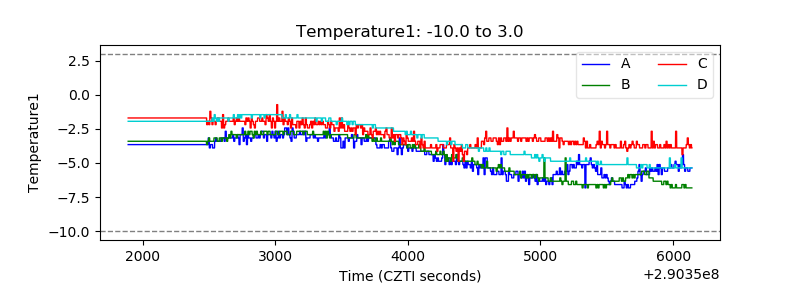 |
| Veto HV Monitor | 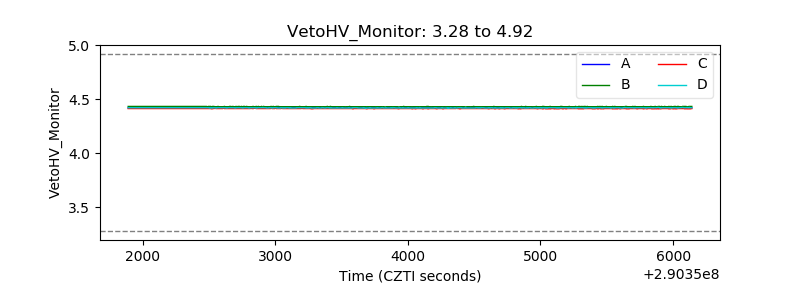 |
| Veto LLD | 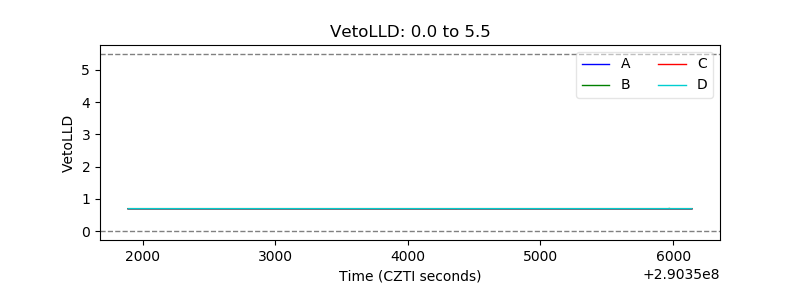 |
| Alpha Counter | 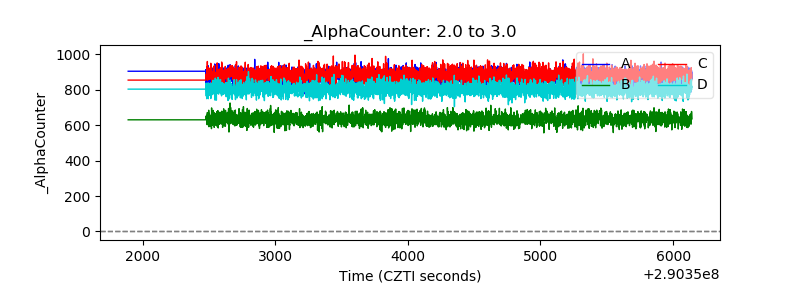 |
| _CPM_Rate | 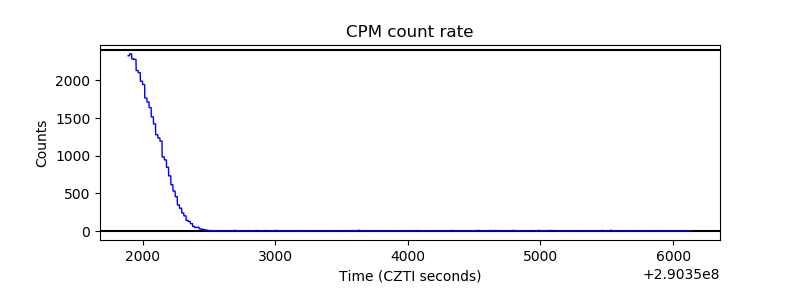 |
| CZT Counter | 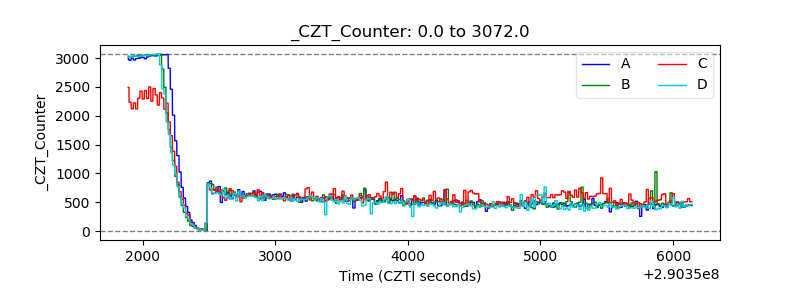 |
| +2.5 Volts monitor |  |
| +5 Volts monitor |  |
| _ROLL_ROT | 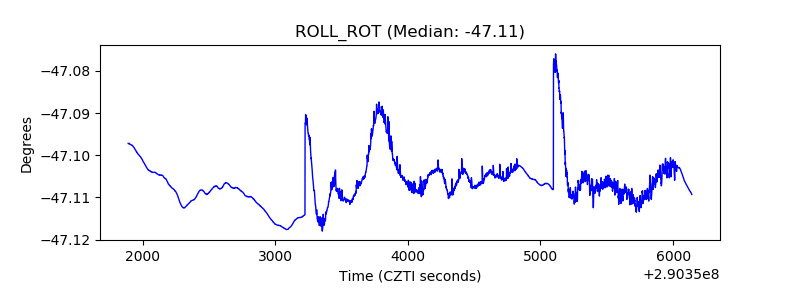 |
| _Roll_DEC | 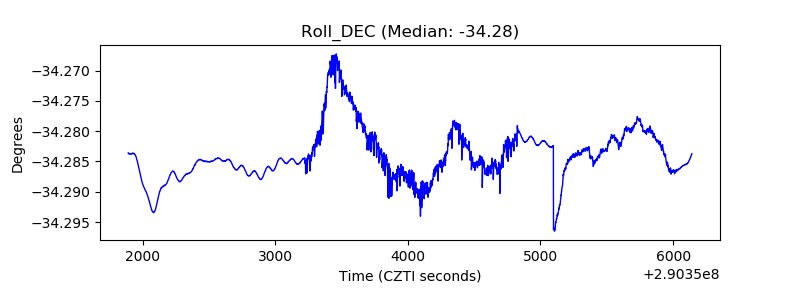 |
| _Roll_RA |  |
| Veto Counter | 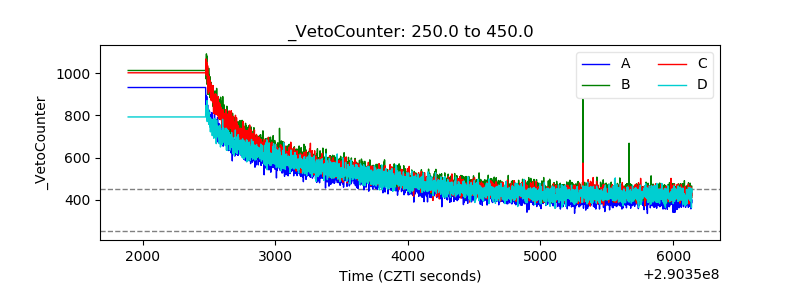 |