| Param | Original file | Final file |
|---|---|---|
| Filename | modeM0/AS1T03_091T01_9000002798_18719cztM0_level2.evt | modeM0/AS1T03_091T01_9000002798_18719cztM0_level2_quad_clean.evt |
| Size (bytes) | 512,637,120 | 106,721,280 |
| Size | 488.9 MB | 101.8 MB |
| Events in quadrant A | 3,459,608 | 698,026 |
| Events in quadrant B | 4,606,814 | 694,641 |
| Events in quadrant C | 3,589,449 | 668,997 |
| Events in quadrant D | 3,372,978 | 661,680 |
| Mode M0 | |||
|---|---|---|---|
| Quadrant | BADHDUFLAG | Total packets | Discarded packets |
| A | 0 | 15180 | 1 |
| B | 0 | 18601 | 1 |
| C | 0 | 15505 | 1 |
| D | 0 | 15282 | 1 |
| Mode M9 | |||
|---|---|---|---|
| Quadrant | BADHDUFLAG | Total packets | Discarded packets |
| A | 0 | 10 | 0 |
| B | 0 | 11 | 0 |
| C | 0 | 11 | 0 |
| D | 0 | 11 | 0 |
| Mode SS | |||
|---|---|---|---|
| Quadrant | BADHDUFLAG | Total packets | Discarded packets |
| A | 0 | 146 | 0 |
| B | 0 | 146 | 0 |
| C | 0 | 146 | 0 |
| D | 0 | 146 | 0 |
| Quadrant | Total seconds | Saturated seconds | Saturation percentage |
|---|---|---|---|
| A | 7313 | 51 | 0.697388% |
| B | 7313 | 415 | 5.674826% |
| C | 7313 | 118 | 1.613565% |
| D | 7313 | 17 | 0.232463% |
Noise dominated data is calculated using 1-second bins in cleaned event files. If a bin has >2000 counts, and if more than 50% of those come from <1% of pixels, then it is considered to be noise-dominated and hence unusable.
| Quadrant | # 1 sec bins | Bins with >0 counts | Bins with >2000 counts | High rate bins dominated by noise | Noise dominated (total time) | Noise dominated (detector-on time) | Marked lightcurve |
|---|---|---|---|---|---|---|---|
| A | 7773 | 7314 | 1 | 1 | 0.01% | 0.01% | 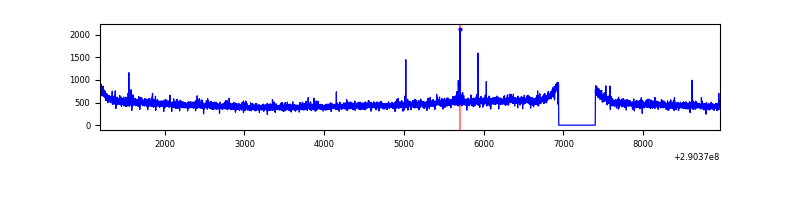 |
| B | 7773 | 7314 | 227 | 227 | 2.92% | 3.10% | 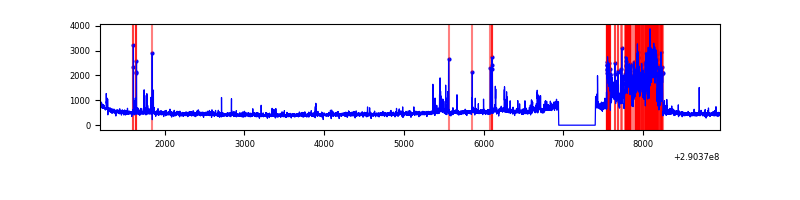 |
| C | 7773 | 7314 | 3 | 3 | 0.04% | 0.04% | 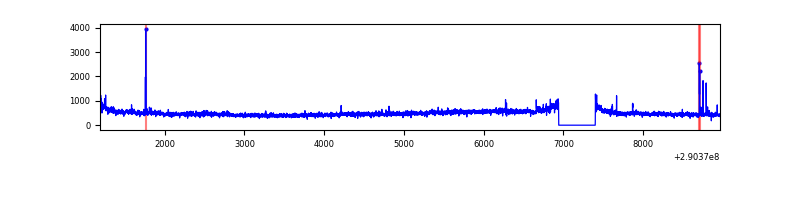 |
| D | 7773 | 7314 | 4 | 4 | 0.05% | 0.05% | 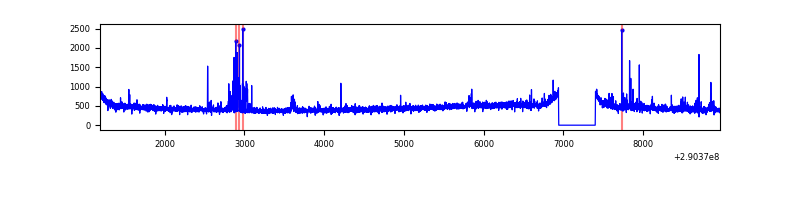 |
Top three noisy pixels from each quadrant. If the there are fewer than three noisy pixels in the level2.evt file, extra rows are filled as -1
| Pixel properties | Quadrant properties | ||||||
|---|---|---|---|---|---|---|---|
| Quadrant | DetID | PixID | Counts | Sigma | Mean | Median | Sigma |
| A | 4 | 2 | 13978 | 72.86 | 890 | 870 | 179.9 |
| A | 13 | 254 | 11593 | 59.6 | 890 | 870 | 179.9 |
| A | 14 | 111 | 8375 | 41.72 | 890 | 870 | 179.9 |
| B | 10 | 245 | 1063528 | 6339.22 | 877 | 856 | 167.6 |
| B | 7 | 220 | 47728 | 279.61 | 877 | 856 | 167.6 |
| B | 12 | 111 | 19971 | 114.03 | 877 | 856 | 167.6 |
| C | 3 | 233 | 142438 | 721.78 | 840 | 844 | 196.2 |
| C | 14 | 238 | 132026 | 668.7 | 840 | 844 | 196.2 |
| C | 0 | 207 | 28199 | 139.44 | 840 | 844 | 196.2 |
| D | 12 | 110 | 62728 | 296.04 | 852 | 826 | 209.1 |
| D | 7 | 238 | 46450 | 218.19 | 852 | 826 | 209.1 |
| D | 2 | 234 | 33161 | 154.64 | 852 | 826 | 209.1 |
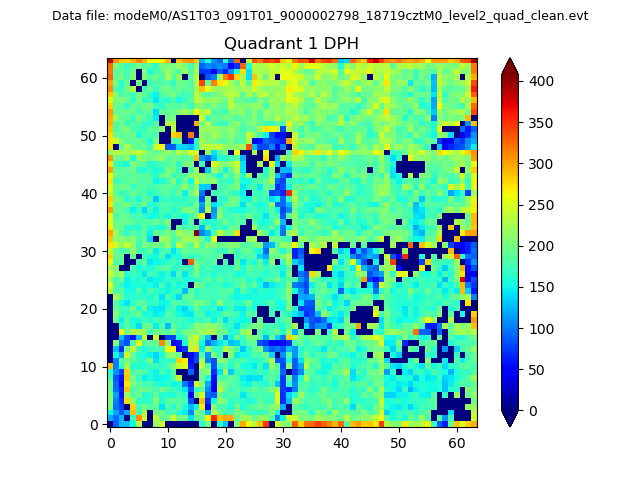
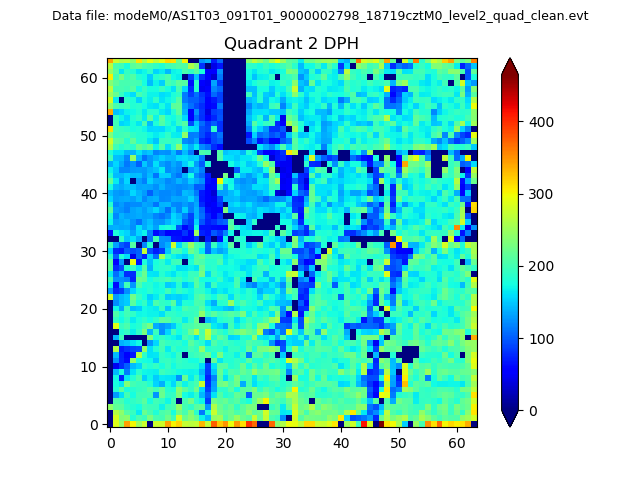
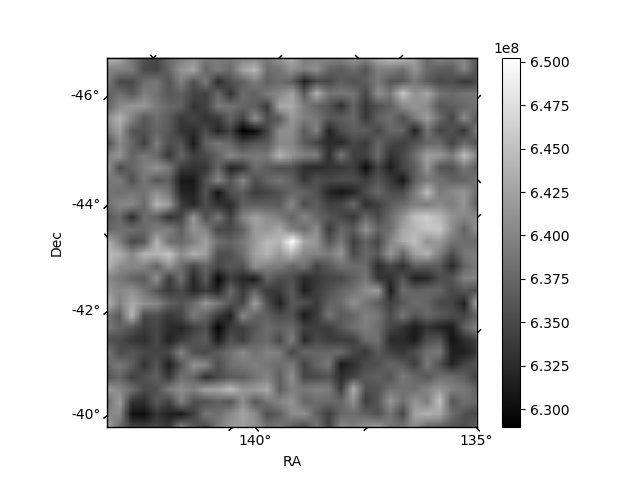
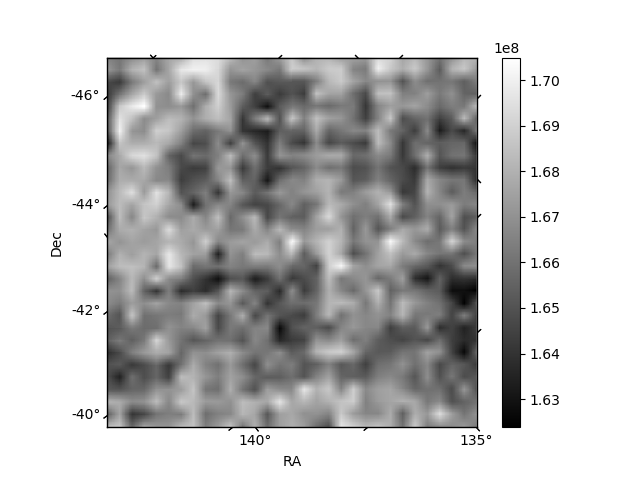
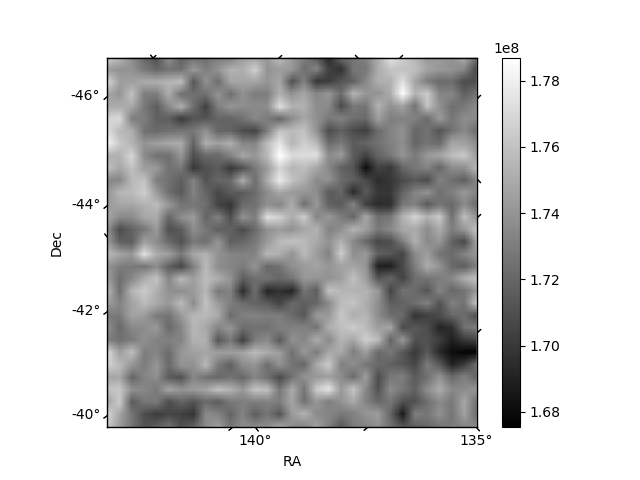
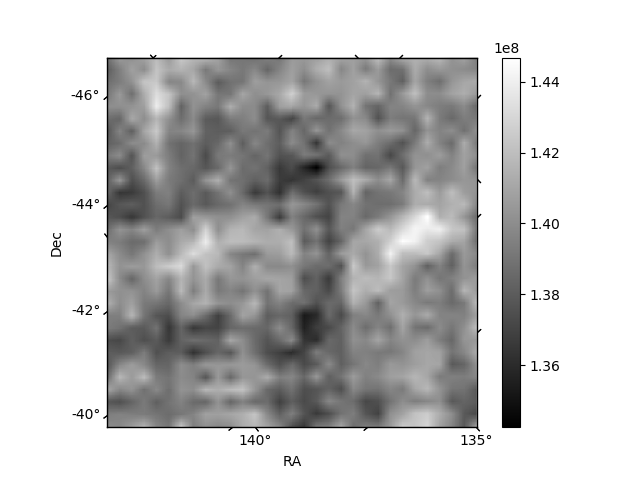
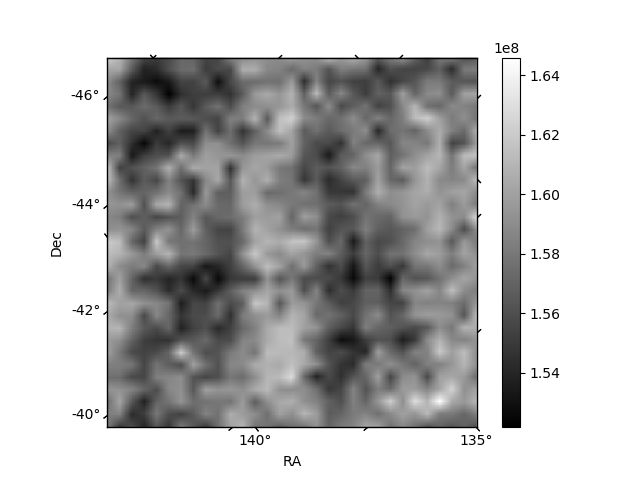
Histogram calculated using DETX and DETY for each event in the final _common_clean file
| Quadrant A |  |
 |
Quadrant B |
|---|---|---|---|
| Quadrant D | 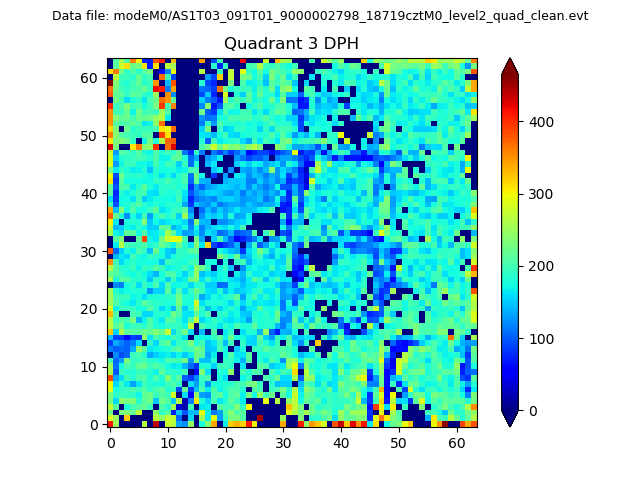 |
 |
Quadrant C |
| Plot type | Count rate plots | Images |
|---|---|---|
| Comparison with Poisson distribution Blue bars denote a histogram of data divided into 1 sec bins. Red curve is a Poisson curve with rate = median count rate of data. |
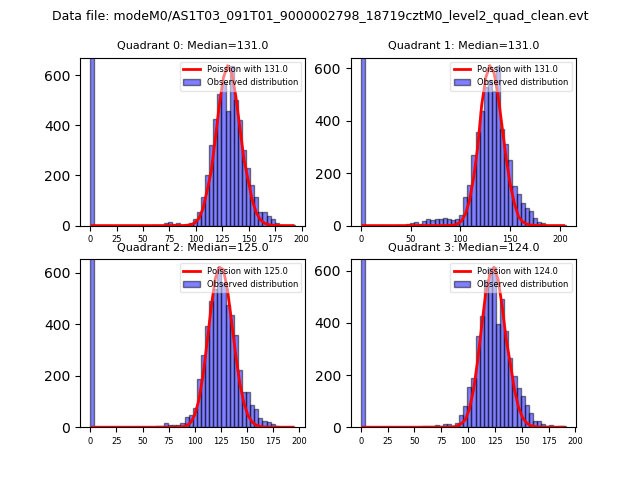 |
 |
| Quadrant-wise count rates Data is divided into 100 sec bins |
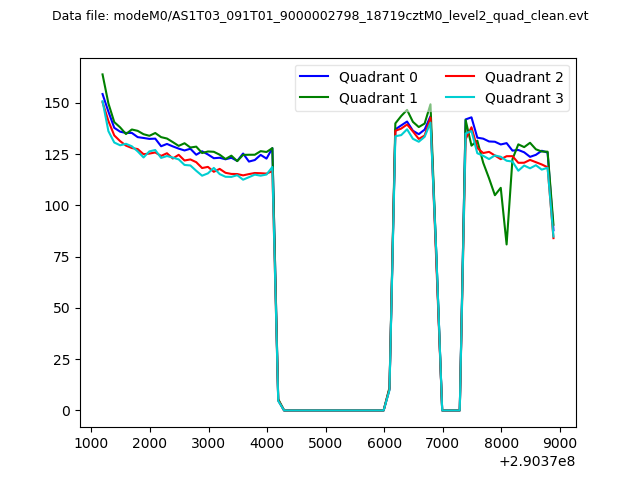 |
|
| Module-wise count rates for Quadrant A Data is divided into 100 sec bins |
 |
 |
| Module-wise count rates for Quadrant B Data is divided into 100 sec bins |
 |
 |
| Module-wise count rates for Quadrant C Data is divided into 100 sec bins |
 |
 |
| Module-wise count rates for Quadrant D Data is divided into 100 sec bins |
 |
 |
| Parameter | Plot |
|---|---|
| CZT HV Monitor |  |
| D_VDD | 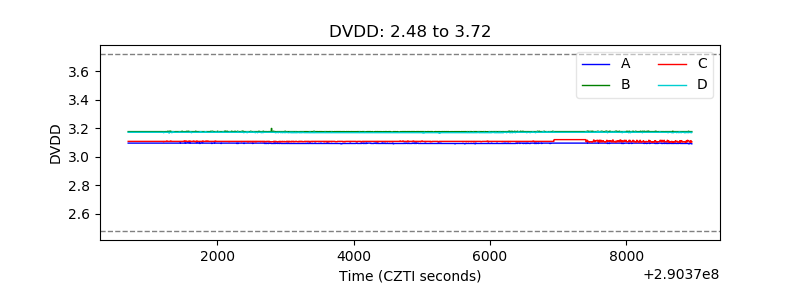 |
| Temperature 1 | 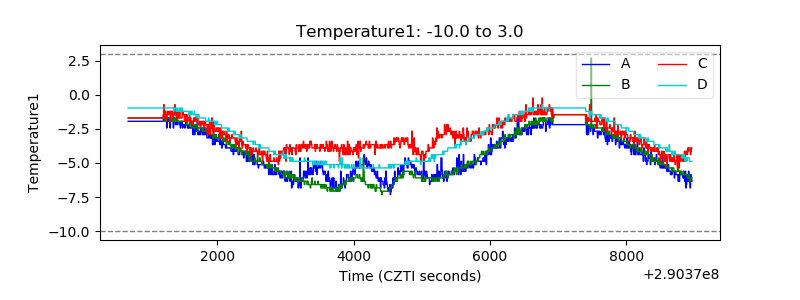 |
| Veto HV Monitor | 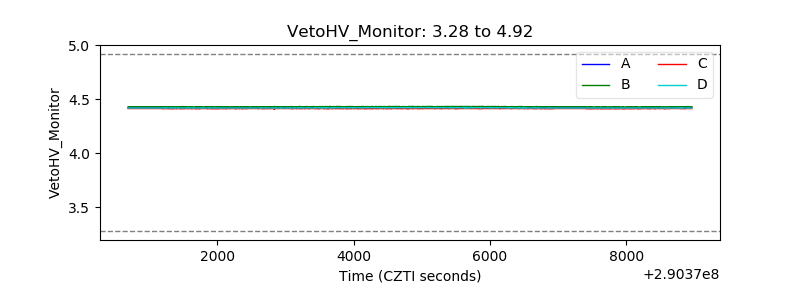 |
| Veto LLD | 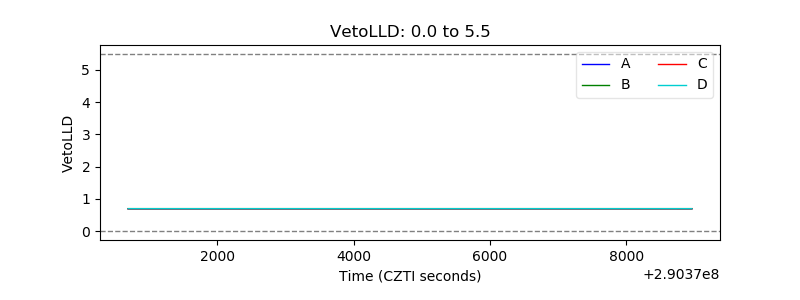 |
| Alpha Counter | 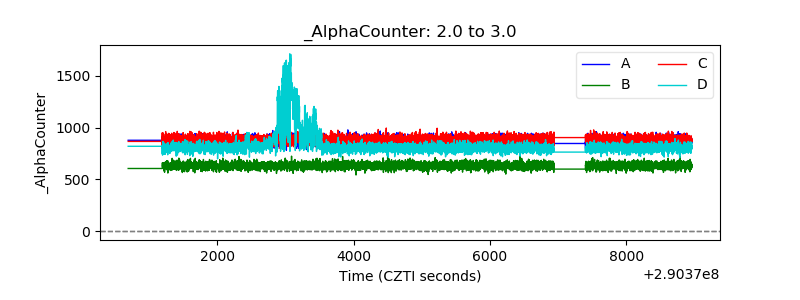 |
| _CPM_Rate | 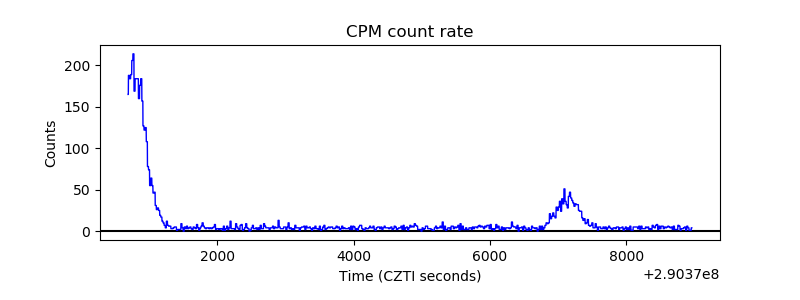 |
| CZT Counter | 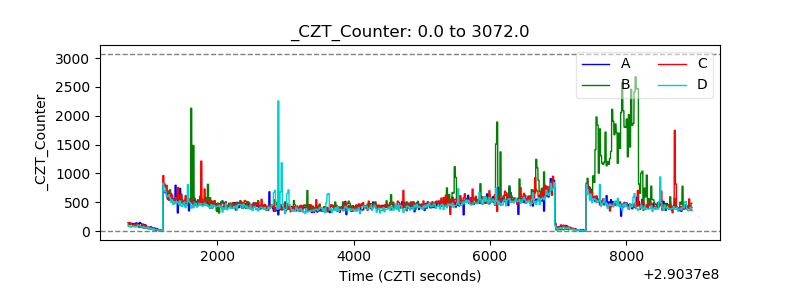 |
| +2.5 Volts monitor |  |
| +5 Volts monitor | 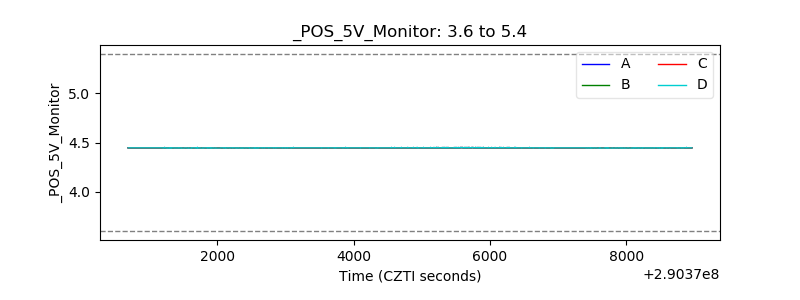 |
| _ROLL_ROT | 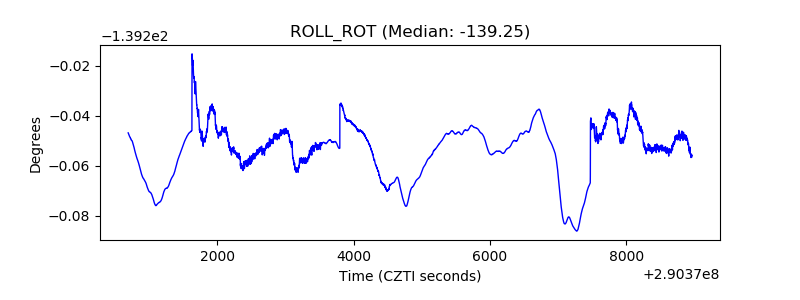 |
| _Roll_DEC | 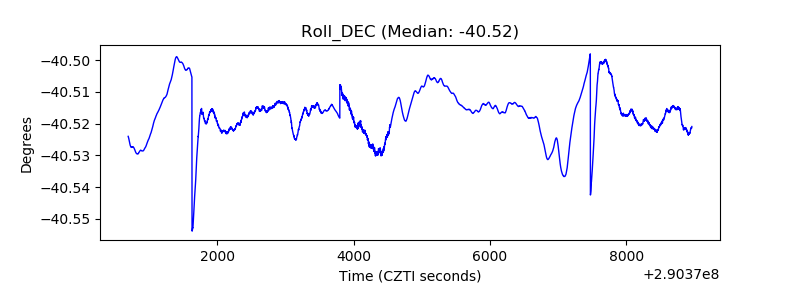 |
| _Roll_RA | 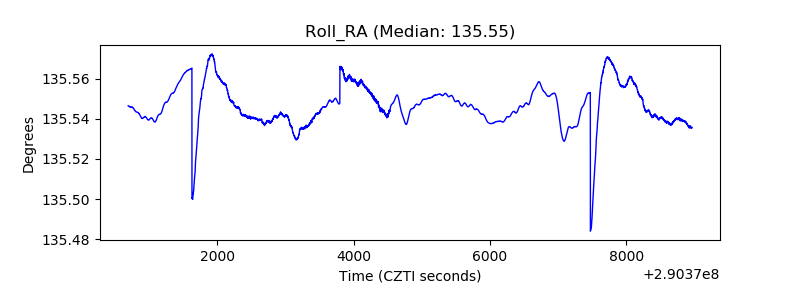 |
| Veto Counter | 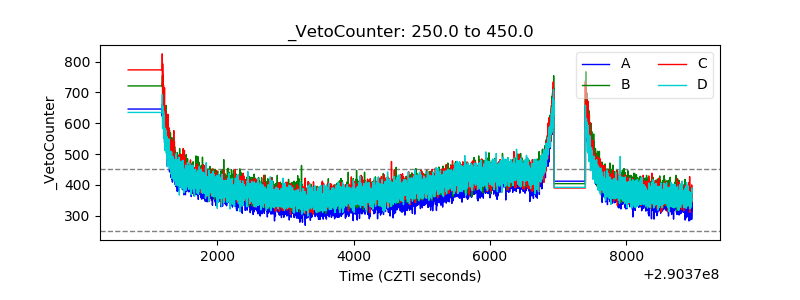 |