| Param | Original file | Final file |
|---|---|---|
| Filename | modeM0/AS1T03_091T01_9000002798_18721cztM0_level2.evt | modeM0/AS1T03_091T01_9000002798_18721cztM0_level2_quad_clean.evt |
| Size (bytes) | 605,594,880 | 111,844,800 |
| Size | 577.5 MB | 106.7 MB |
| Events in quadrant A | 3,635,878 | 741,104 |
| Events in quadrant B | 6,723,077 | 685,397 |
| Events in quadrant C | 3,926,160 | 712,429 |
| Events in quadrant D | 3,524,839 | 704,241 |
| Mode M0 | |||
|---|---|---|---|
| Quadrant | BADHDUFLAG | Total packets | Discarded packets |
| A | 0 | 16161 | 3 |
| B | 0 | 25249 | 3 |
| C | 0 | 16703 | 3 |
| D | 0 | 16165 | 3 |
| Mode M9 | |||
|---|---|---|---|
| Quadrant | BADHDUFLAG | Total packets | Discarded packets |
| A | 0 | 6 | 0 |
| B | 0 | 6 | 0 |
| C | 0 | 6 | 0 |
| D | 0 | 6 | 0 |
| Mode SS | |||
|---|---|---|---|
| Quadrant | BADHDUFLAG | Total packets | Discarded packets |
| A | 0 | 162 | 0 |
| B | 0 | 162 | 0 |
| C | 0 | 162 | 0 |
| D | 0 | 162 | 0 |
| Quadrant | Total seconds | Saturated seconds | Saturation percentage |
|---|---|---|---|
| A | 7814 | 56 | 0.716662% |
| B | 7815 | 1019 | 13.039028% |
| C | 7815 | 113 | 1.445937% |
| D | 7815 | 33 | 0.422265% |
Noise dominated data is calculated using 1-second bins in cleaned event files. If a bin has >2000 counts, and if more than 50% of those come from <1% of pixels, then it is considered to be noise-dominated and hence unusable.
| Quadrant | # 1 sec bins | Bins with >0 counts | Bins with >2000 counts | High rate bins dominated by noise | Noise dominated (total time) | Noise dominated (detector-on time) | Marked lightcurve |
|---|---|---|---|---|---|---|---|
| A | 8489 | 7817 | 10 | 10 | 0.12% | 0.13% | 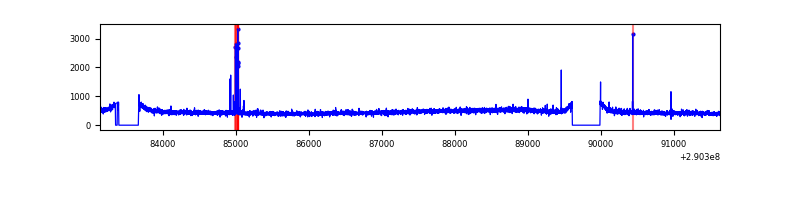 |
| B | 8490 | 7818 | 766 | 766 | 9.02% | 9.80% | 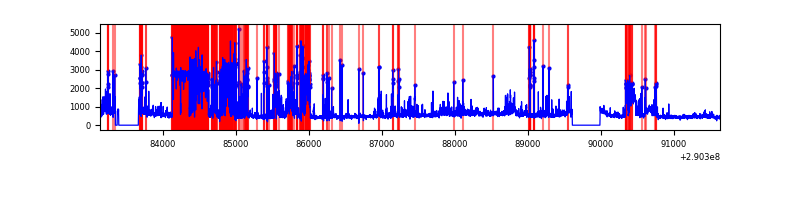 |
| C | 8490 | 7818 | 0 | 0 | 0.00% | 0.00% | 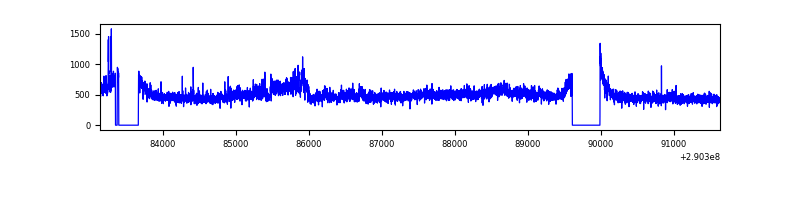 |
| D | 8490 | 7818 | 1 | 1 | 0.01% | 0.01% | 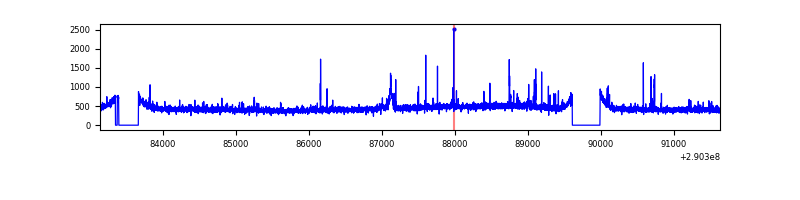 |
Top three noisy pixels from each quadrant. If the there are fewer than three noisy pixels in the level2.evt file, extra rows are filled as -1
| Pixel properties | Quadrant properties | ||||||
|---|---|---|---|---|---|---|---|
| Quadrant | DetID | PixID | Counts | Sigma | Mean | Median | Sigma |
| A | 4 | 2 | 48968 | 254.97 | 925 | 904 | 188.5 |
| A | 15 | 192 | 12456 | 61.28 | 925 | 904 | 188.5 |
| A | 13 | 254 | 11698 | 57.26 | 925 | 904 | 188.5 |
| B | 10 | 245 | 3178516 | 18951.58 | 875 | 852 | 167.7 |
| B | 7 | 220 | 70475 | 415.23 | 875 | 852 | 167.7 |
| B | 12 | 111 | 20240 | 115.63 | 875 | 852 | 167.7 |
| C | 3 | 233 | 205434 | 977.47 | 886 | 891 | 209.3 |
| C | 14 | 238 | 139705 | 663.37 | 886 | 891 | 209.3 |
| C | 9 | 54 | 118512 | 562.09 | 886 | 891 | 209.3 |
| D | 7 | 238 | 40763 | 182.67 | 894 | 865 | 218.4 |
| D | 10 | 70 | 39324 | 176.08 | 894 | 865 | 218.4 |
| D | 2 | 234 | 37613 | 168.25 | 894 | 865 | 218.4 |
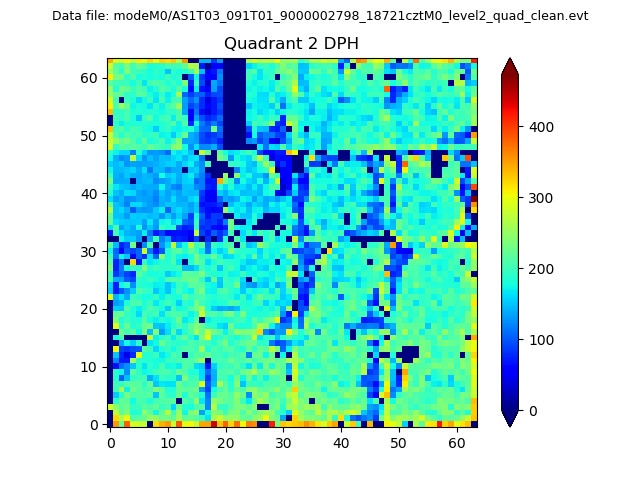
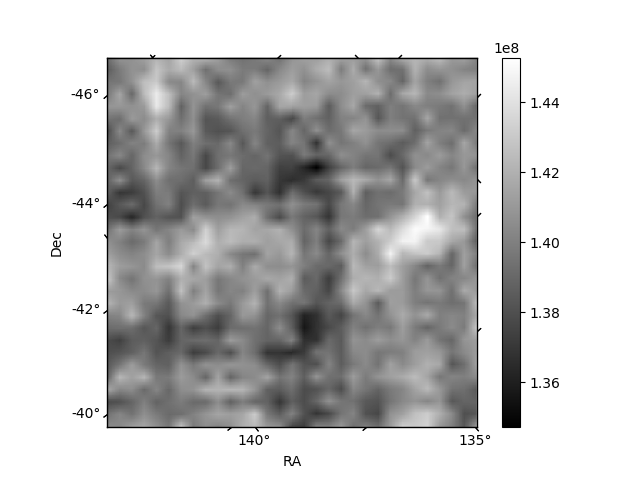
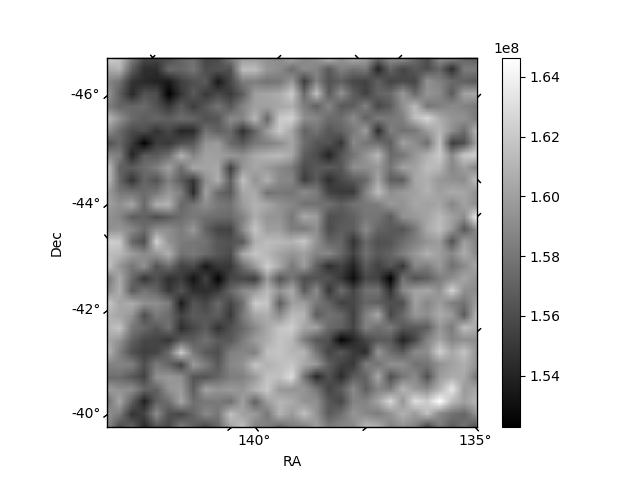
Histogram calculated using DETX and DETY for each event in the final _common_clean file
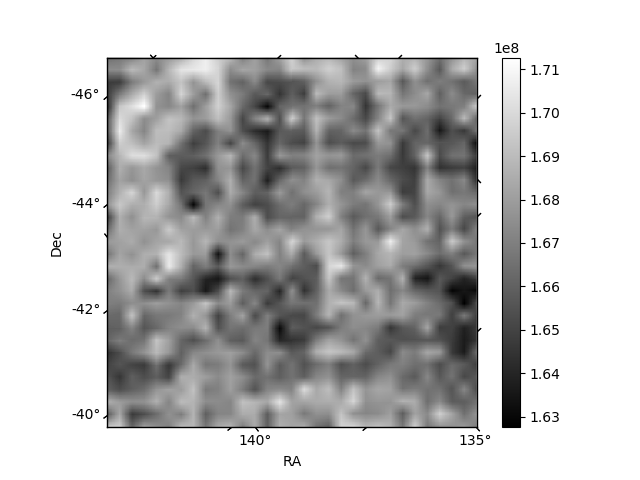
| Quadrant A |  |
 |
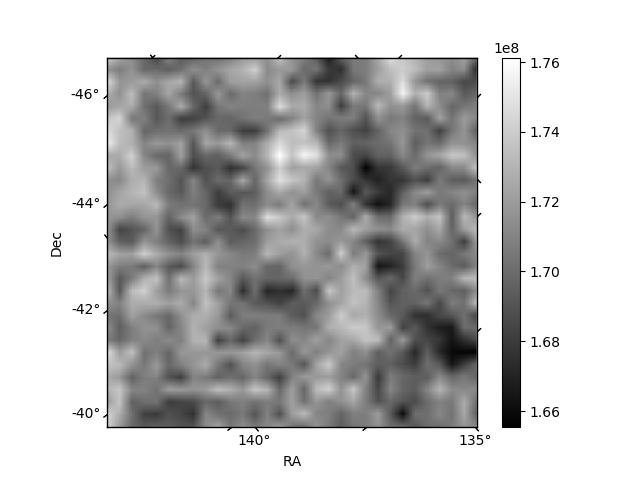
Quadrant B |
|---|---|---|---|
| Quadrant D |  |
 |
Quadrant C |
| Plot type | Count rate plots | Images |
|---|---|---|
| Comparison with Poisson distribution Blue bars denote a histogram of data divided into 1 sec bins. Red curve is a Poisson curve with rate = median count rate of data. |
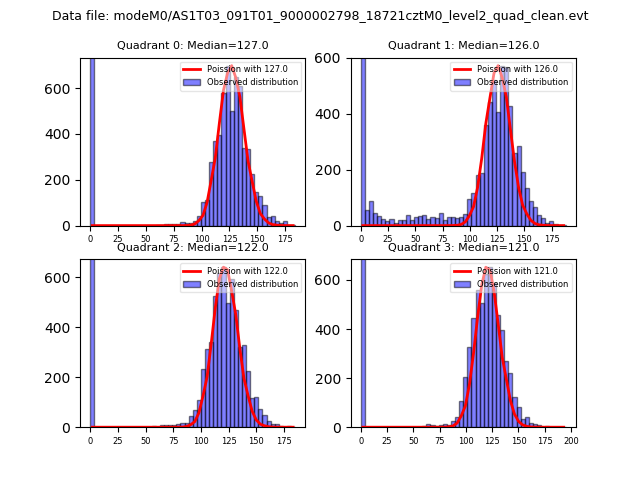 |
 |
| Quadrant-wise count rates Data is divided into 100 sec bins |
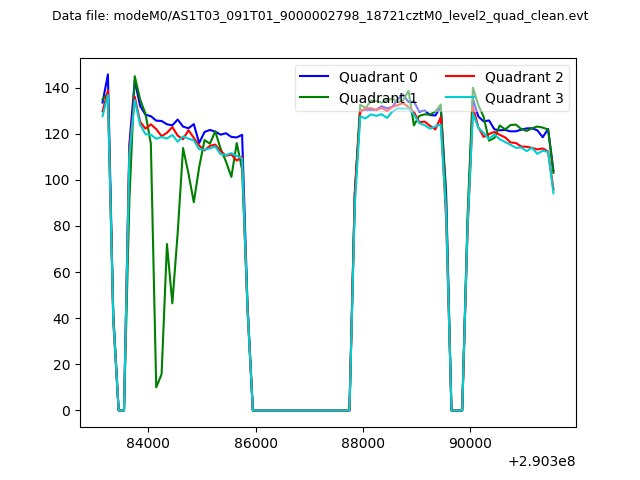 |
|
| Module-wise count rates for Quadrant A Data is divided into 100 sec bins |
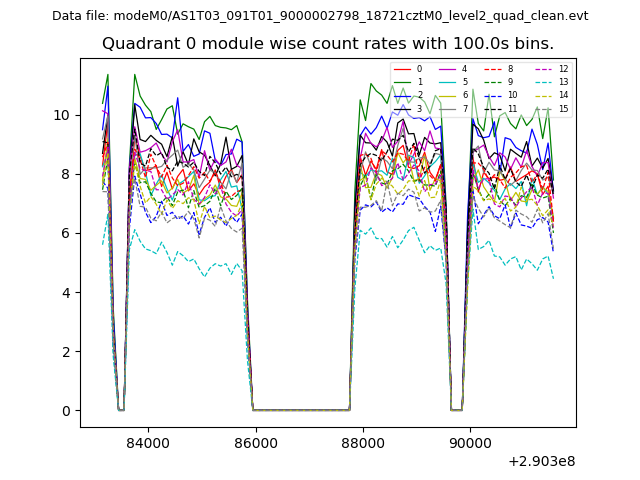 |
 |
| Module-wise count rates for Quadrant B Data is divided into 100 sec bins |
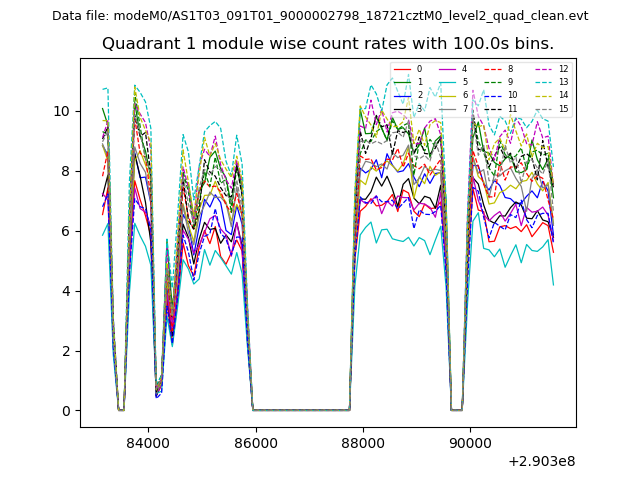 |
 |
| Module-wise count rates for Quadrant C Data is divided into 100 sec bins |
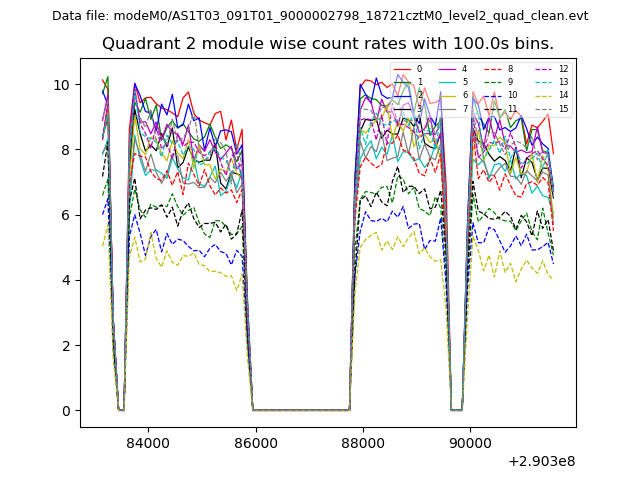 |
 |
| Module-wise count rates for Quadrant D Data is divided into 100 sec bins |
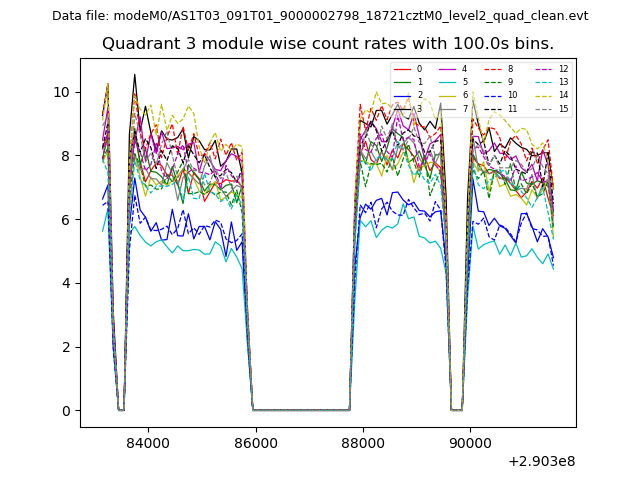 |
 |
| Parameter | Plot |
|---|---|
| CZT HV Monitor |  |
| D_VDD | 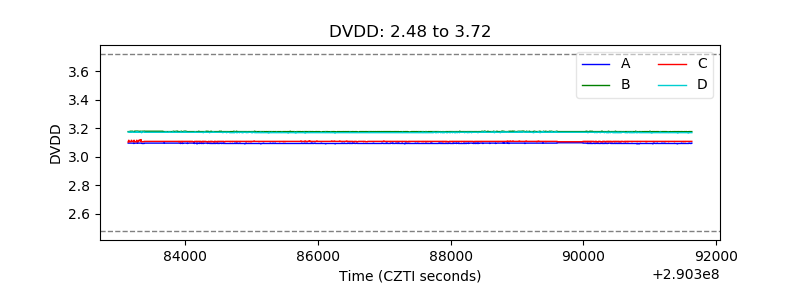 |
| Temperature 1 | 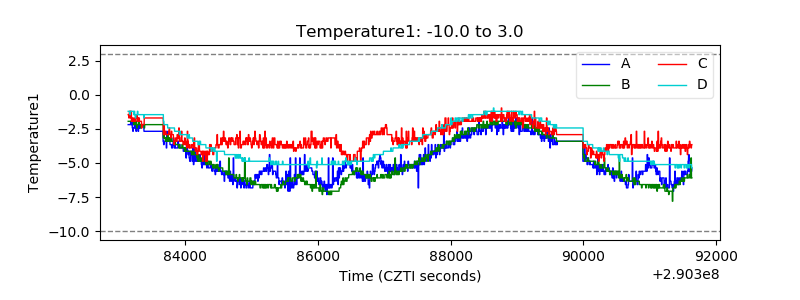 |
| Veto HV Monitor | 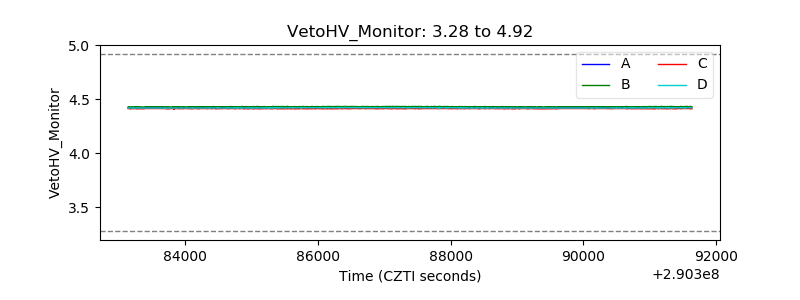 |
| Veto LLD | 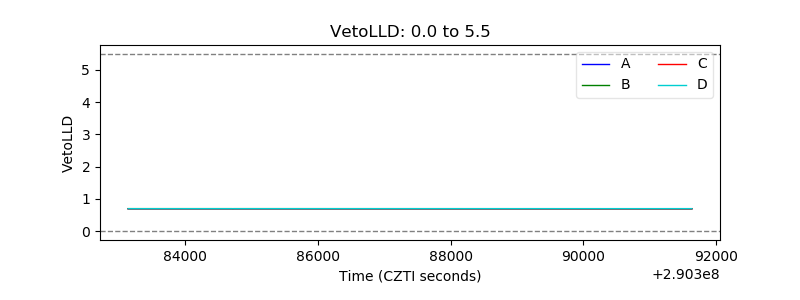 |
| Alpha Counter | 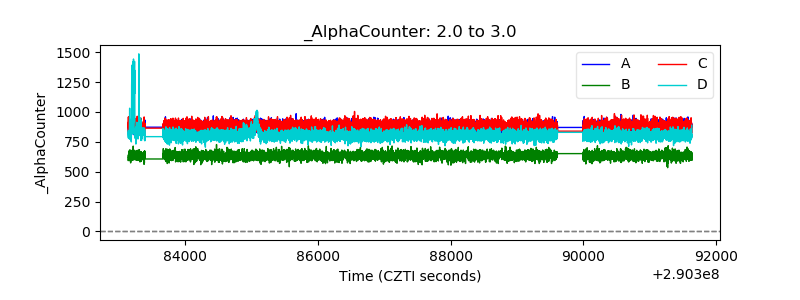 |
| _CPM_Rate | 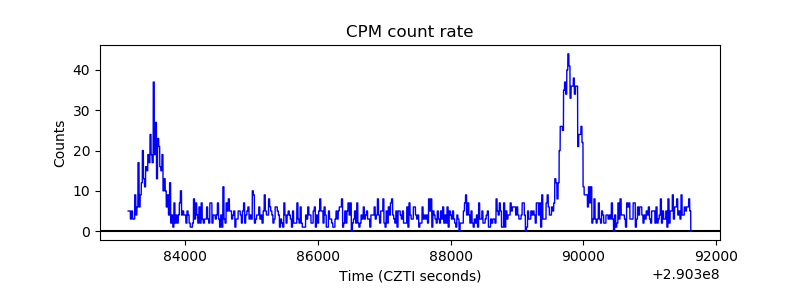 |
| CZT Counter | 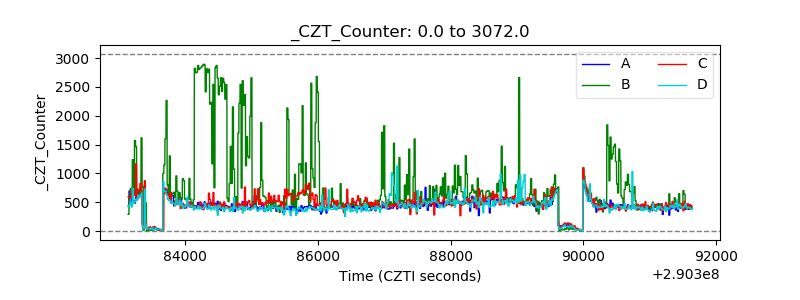 |
| +2.5 Volts monitor |  |
| +5 Volts monitor | 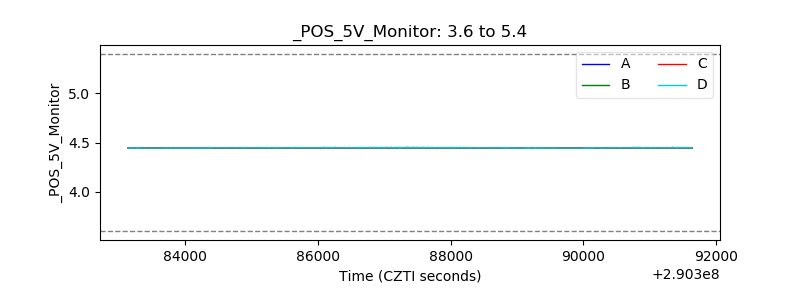 |
| _ROLL_ROT | 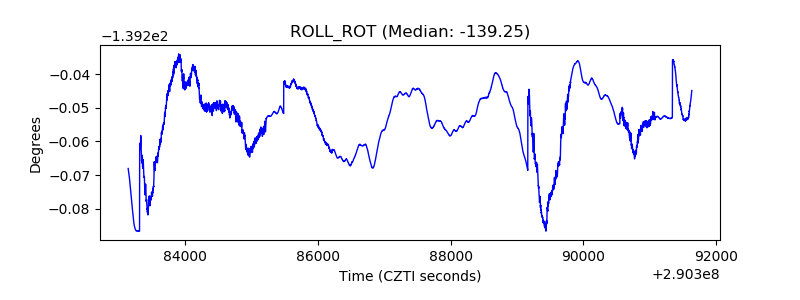 |
| _Roll_DEC | 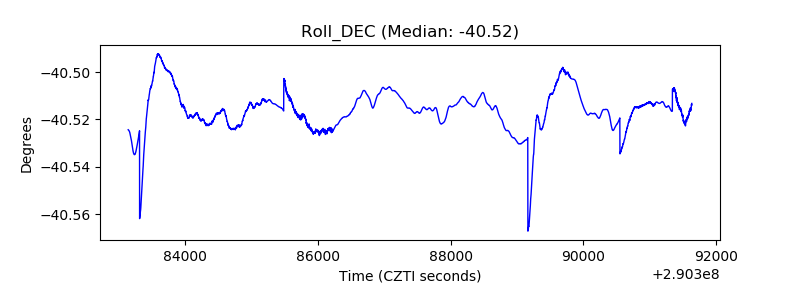 |
| _Roll_RA | 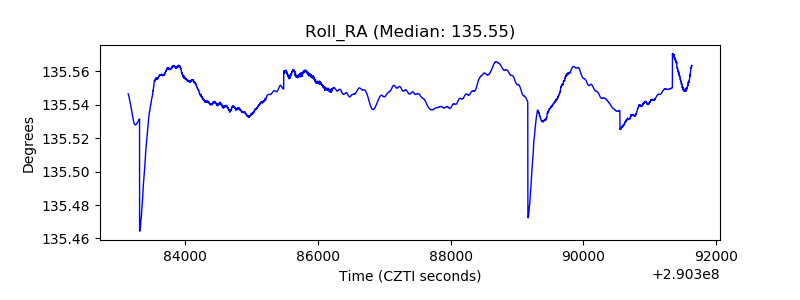 |
| Veto Counter | 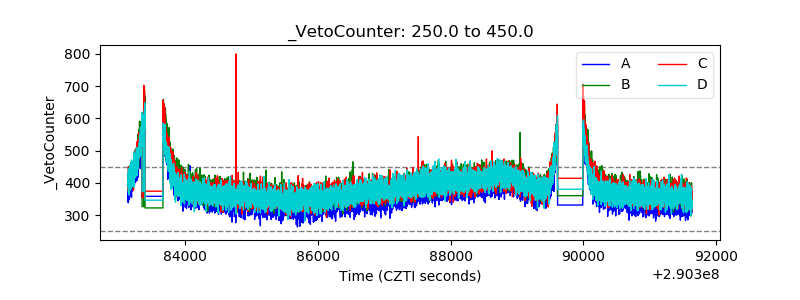 |