| Param | Original file | Final file |
|---|---|---|
| Filename | modeM0/AS1T03_091T01_9000002798_18723cztM0_level2.evt | modeM0/AS1T03_091T01_9000002798_18723cztM0_level2_quad_clean.evt |
| Size (bytes) | 817,004,160 | 142,395,840 |
| Size | 779.2 MB | 135.8 MB |
| Events in quadrant A | 5,062,738 | 904,575 |
| Events in quadrant B | 7,539,651 | 904,228 |
| Events in quadrant C | 5,537,427 | 872,574 |
| Events in quadrant D | 5,850,040 | 861,195 |
| Mode M0 | |||
|---|---|---|---|
| Quadrant | BADHDUFLAG | Total packets | Discarded packets |
| A | 0 | 22548 | 2 |
| B | 0 | 29694 | 2 |
| C | 0 | 23877 | 2 |
| D | 0 | 25497 | 2 |
| Mode M9 | |||
|---|---|---|---|
| Quadrant | BADHDUFLAG | Total packets | Discarded packets |
| A | 0 | 10 | 0 |
| B | 0 | 10 | 0 |
| C | 0 | 10 | 0 |
| D | 0 | 10 | 0 |
| Mode SS | |||
|---|---|---|---|
| Quadrant | BADHDUFLAG | Total packets | Discarded packets |
| A | 0 | 226 | 0 |
| B | 0 | 226 | 0 |
| C | 0 | 226 | 0 |
| D | 0 | 226 | 0 |
| Quadrant | Total seconds | Saturated seconds | Saturation percentage |
|---|---|---|---|
| A | 11126 | 48 | 0.431422% |
| B | 11127 | 646 | 5.805698% |
| C | 11127 | 100 | 0.898715% |
| D | 11127 | 154 | 1.384021% |
Noise dominated data is calculated using 1-second bins in cleaned event files. If a bin has >2000 counts, and if more than 50% of those come from <1% of pixels, then it is considered to be noise-dominated and hence unusable.
| Quadrant | # 1 sec bins | Bins with >0 counts | Bins with >2000 counts | High rate bins dominated by noise | Noise dominated (total time) | Noise dominated (detector-on time) | Marked lightcurve |
|---|---|---|---|---|---|---|---|
| A | 12076 | 11128 | 1 | 1 | 0.01% | 0.01% | 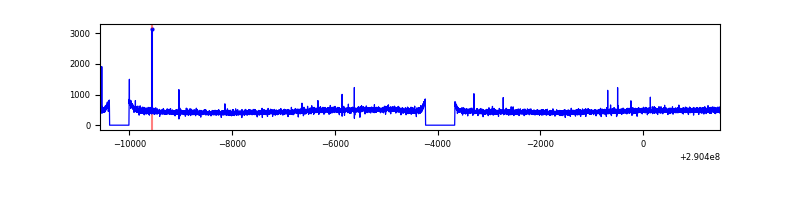 |
| B | 12077 | 11129 | 423 | 423 | 3.50% | 3.80% | 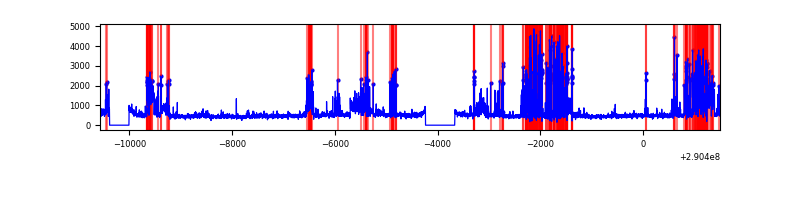 |
| C | 12077 | 11129 | 0 | 0 | 0.00% | 0.00% | 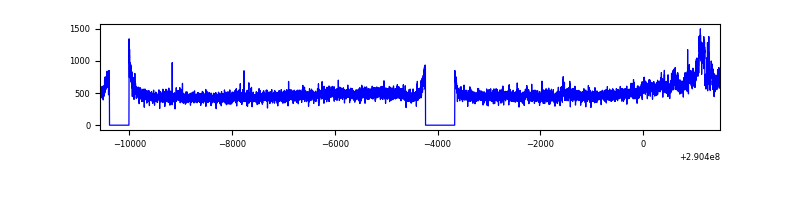 |
| D | 12077 | 11129 | 73 | 73 | 0.60% | 0.66% | 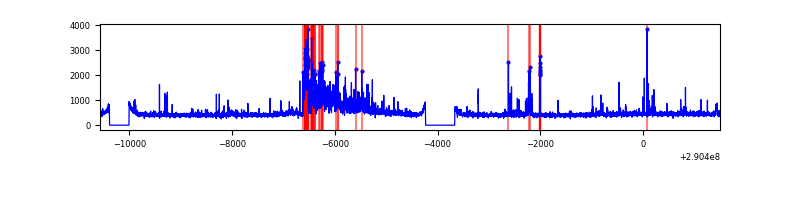 |
Top three noisy pixels from each quadrant. If the there are fewer than three noisy pixels in the level2.evt file, extra rows are filled as -1
| Pixel properties | Quadrant properties | ||||||
|---|---|---|---|---|---|---|---|
| Quadrant | DetID | PixID | Counts | Sigma | Mean | Median | Sigma |
| A | 13 | 254 | 17238 | 60.87 | 1305 | 1277 | 262.2 |
| A | 0 | 13 | 11872 | 40.41 | 1305 | 1277 | 262.2 |
| A | 15 | 192 | 11787 | 40.08 | 1305 | 1277 | 262.2 |
| B | 10 | 245 | 2482219 | 10226.88 | 1274 | 1240 | 242.6 |
| B | 12 | 111 | 30047 | 118.75 | 1274 | 1240 | 242.6 |
| B | 11 | 111 | 25702 | 100.84 | 1274 | 1240 | 242.6 |
| C | 3 | 233 | 461141 | 1574.56 | 1248 | 1253 | 292.1 |
| C | 14 | 238 | 193010 | 656.54 | 1248 | 1253 | 292.1 |
| C | 8 | 128 | 12611 | 38.89 | 1248 | 1253 | 292.1 |
| D | 1 | 52 | 668632 | 2190.83 | 1259 | 1221 | 304.6 |
| D | 14 | 34 | 191098 | 623.29 | 1259 | 1221 | 304.6 |
| D | 7 | 238 | 141545 | 460.63 | 1259 | 1221 | 304.6 |
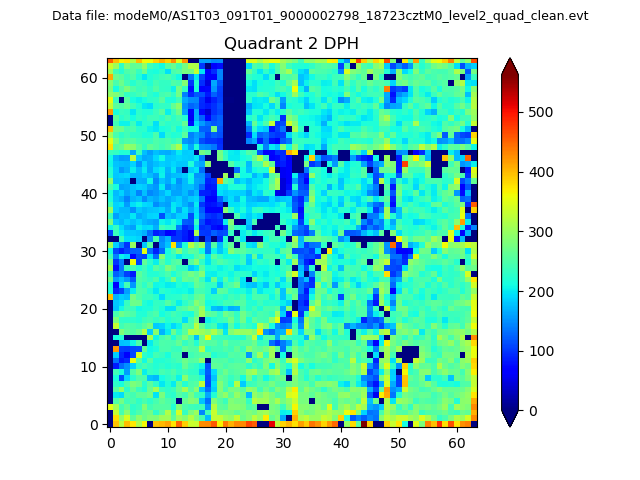
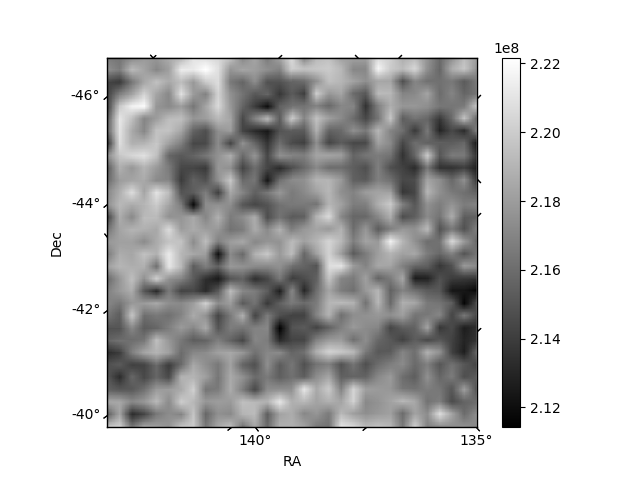
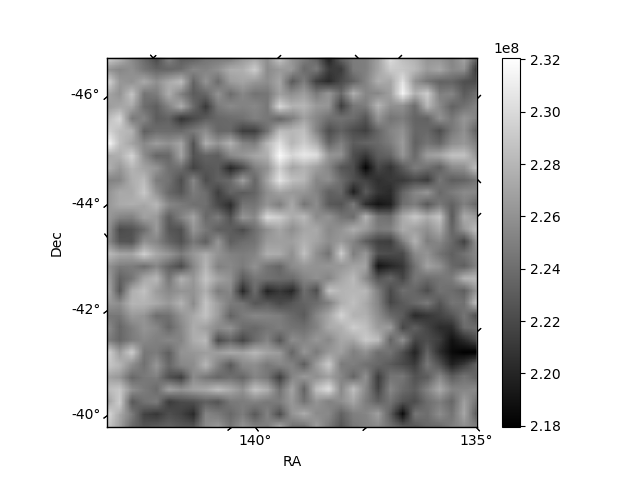
Histogram calculated using DETX and DETY for each event in the final _common_clean file
| Quadrant A | 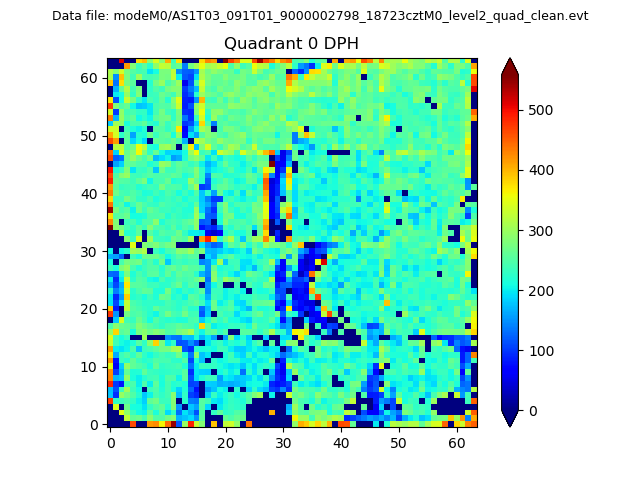 |
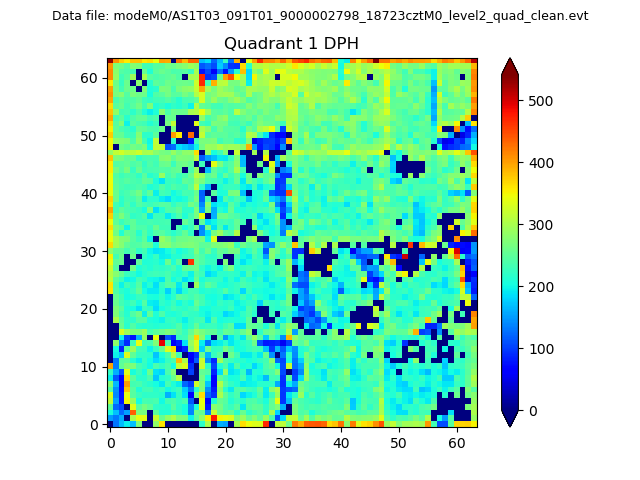 |
Quadrant B |
|---|---|---|---|
| Quadrant D | 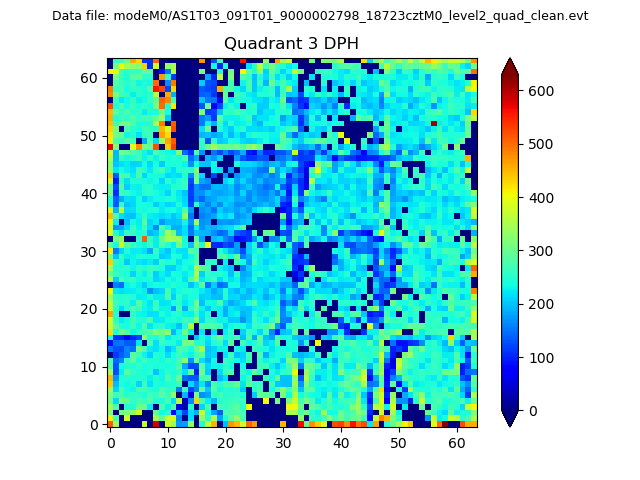 |
 |
Quadrant C |
| Plot type | Count rate plots | Images |
|---|---|---|
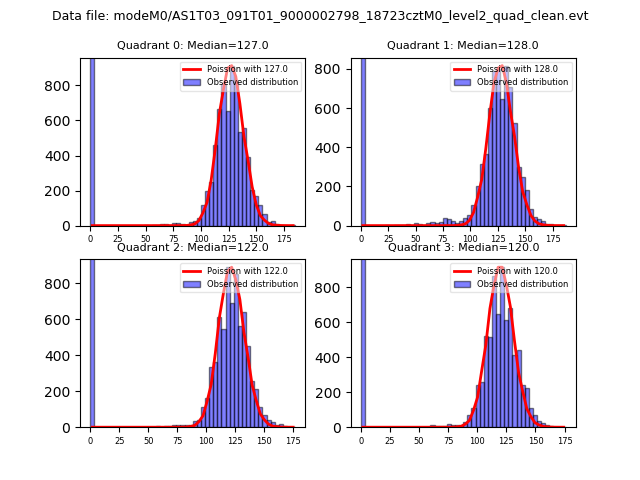
| Comparison with Poisson distribution Blue bars denote a histogram of data divided into 1 sec bins. Red curve is a Poisson curve with rate = median count rate of data. |
 |
 |
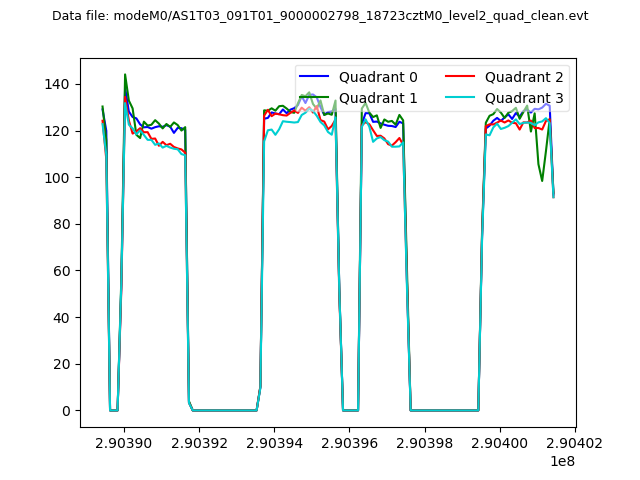
| Quadrant-wise count rates Data is divided into 100 sec bins |
 |
|
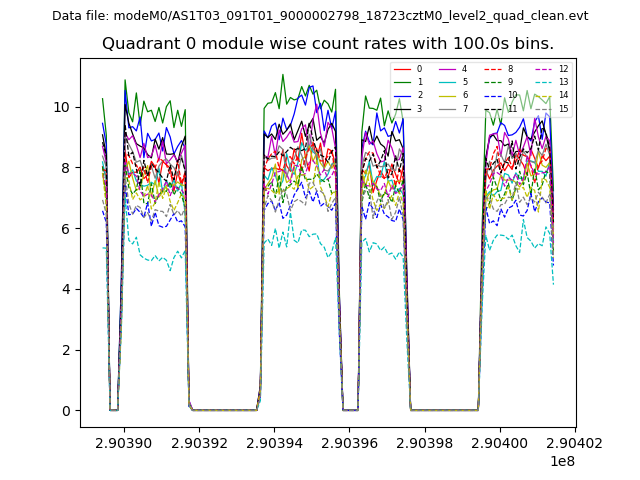
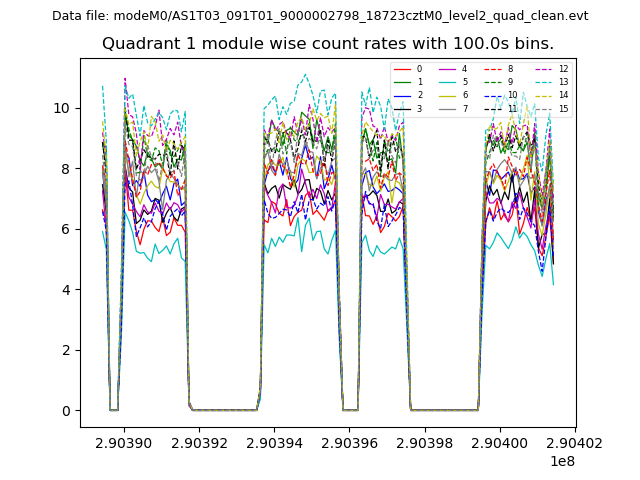
| Module-wise count rates for Quadrant A Data is divided into 100 sec bins |
 |
 |
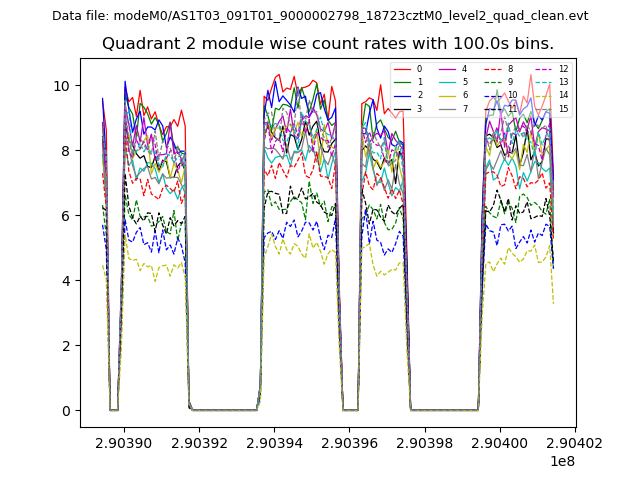
| Module-wise count rates for Quadrant B Data is divided into 100 sec bins |
 |
 |
| Module-wise count rates for Quadrant C Data is divided into 100 sec bins |
 |
 |
| Module-wise count rates for Quadrant D Data is divided into 100 sec bins |
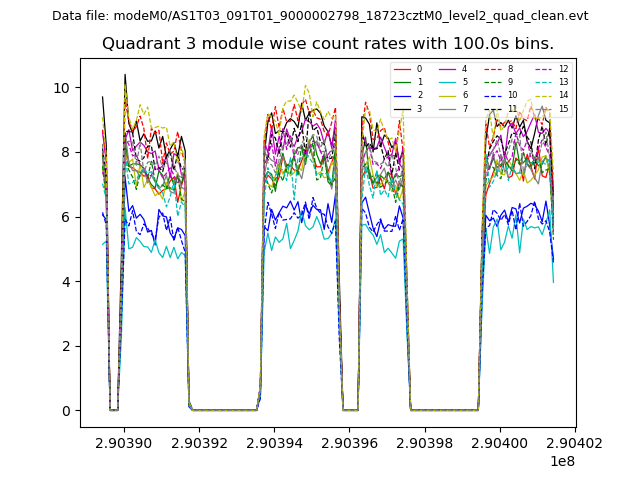 |
 |
| Parameter | Plot |
|---|---|
| CZT HV Monitor |  |
| D_VDD | 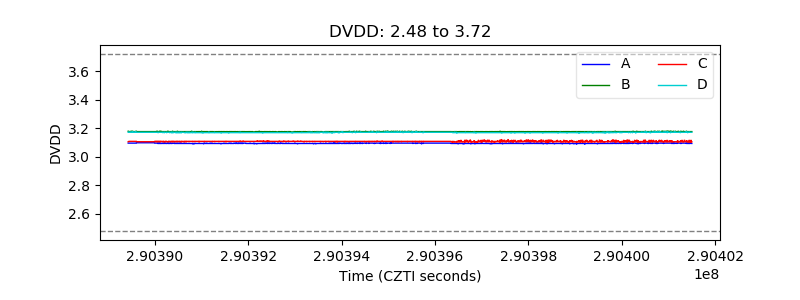 |
| Temperature 1 | 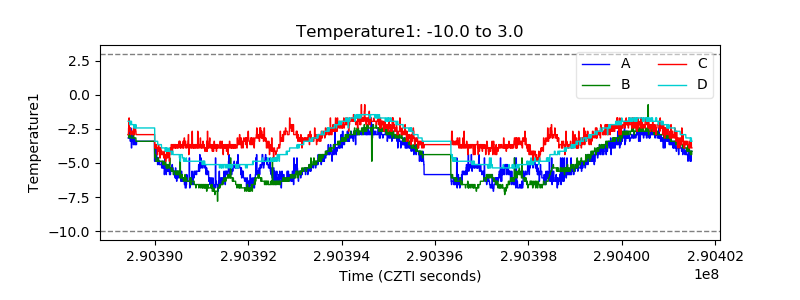 |
| Veto HV Monitor | 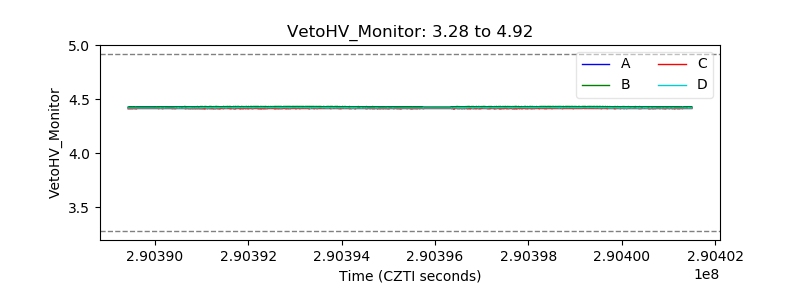 |
| Veto LLD |  |
| Alpha Counter | 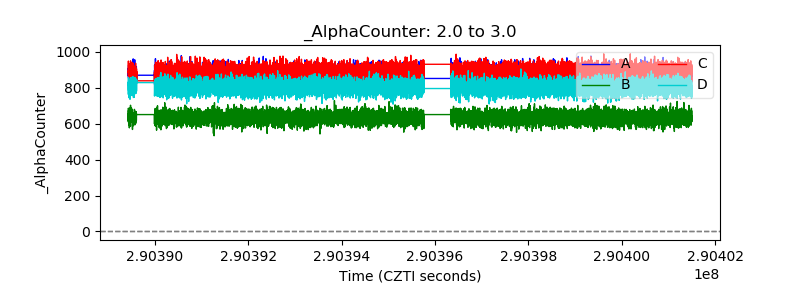 |
| _CPM_Rate | 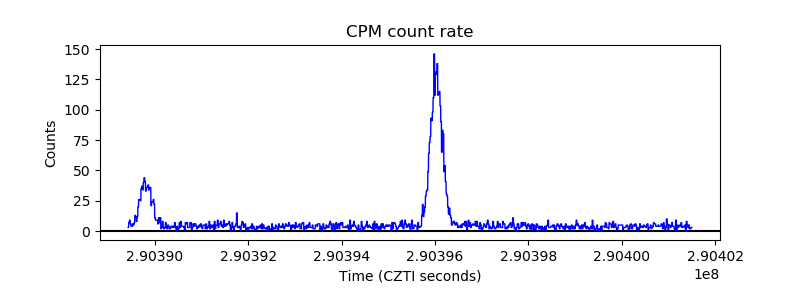 |
| CZT Counter | 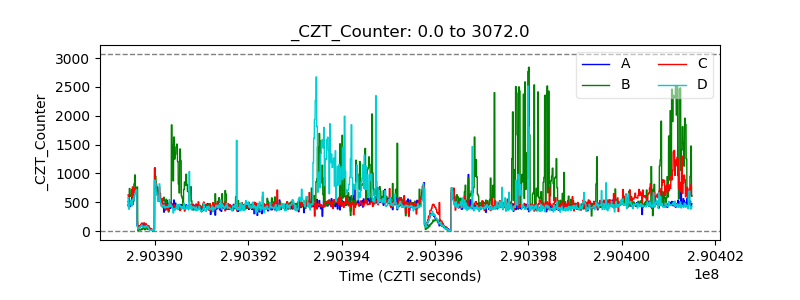 |
| +2.5 Volts monitor |  |
| +5 Volts monitor | 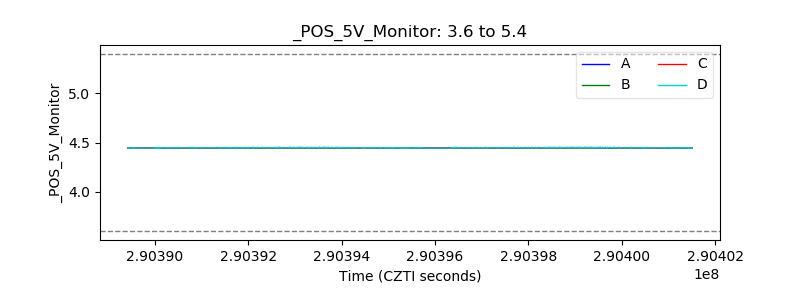 |
| _ROLL_ROT | 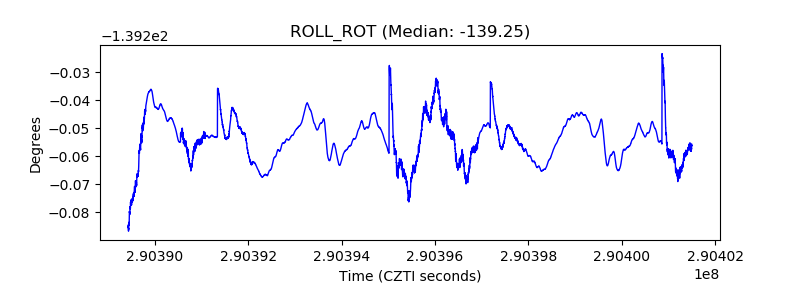 |
| _Roll_DEC | 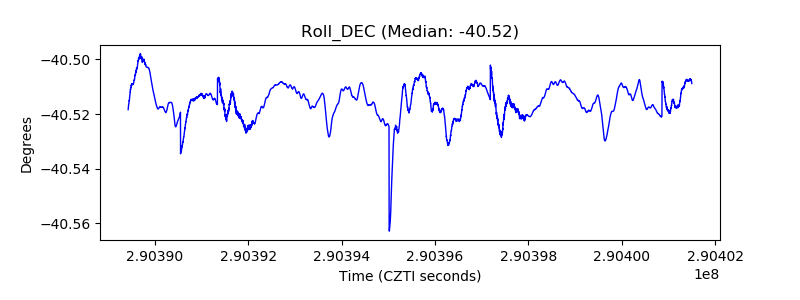 |
| _Roll_RA | 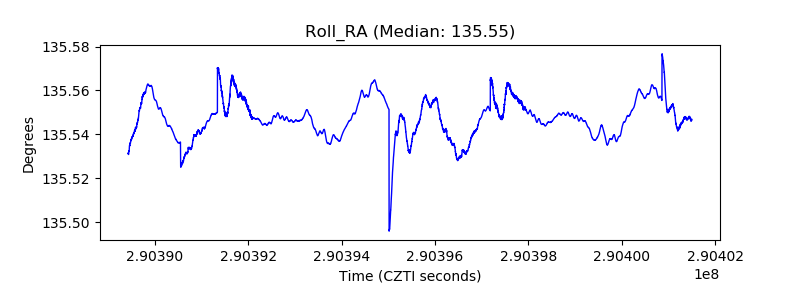 |
| Veto Counter | 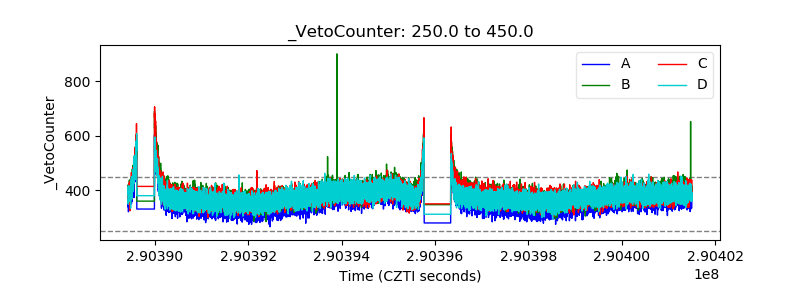 |