| Param | Original file | Final file |
|---|---|---|
| Filename | modeM0/AS1T03_091T01_9000002798_18724cztM0_level2.evt | modeM0/AS1T03_091T01_9000002798_18724cztM0_level2_quad_clean.evt |
| Size (bytes) | 105,520,320 | 20,914,560 |
| Size | 100.6 MB | 19.9 MB |
| Events in quadrant A | 553,903 | 142,563 |
| Events in quadrant B | 1,173,884 | 135,273 |
| Events in quadrant C | 846,330 | 134,474 |
| Events in quadrant D | 543,860 | 136,412 |
| Mode M0 | |||
|---|---|---|---|
| Quadrant | BADHDUFLAG | Total packets | Discarded packets |
| A | 0 | 2321 | 1 |
| B | 0 | 4217 | 1 |
| C | 0 | 3358 | 1 |
| D | 0 | 2382 | 1 |
| Mode M9 | |||
|---|---|---|---|
| Quadrant | BADHDUFLAG | Total packets | Discarded packets |
| A | 0 | 7 | 0 |
| B | 0 | 7 | 0 |
| C | 0 | 7 | 0 |
| D | 0 | 7 | 0 |
| Mode SS | |||
|---|---|---|---|
| Quadrant | BADHDUFLAG | Total packets | Discarded packets |
| A | 0 | 24 | 0 |
| B | 0 | 24 | 0 |
| C | 0 | 24 | 0 |
| D | 0 | 24 | 0 |
| Quadrant | Total seconds | Saturated seconds | Saturation percentage |
|---|---|---|---|
| A | 1102 | 28 | 2.540835% |
| B | 1102 | 258 | 23.411978% |
| C | 1102 | 78 | 7.078040% |
| D | 1102 | 26 | 2.359347% |
Noise dominated data is calculated using 1-second bins in cleaned event files. If a bin has >2000 counts, and if more than 50% of those come from <1% of pixels, then it is considered to be noise-dominated and hence unusable.
| Quadrant | # 1 sec bins | Bins with >0 counts | Bins with >2000 counts | High rate bins dominated by noise | Noise dominated (total time) | Noise dominated (detector-on time) | Marked lightcurve |
|---|---|---|---|---|---|---|---|
| A | 1797 | 1103 | 0 | 0 | 0.00% | 0.00% | 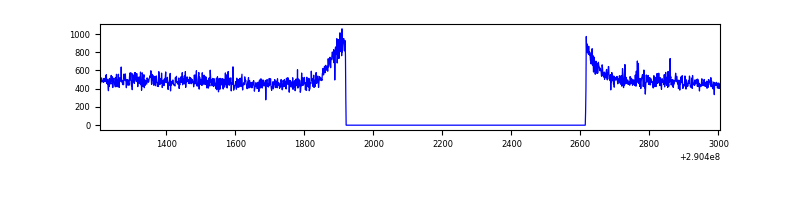 |
| B | 1797 | 1103 | 139 | 139 | 7.74% | 12.60% | 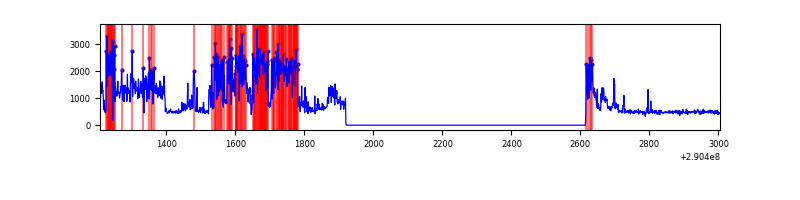 |
| C | 1797 | 1103 | 1 | 1 | 0.06% | 0.09% | 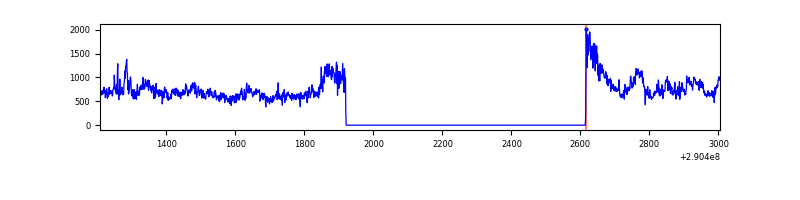 |
| D | 1797 | 1103 | 0 | 0 | 0.00% | 0.00% | 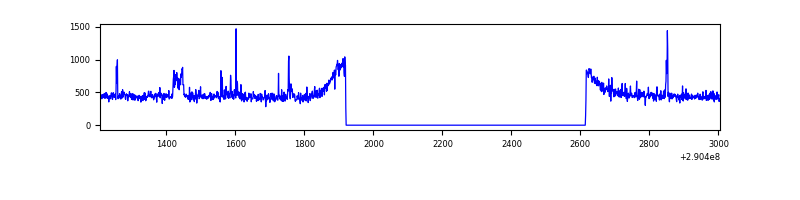 |
Top three noisy pixels from each quadrant. If the there are fewer than three noisy pixels in the level2.evt file, extra rows are filled as -1
| Pixel properties | Quadrant properties | ||||||
|---|---|---|---|---|---|---|---|
| Quadrant | DetID | PixID | Counts | Sigma | Mean | Median | Sigma |
| A | 9 | 143 | 2529 | 78.31 | 142 | 139 | 30.5 |
| A | 15 | 192 | 2239 | 68.8 | 142 | 139 | 30.5 |
| A | 13 | 254 | 1799 | 54.39 | 142 | 139 | 30.5 |
| B | 10 | 245 | 638979 | 22016.29 | 135 | 132 | 29.0 |
| B | 12 | 111 | 3302 | 109.25 | 135 | 132 | 29.0 |
| B | 0 | 182 | 2769 | 90.88 | 135 | 132 | 29.0 |
| C | 3 | 233 | 308017 | 9243.06 | 132 | 132 | 33.3 |
| C | 14 | 238 | 19430 | 579.35 | 132 | 132 | 33.3 |
| C | 8 | 128 | 1434 | 39.09 | 132 | 132 | 33.3 |
| D | 14 | 34 | 20097 | 568.05 | 136 | 131 | 35.1 |
| D | 2 | 234 | 4743 | 131.22 | 136 | 131 | 35.1 |
| D | 10 | 70 | 4018 | 110.59 | 136 | 131 | 35.1 |
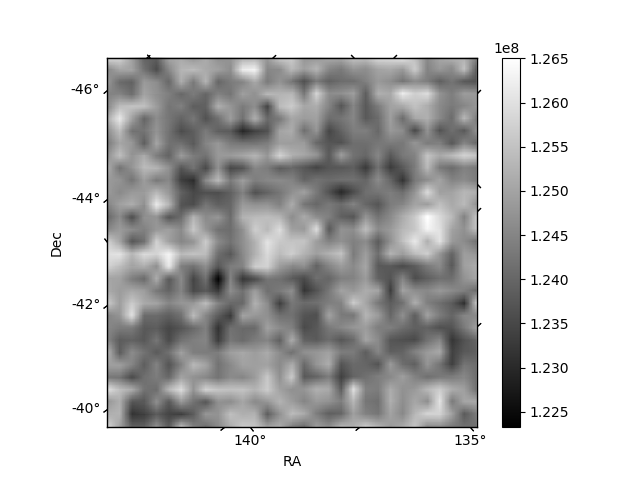
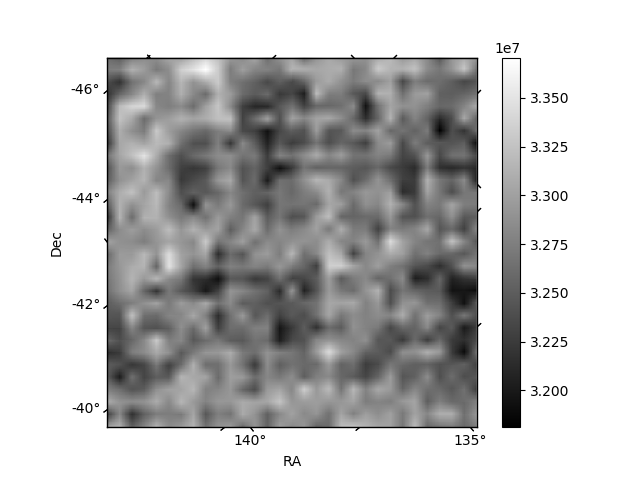
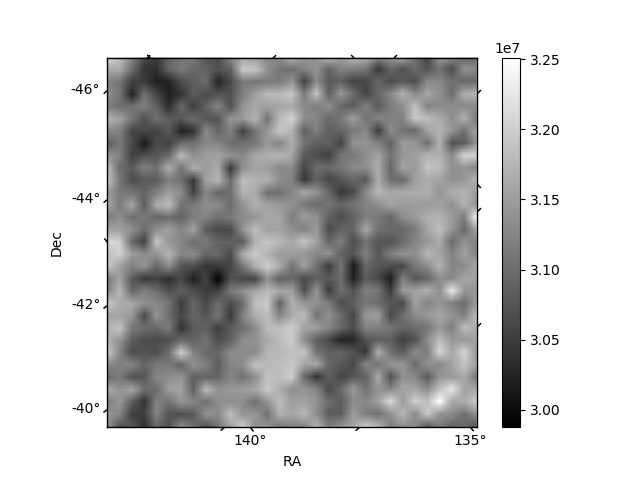
Histogram calculated using DETX and DETY for each event in the final _common_clean file
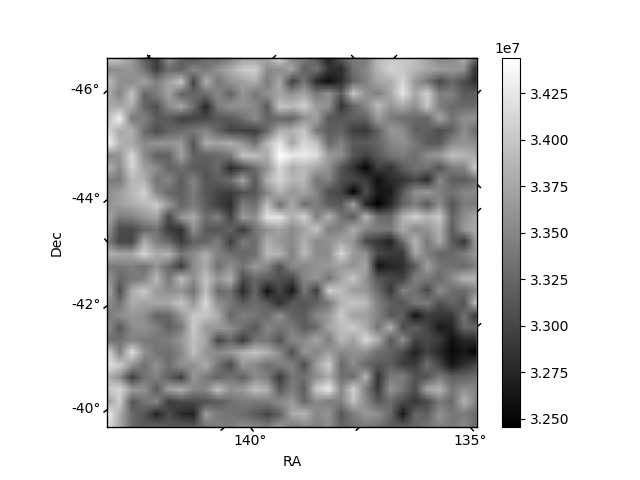
| Quadrant A | 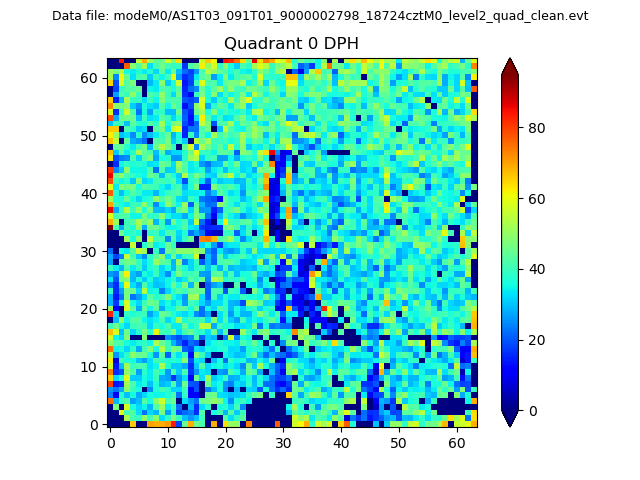 |
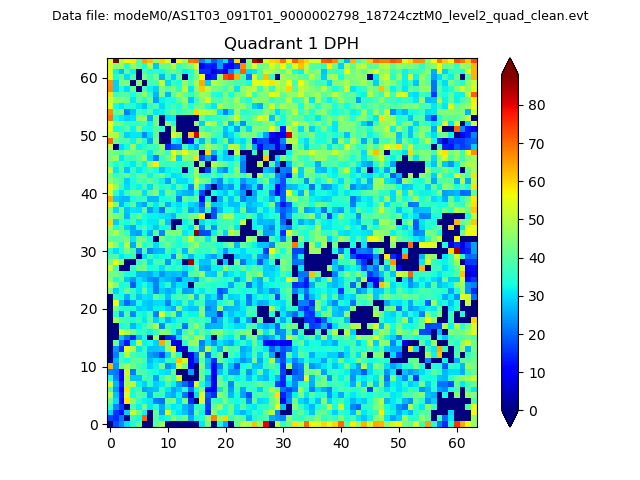 |
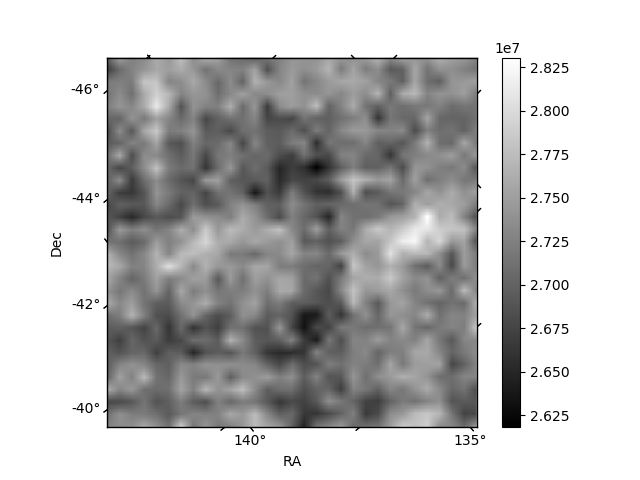
Quadrant B |
|---|---|---|---|
| Quadrant D | 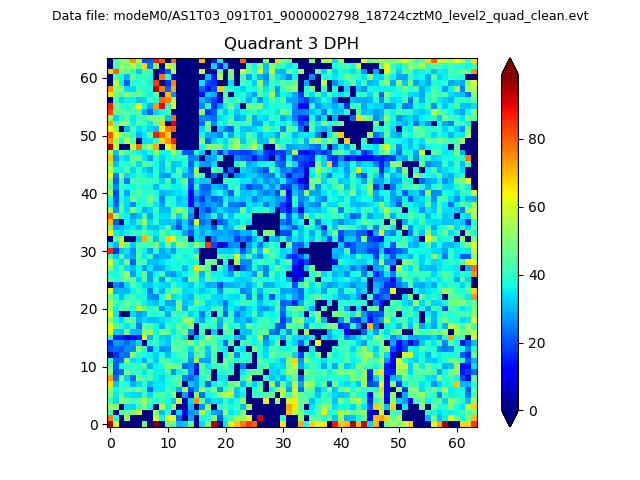 |
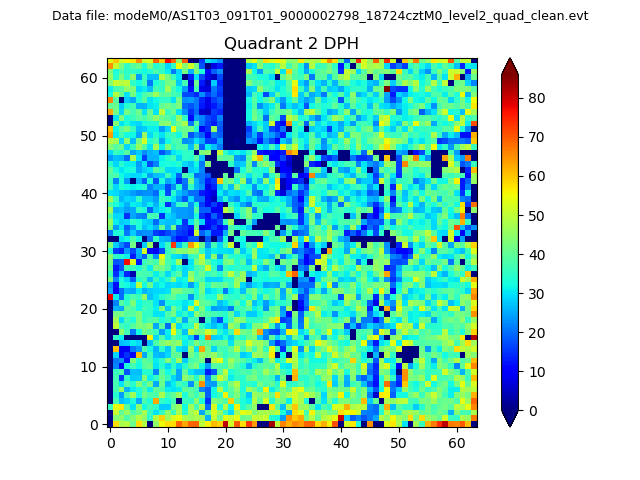 |
Quadrant C |
| Plot type | Count rate plots | Images |
|---|---|---|
| Comparison with Poisson distribution Blue bars denote a histogram of data divided into 1 sec bins. Red curve is a Poisson curve with rate = median count rate of data. |
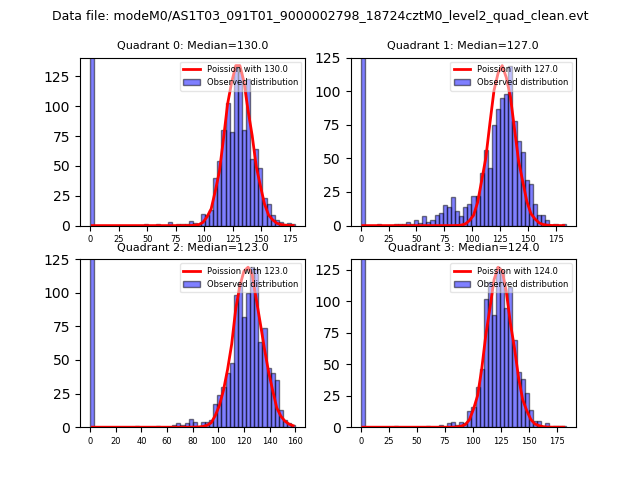 |
 |
| Quadrant-wise count rates Data is divided into 100 sec bins |
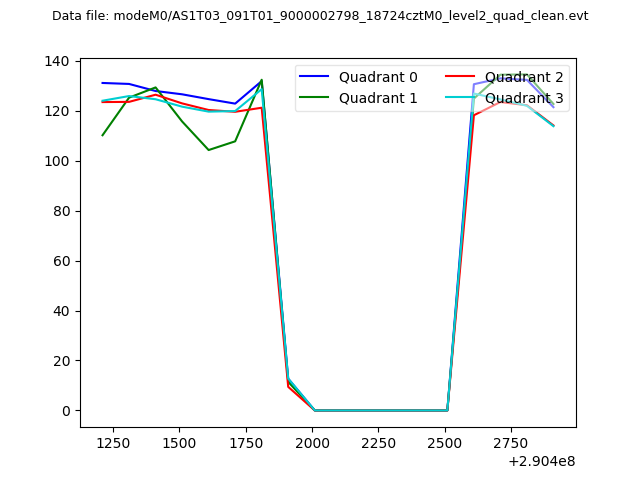 |
|
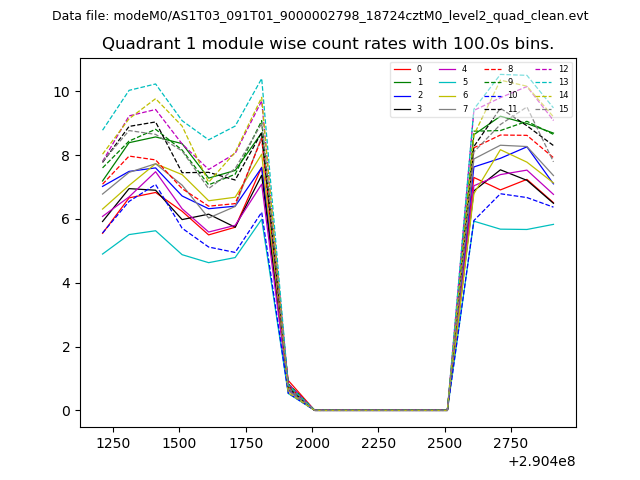
| Module-wise count rates for Quadrant A Data is divided into 100 sec bins |
 |
 |
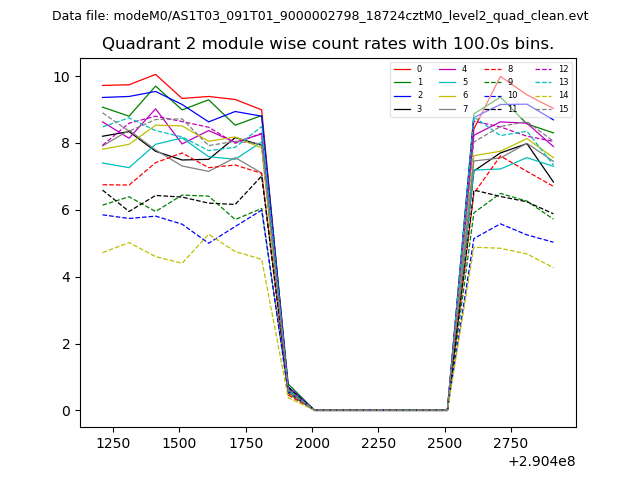
| Module-wise count rates for Quadrant B Data is divided into 100 sec bins |
 |
 |
| Module-wise count rates for Quadrant C Data is divided into 100 sec bins |
 |
 |
| Module-wise count rates for Quadrant D Data is divided into 100 sec bins |
 |
 |
| Parameter | Plot |
|---|---|
| CZT HV Monitor |  |
| D_VDD | 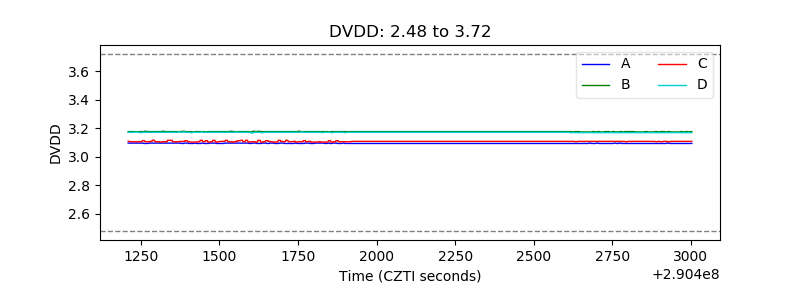 |
| Temperature 1 | 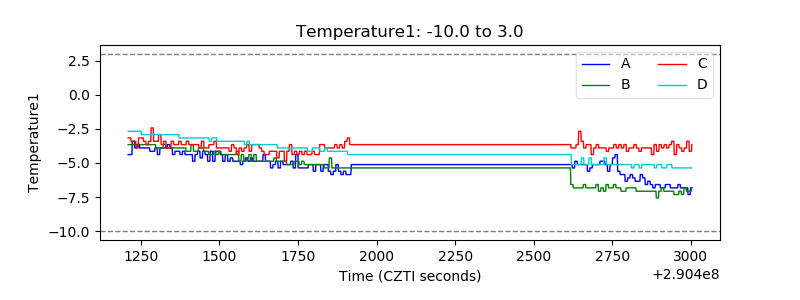 |
| Veto HV Monitor | 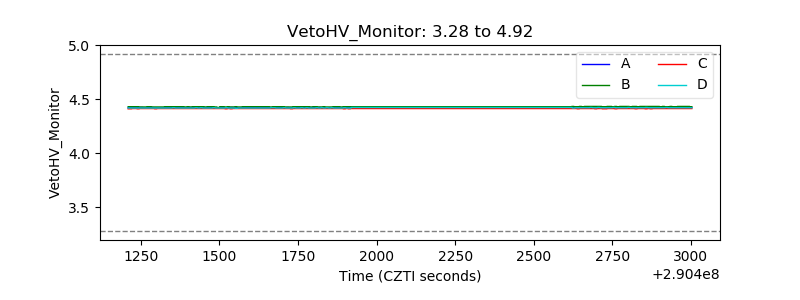 |
| Veto LLD | 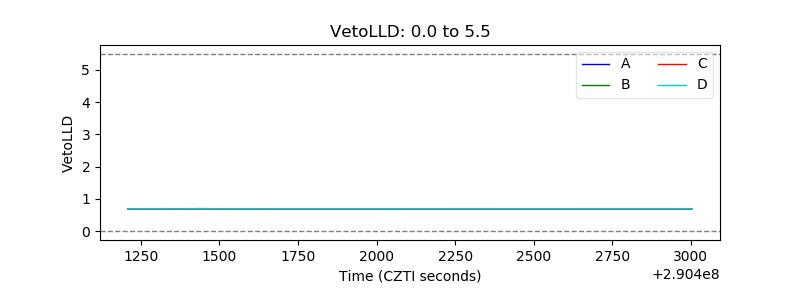 |
| Alpha Counter | 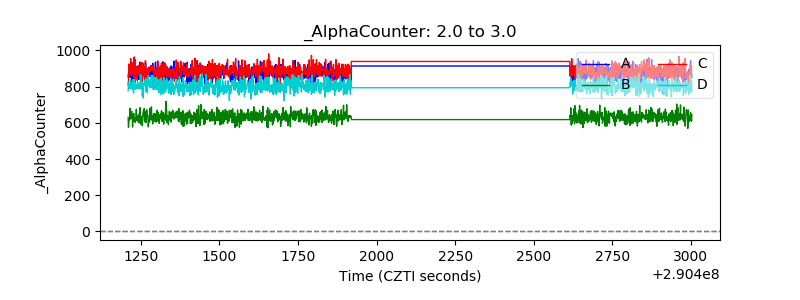 |
| _CPM_Rate | 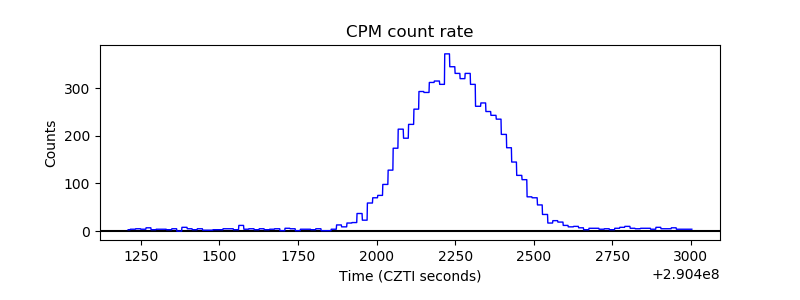 |
| CZT Counter | 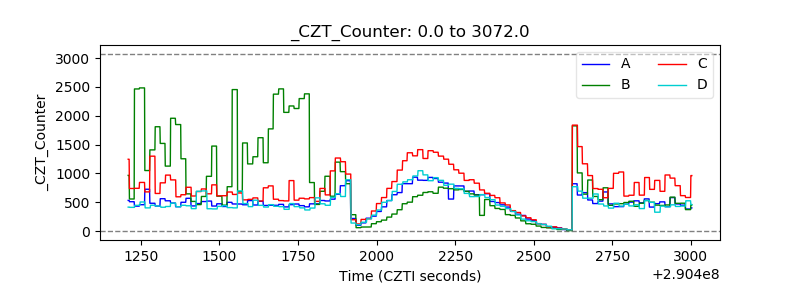 |
| +2.5 Volts monitor |  |
| +5 Volts monitor |  |
| _ROLL_ROT |  |
| _Roll_DEC | 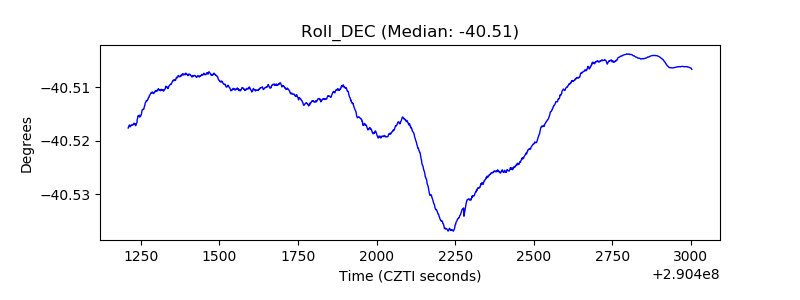 |
| _Roll_RA | 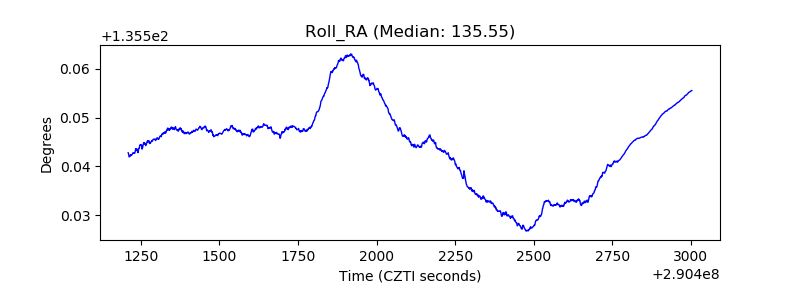 |
| Veto Counter |  |