| Param | Original file | Final file |
|---|---|---|
| Filename | modeM0/AS1A05_072T04_9000002802cztM0_level2.fits | modeM0/AS1A05_072T04_9000002802cztM0_level2_quad_clean.evt |
| Size (bytes) | 738,460,800 | 701,899,200 |
| Size | 704.3 MB | 669.4 MB |
| Events in quadrant A | 4,563,822 | 4,167,673 |
| Events in quadrant B | 4,312,728 | 4,148,135 |
| Events in quadrant C | 4,447,498 | 4,060,928 |
| Events in quadrant D | 3,921,298 | 3,762,114 |
| Mode SS | |||
|---|---|---|---|
| Quadrant | BADHDUFLAG | Total packets | Discarded packets |
| A | 0 | 1526 | 0 |
| B | 0 | 1526 | 0 |
| C | 0 | 1526 | 0 |
| D | 0 | 1526 | 0 |
| Mode M9 | |||
|---|---|---|---|
| Quadrant | BADHDUFLAG | Total packets | Discarded packets |
| A | 0 | 121 | 0 |
| B | 0 | 121 | 0 |
| C | 0 | 121 | 0 |
| D | 0 | 121 | 0 |
| Mode M0 | |||
|---|---|---|---|
| Quadrant | BADHDUFLAG | Total packets | Discarded packets |
| A | 0 | 161176 | 0 |
| B | 0 | 181293 | 0 |
| C | 0 | 156549 | 0 |
| D | 0 | 164463 | 0 |
| Quadrant | Total seconds | Saturated seconds | Saturation percentage |
|---|---|---|---|
| A | 74633 | 859 | 1.150965% |
| B | 74633 | 2375 | 3.182238% |
| C | 74633 | 1111 | 1.488618% |
| D | 74633 | 1427 | 1.912023% |
Noise dominated data is calculated using 1-second bins in cleaned event files. If a bin has >2000 counts, and if more than 50% of those come from <1% of pixels, then it is considered to be noise-dominated and hence unusable.
| Quadrant | # 1 sec bins | Bins with >0 counts | Bins with >2000 counts | High rate bins dominated by noise | Noise dominated (total time) | Noise dominated (detector-on time) | Marked lightcurve |
|---|---|---|---|---|---|---|---|
| A | 86949 | 74635 | 0 | 0 | 0.00% | 0.00% |  |
| B | 86949 | 74631 | 0 | 0 | 0.00% | 0.00% |  |
| C | 86949 | 74633 | 0 | 0 | 0.00% | 0.00% | 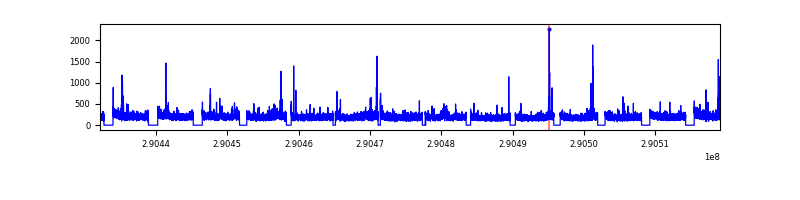 |
| D | 86949 | 74539 | 0 | 0 | 0.00% | 0.00% |  |
Top three noisy pixels from each quadrant. If the there are fewer than three noisy pixels in the level2.evt file, extra rows are filled as -1
| Pixel properties | Quadrant properties | ||||||
|---|---|---|---|---|---|---|---|
| Quadrant | DetID | PixID | Counts | Sigma | Mean | Median | Sigma |
| A | 0 | 29 | 4249 | 10.81 | 1188 | 1118 | 289.5 |
| A | 7 | 110 | 3669 | 8.81 | 1188 | 1118 | 289.5 |
| A | 9 | 19 | 3448 | 8.05 | 1188 | 1118 | 289.5 |
| B | 2 | 9 | 3519 | 10.89 | 1142 | 1093 | 222.8 |
| B | 2 | 8 | 2936 | 8.27 | 1142 | 1093 | 222.8 |
| B | 14 | 254 | 2878 | 8.01 | 1142 | 1093 | 222.8 |
| C | 12 | 241 | 3133 | 6.82 | 1175 | 1099 | 298.3 |
| C | 2 | 191 | 3023 | 6.45 | 1175 | 1099 | 298.3 |
| C | 3 | 126 | 2997 | 6.36 | 1175 | 1099 | 298.3 |
| D | 10 | 190 | 2984 | 6.66 | 1119 | 1022 | 294.7 |
| D | 6 | 231 | 2821 | 6.1 | 1119 | 1022 | 294.7 |
| D | 7 | 3 | 2781 | 5.97 | 1119 | 1022 | 294.7 |
Histogram calculated using DETX and DETY for each event in the final _common_clean file
| Quadrant A | 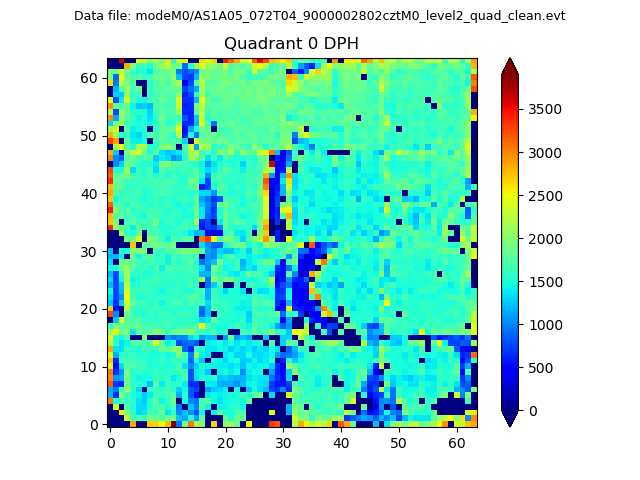 |
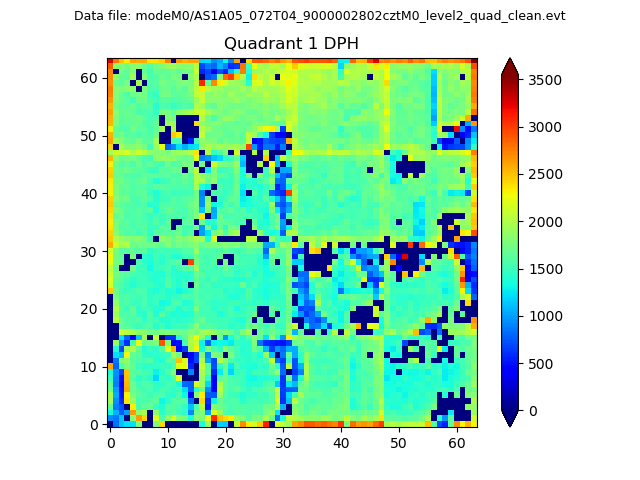 |
Quadrant B |
|---|---|---|---|
| Quadrant D |  |
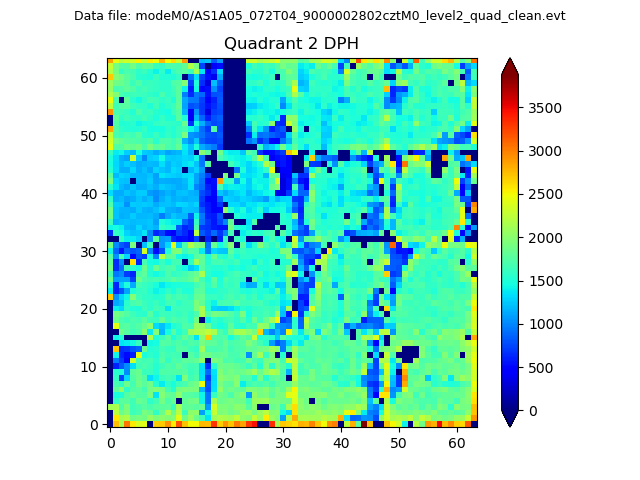 |
Quadrant C |
| Plot type | Count rate plots | Images |
|---|---|---|
| Comparison with Poisson distribution Blue bars denote a histogram of data divided into 1 sec bins. Red curve is a Poisson curve with rate = median count rate of data. |
 |
 |
| Quadrant-wise count rates Data is divided into 100 sec bins |
 |
|
| Module-wise count rates for Quadrant A Data is divided into 100 sec bins |
 |
 |
| Module-wise count rates for Quadrant B Data is divided into 100 sec bins |
 |
 |
| Module-wise count rates for Quadrant C Data is divided into 100 sec bins |
 |
 |
| Module-wise count rates for Quadrant D Data is divided into 100 sec bins |
 |
 |
| Parameter | Plot |
|---|---|
| CZT HV Monitor |  |
| D_VDD | 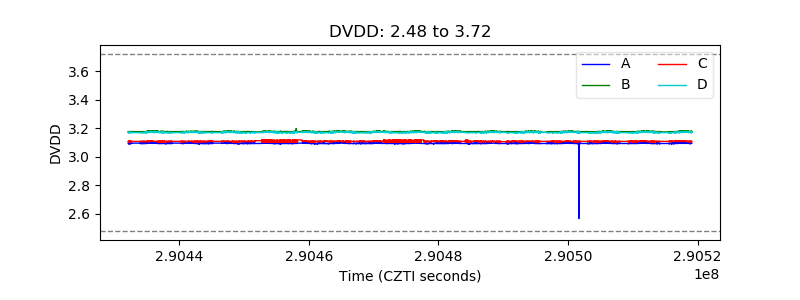 |
| Temperature 1 |  |
| Veto HV Monitor |  |
| Veto LLD |  |
| Alpha Counter |  |
| _CPM_Rate | 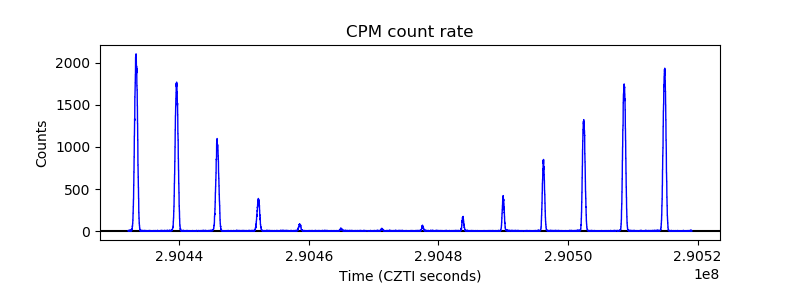 |
| CZT Counter |  |
| +2.5 Volts monitor | 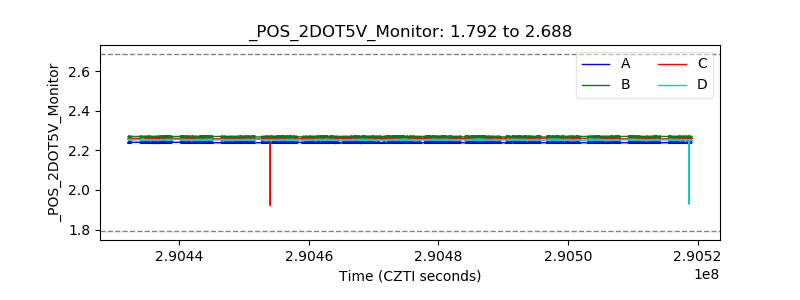 |
| +5 Volts monitor |  |
| _ROLL_ROT | 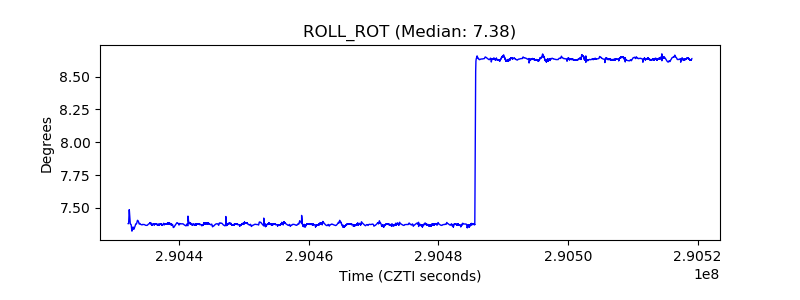 |
| _Roll_DEC |  |
| _Roll_RA | 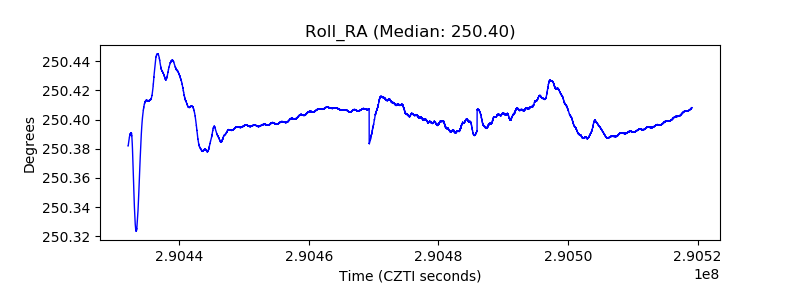 |
| Veto Counter |  |