| Param | Original file | Final file |
|---|---|---|
| Filename | modeM0/AS1A05_072T04_9000002802_18729cztM0_level2.evt | modeM0/AS1A05_072T04_9000002802_18729cztM0_level2_quad_clean.evt |
| Size (bytes) | 194,929,920 | 25,948,800 |
| Size | 185.9 MB | 24.7 MB |
| Events in quadrant A | 2,008,537 | 154,438 |
| Events in quadrant B | 1,280,824 | 163,899 |
| Events in quadrant C | 1,232,595 | 157,741 |
| Events in quadrant D | 1,235,842 | 155,759 |
| Mode SS | |||
|---|---|---|---|
| Quadrant | BADHDUFLAG | Total packets | Discarded packets |
| A | 0 | 46 | 0 |
| B | 0 | 46 | 0 |
| C | 0 | 46 | 0 |
| D | 0 | 46 | 0 |
| Mode M9 | |||
|---|---|---|---|
| Quadrant | BADHDUFLAG | Total packets | Discarded packets |
| A | 0 | 12 | 0 |
| B | 0 | 12 | 0 |
| C | 0 | 12 | 0 |
| D | 0 | 12 | 0 |
| Mode M0 | |||
|---|---|---|---|
| Quadrant | BADHDUFLAG | Total packets | Discarded packets |
| A | 0 | 7377 | 1 |
| B | 0 | 5233 | 1 |
| C | 0 | 5019 | 1 |
| D | 0 | 4997 | 1 |
| Quadrant | Total seconds | Saturated seconds | Saturation percentage |
|---|---|---|---|
| A | 2109 | 194 | 9.198672% |
| B | 2109 | 90 | 4.267425% |
| C | 2109 | 92 | 4.362257% |
| D | 2109 | 64 | 3.034614% |
Noise dominated data is calculated using 1-second bins in cleaned event files. If a bin has >2000 counts, and if more than 50% of those come from <1% of pixels, then it is considered to be noise-dominated and hence unusable.
| Quadrant | # 1 sec bins | Bins with >0 counts | Bins with >2000 counts | High rate bins dominated by noise | Noise dominated (total time) | Noise dominated (detector-on time) | Marked lightcurve |
|---|---|---|---|---|---|---|---|
| A | 3369 | 2110 | 53 | 53 | 1.57% | 2.51% | 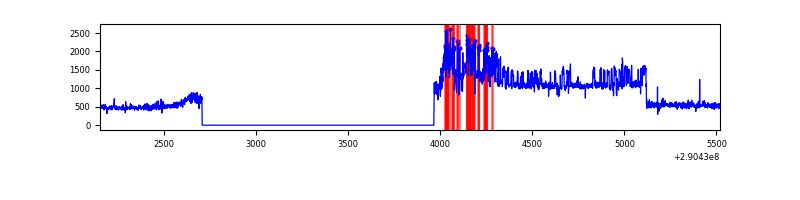 |
| B | 3369 | 2110 | 1 | 1 | 0.03% | 0.05% | 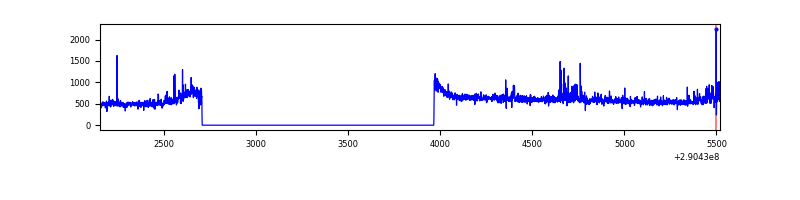 |
| C | 3369 | 2110 | 0 | 0 | 0.00% | 0.00% | 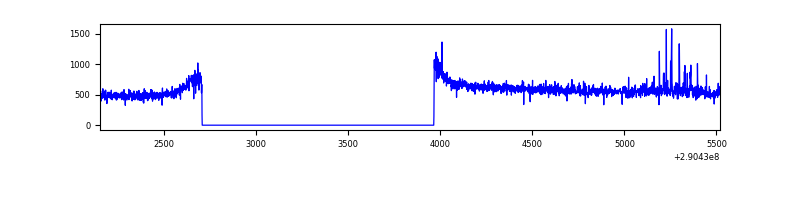 |
| D | 3369 | 2110 | 6 | 6 | 0.18% | 0.28% | 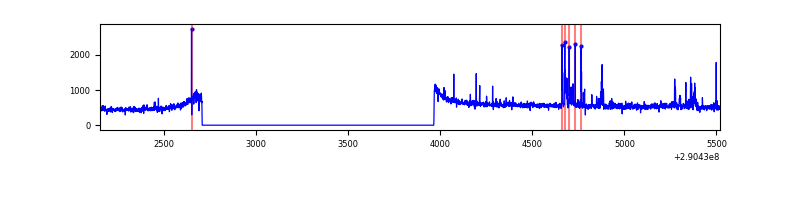 |
Top three noisy pixels from each quadrant. If the there are fewer than three noisy pixels in the level2.evt file, extra rows are filled as -1
| Pixel properties | Quadrant properties | ||||||
|---|---|---|---|---|---|---|---|
| Quadrant | DetID | PixID | Counts | Sigma | Mean | Median | Sigma |
| A | 14 | 4 | 794908 | 12511.18 | 313 | 307 | 63.5 |
| A | 14 | 111 | 3945 | 57.28 | 313 | 307 | 63.5 |
| A | 13 | 254 | 3412 | 48.89 | 313 | 307 | 63.5 |
| B | 10 | 245 | 41344 | 688.59 | 309 | 303 | 59.6 |
| B | 7 | 220 | 13387 | 219.52 | 309 | 303 | 59.6 |
| B | 12 | 111 | 6620 | 105.99 | 309 | 303 | 59.6 |
| C | 14 | 238 | 47374 | 675.59 | 297 | 298 | 69.7 |
| C | 0 | 207 | 24897 | 353.02 | 297 | 298 | 69.7 |
| C | 13 | 61 | 2042 | 25.03 | 297 | 298 | 69.7 |
| D | 14 | 34 | 47471 | 635.68 | 305 | 297 | 74.2 |
| D | 10 | 70 | 18620 | 246.91 | 305 | 297 | 74.2 |
| D | 2 | 234 | 8532 | 110.97 | 305 | 297 | 74.2 |
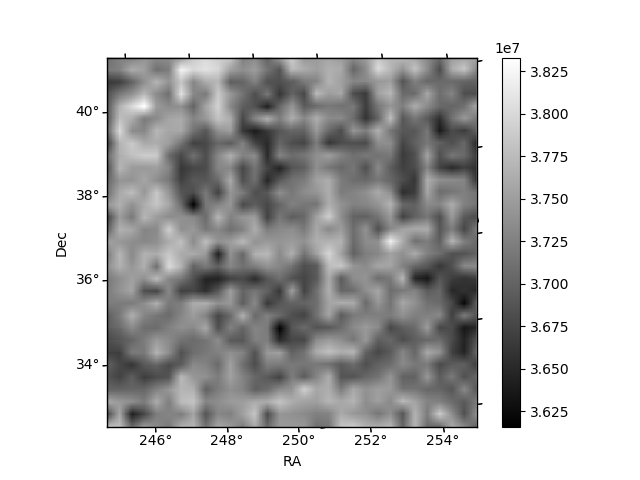
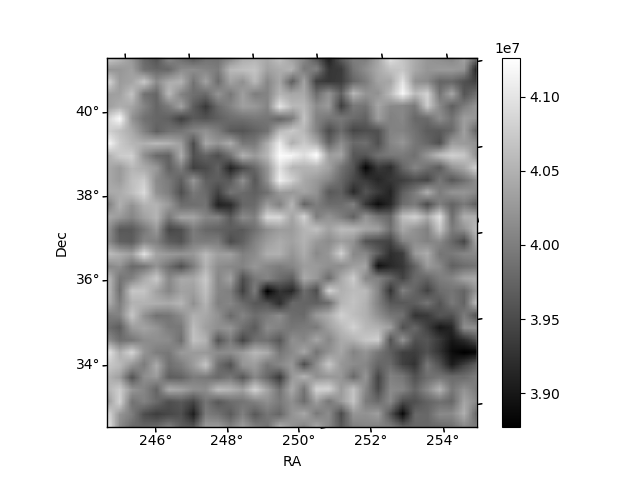
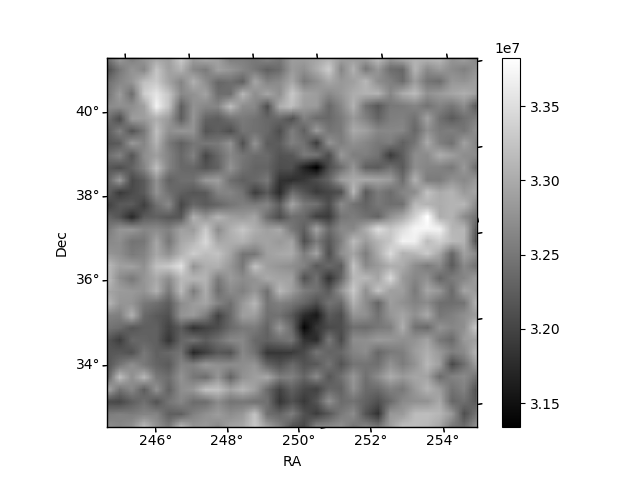
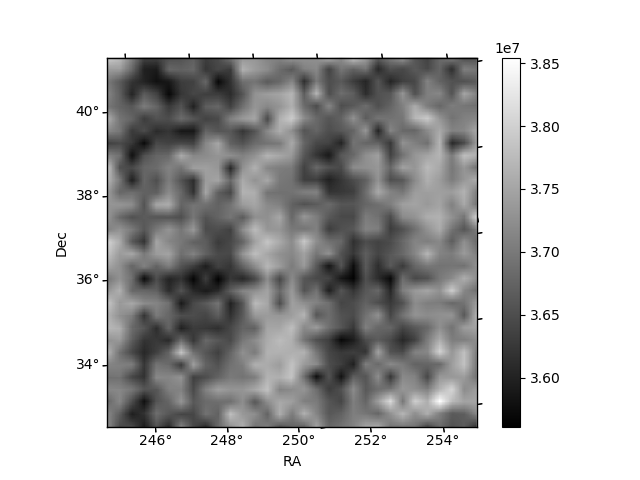
Histogram calculated using DETX and DETY for each event in the final _common_clean file
| Quadrant A | 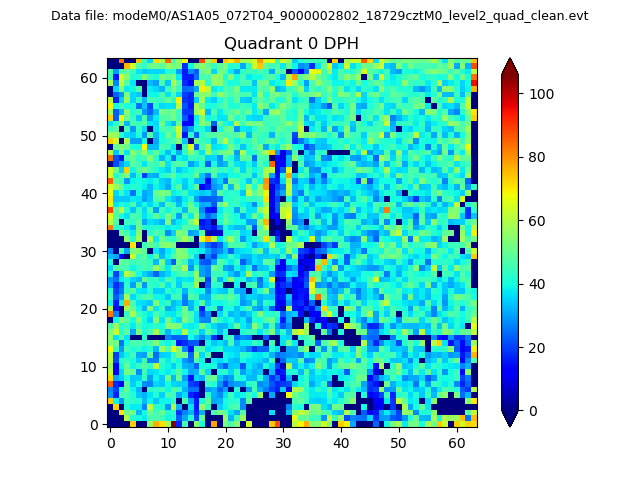 |
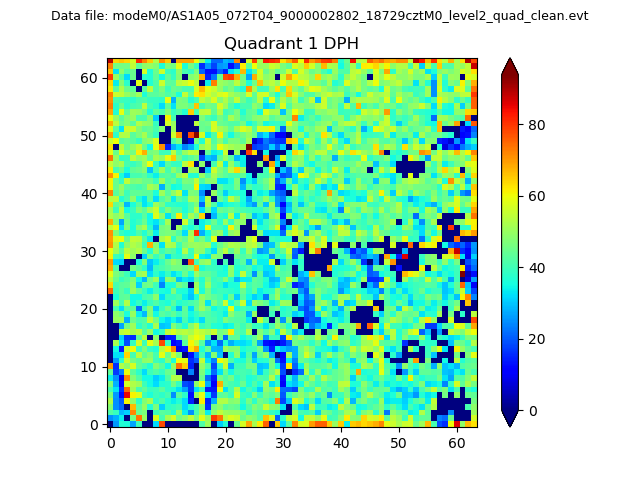 |
Quadrant B |
|---|---|---|---|
| Quadrant D | 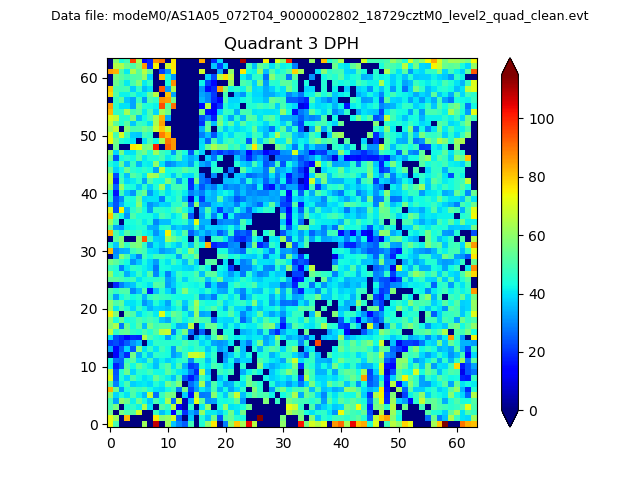 |
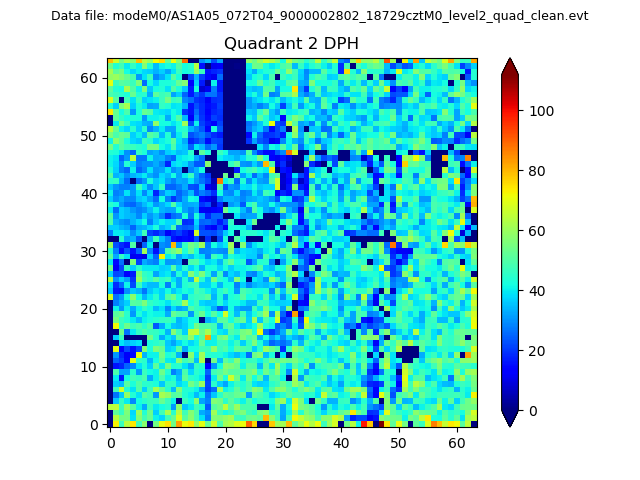 |
Quadrant C |
| Plot type | Count rate plots | Images |
|---|---|---|
| Comparison with Poisson distribution Blue bars denote a histogram of data divided into 1 sec bins. Red curve is a Poisson curve with rate = median count rate of data. |
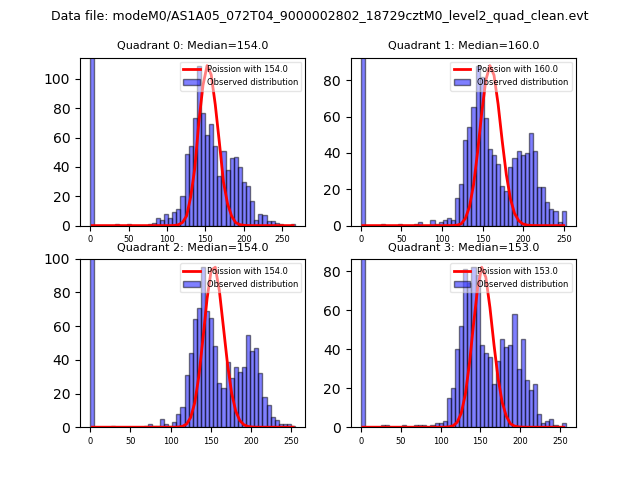 |
 |
| Quadrant-wise count rates Data is divided into 100 sec bins |
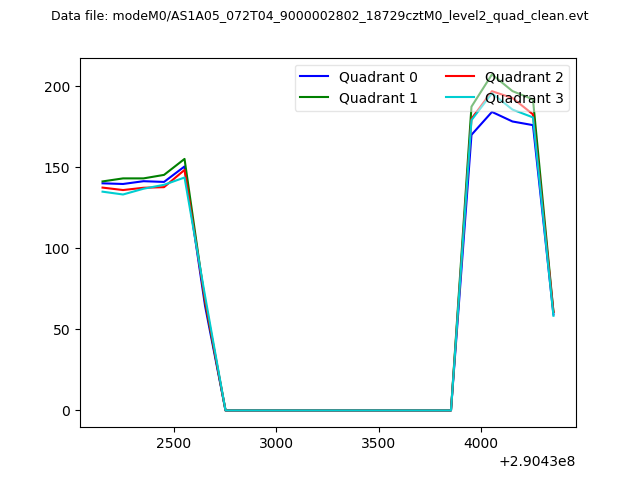 |
|
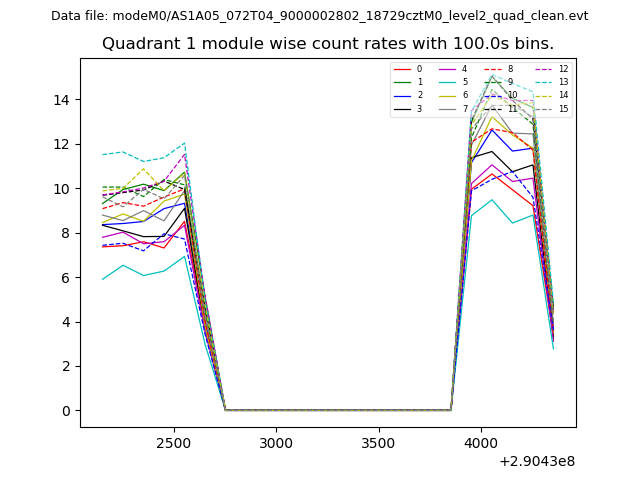
| Module-wise count rates for Quadrant A Data is divided into 100 sec bins |
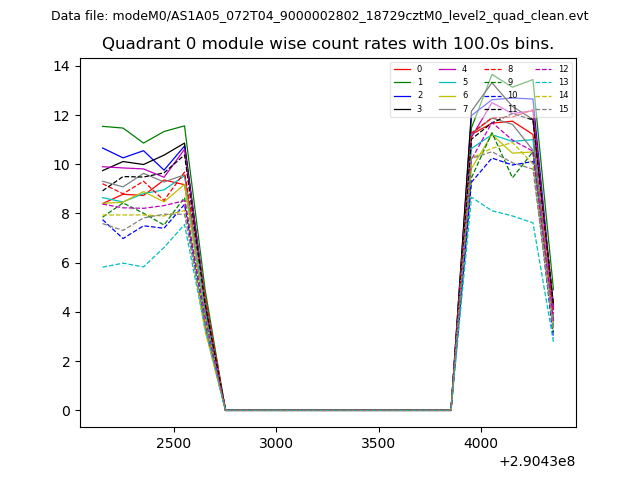 |
 |
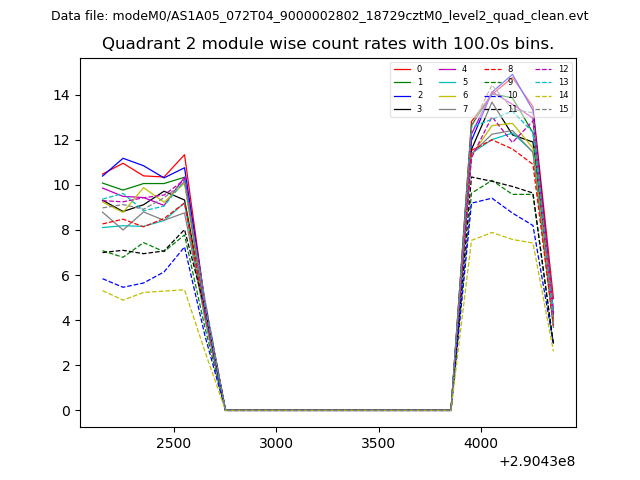
| Module-wise count rates for Quadrant B Data is divided into 100 sec bins |
 |
 |
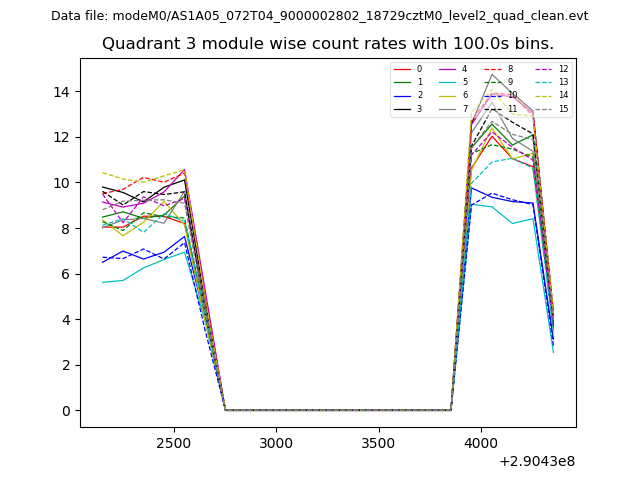
| Module-wise count rates for Quadrant C Data is divided into 100 sec bins |
 |
 |
| Module-wise count rates for Quadrant D Data is divided into 100 sec bins |
 |
 |
| Parameter | Plot |
|---|---|
| CZT HV Monitor | 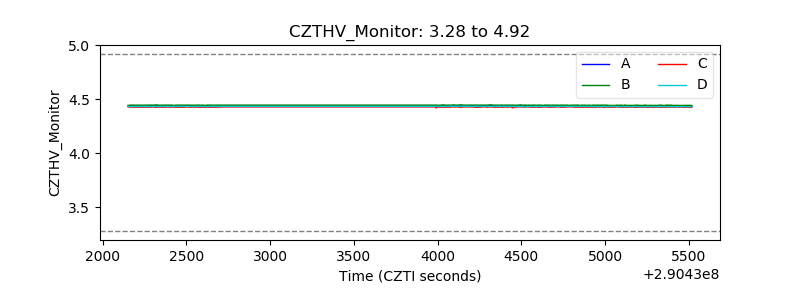 |
| D_VDD | 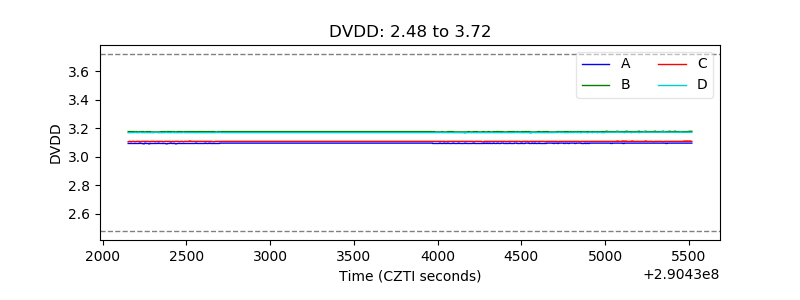 |
| Temperature 1 | 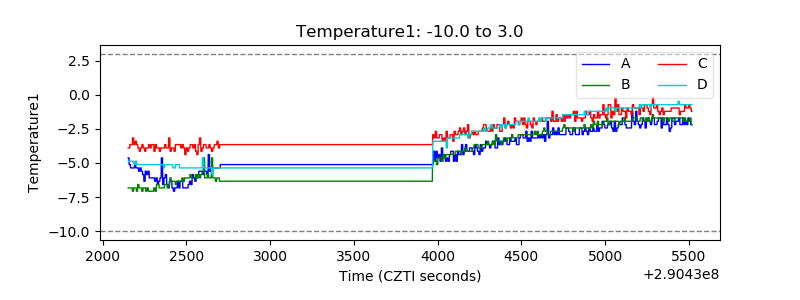 |
| Veto HV Monitor | 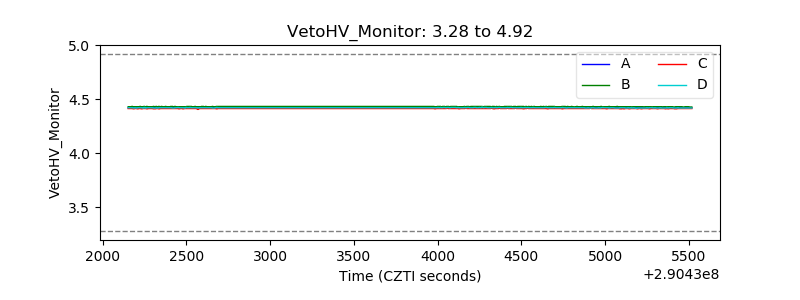 |
| Veto LLD | 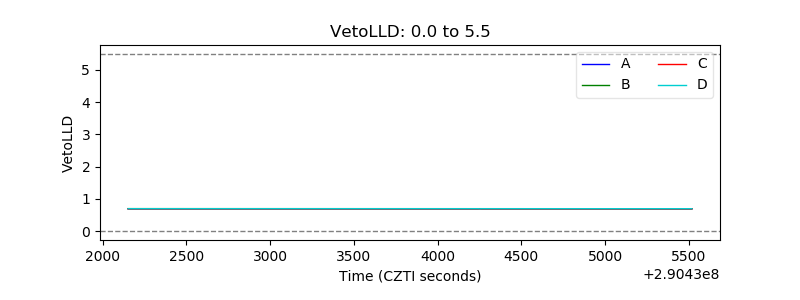 |
| Alpha Counter | 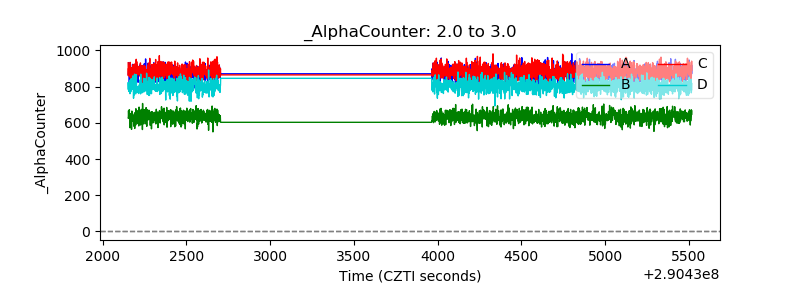 |
| _CPM_Rate | 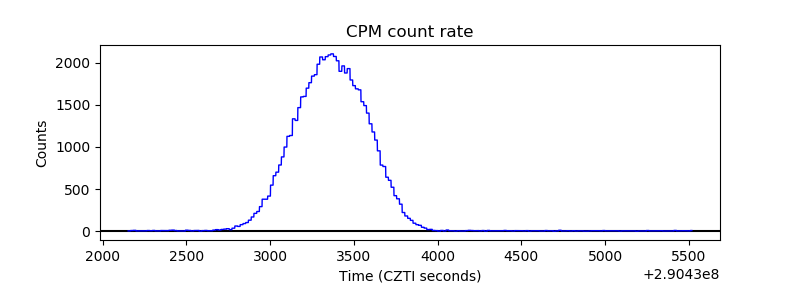 |
| CZT Counter | 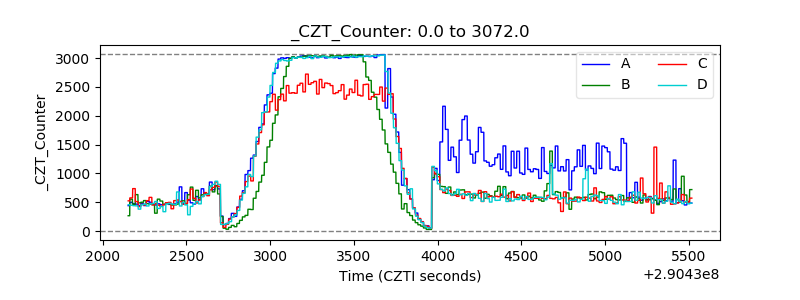 |
| +2.5 Volts monitor |  |
| +5 Volts monitor |  |
| _ROLL_ROT | 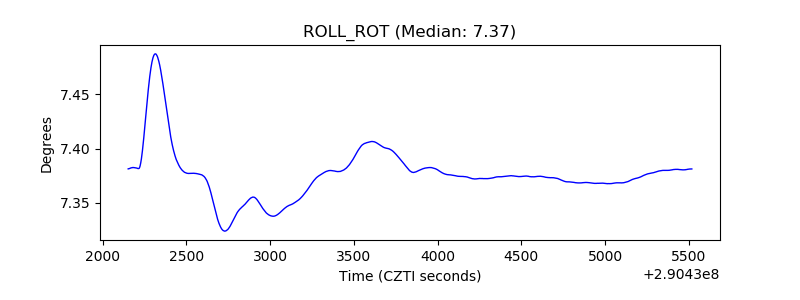 |
| _Roll_DEC | 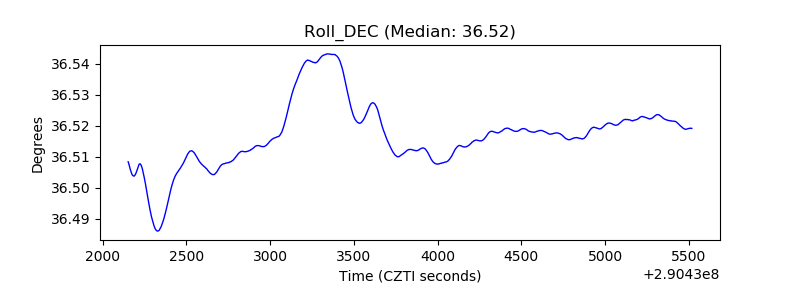 |
| _Roll_RA | 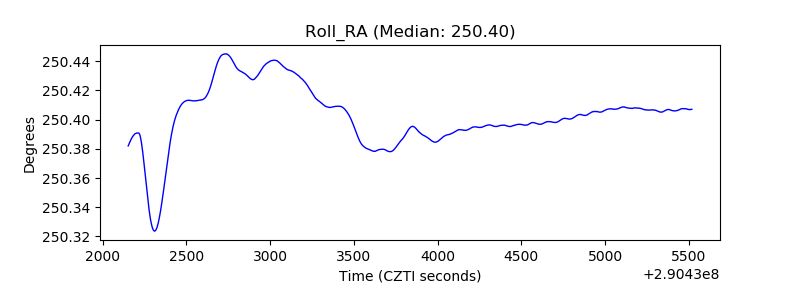 |
| Veto Counter | 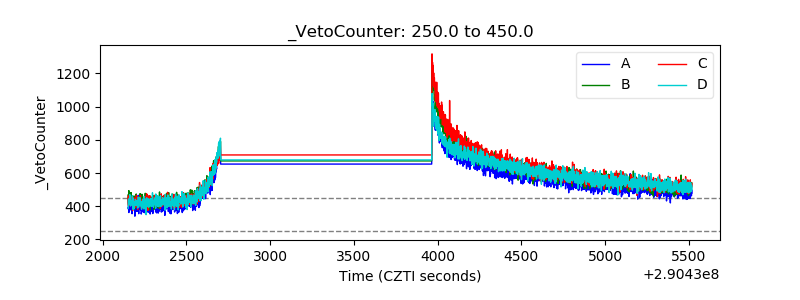 |